
📺 Watch the Full Video Analysis
This article was automatically generated by the NFC Market Live AI analysis system. (Updated: 2026-06-24 05:15 JST)
Deep dive into FedEx (NYSE:FDX) fiscal Q4 2026 results. Revenue hit $25.0B (+13% YoY) with adjusted EPS of $6.31. GAAP operating margin slipped to 6.2% from 8.1% on spinoff and optimization costs. We analyze the completed FedEx Freight spinoff, record-low capex intensity of 4.0%, the cash build to $13.3B, and CY2026 guidance for English-speaking investors.
サマリー:増収増益、だが報告利益率は低下
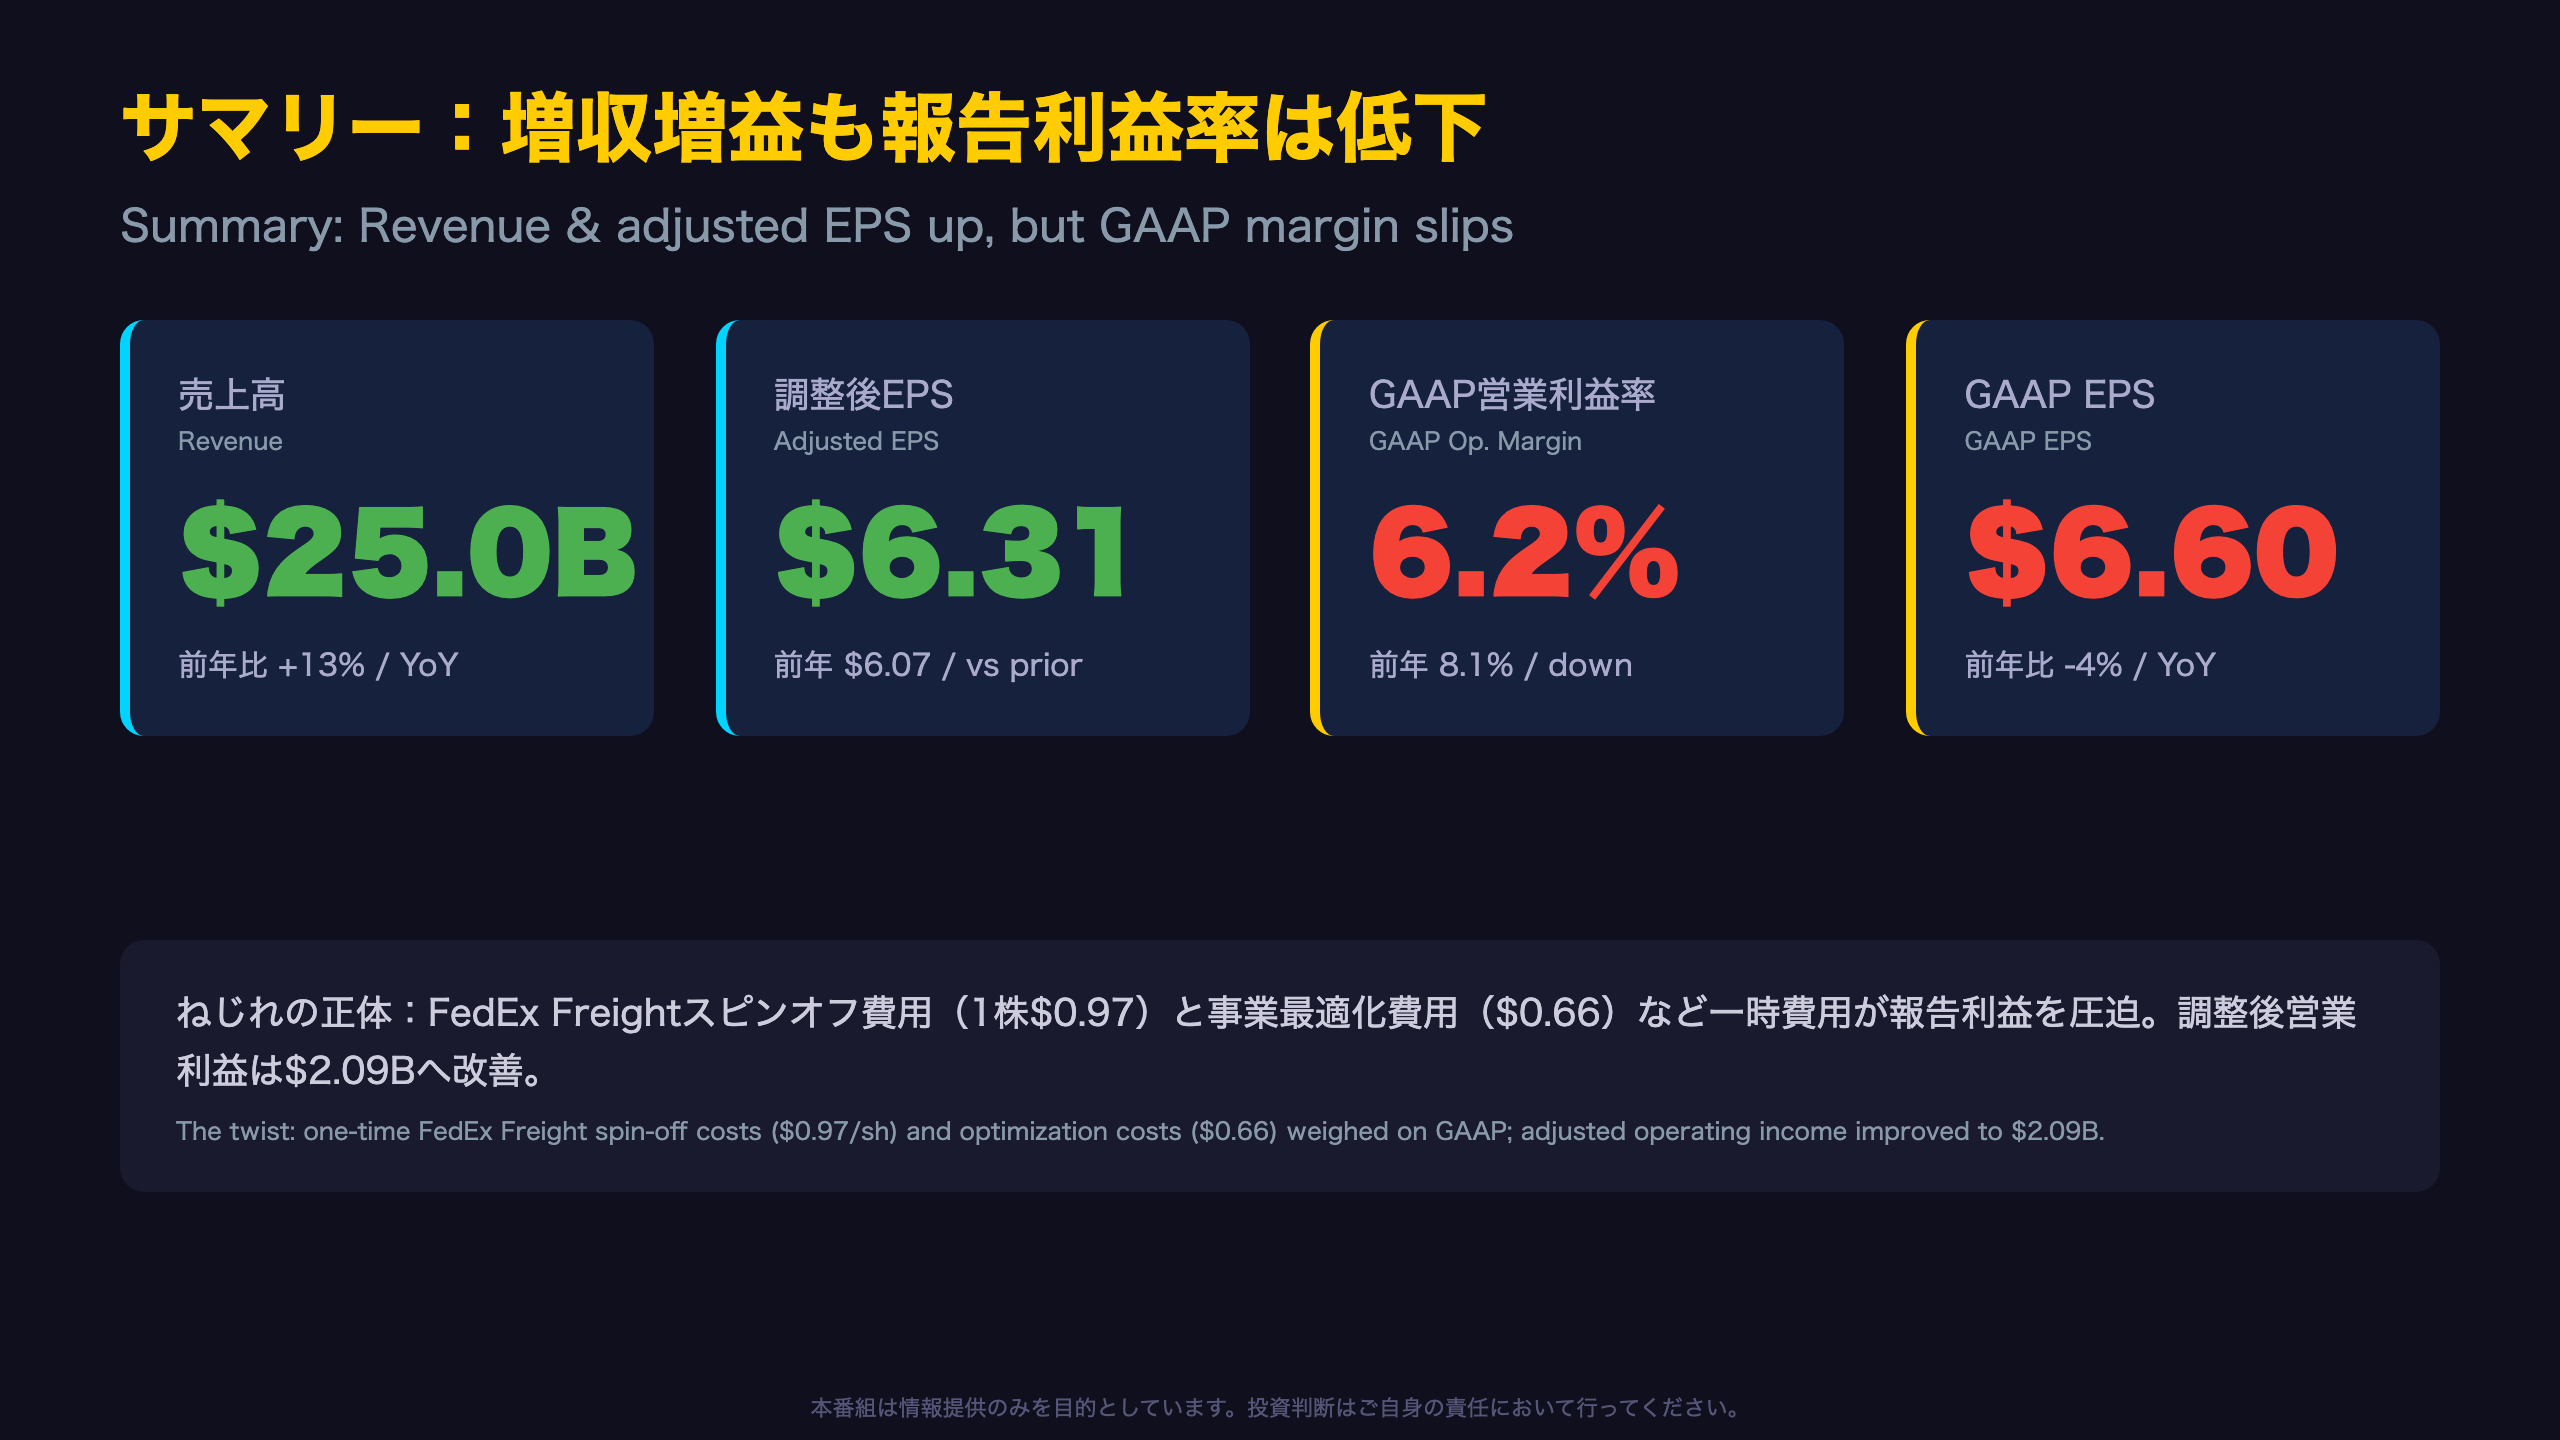
Summary: Two Faces of the Same Quarter
FedEx’s fiscal Q4 2026 is a results set whose verdict depends entirely on the lens you use.
The headline tension
Revenue grew 13% to $25.0B, and adjusted EPS rose to $6.31 from $6.07. Yet on a GAAP basis, operating margin fell from 8.1% to 6.2% and EPS dropped 4% to $6.60. For investors unfamiliar with FedEx, the key context is the FedEx Freight spin-off, completed June 1, 2026, which separated the less-than-truckload (LTL) freight business into a standalone NYSE-listed company. The release notes spin-off costs of $0.97 per share in the quarter alone, plus $0.66 of business optimization costs tied to its Network 2.0 and DRIVE transformation programs.
Bull vs. bear framing
- Bull case: Strip out one-time items and adjusted operating income improved to $2.09B, driven by higher U.S. domestic and International Priority yields and over $1B of structural cost savings.
- Bear case: GAAP EPS still declined 4%, and the sheer size of the adjustments signals a company mid-transformation rather than one already reaping steady-state gains.
Why it matters internationally
FedEx is widely treated as a real-time barometer of global trade and e-commerce demand—often read alongside UPS and the broader transports complex. The 13% top-line growth alongside a margin dip will fuel debate over whether this is operating leverage building or simply restructuring noise. The next sections dissect the segment-level profit drivers behind the headline.
Deep Dive①:本業Federal Expressの単価ドライブ
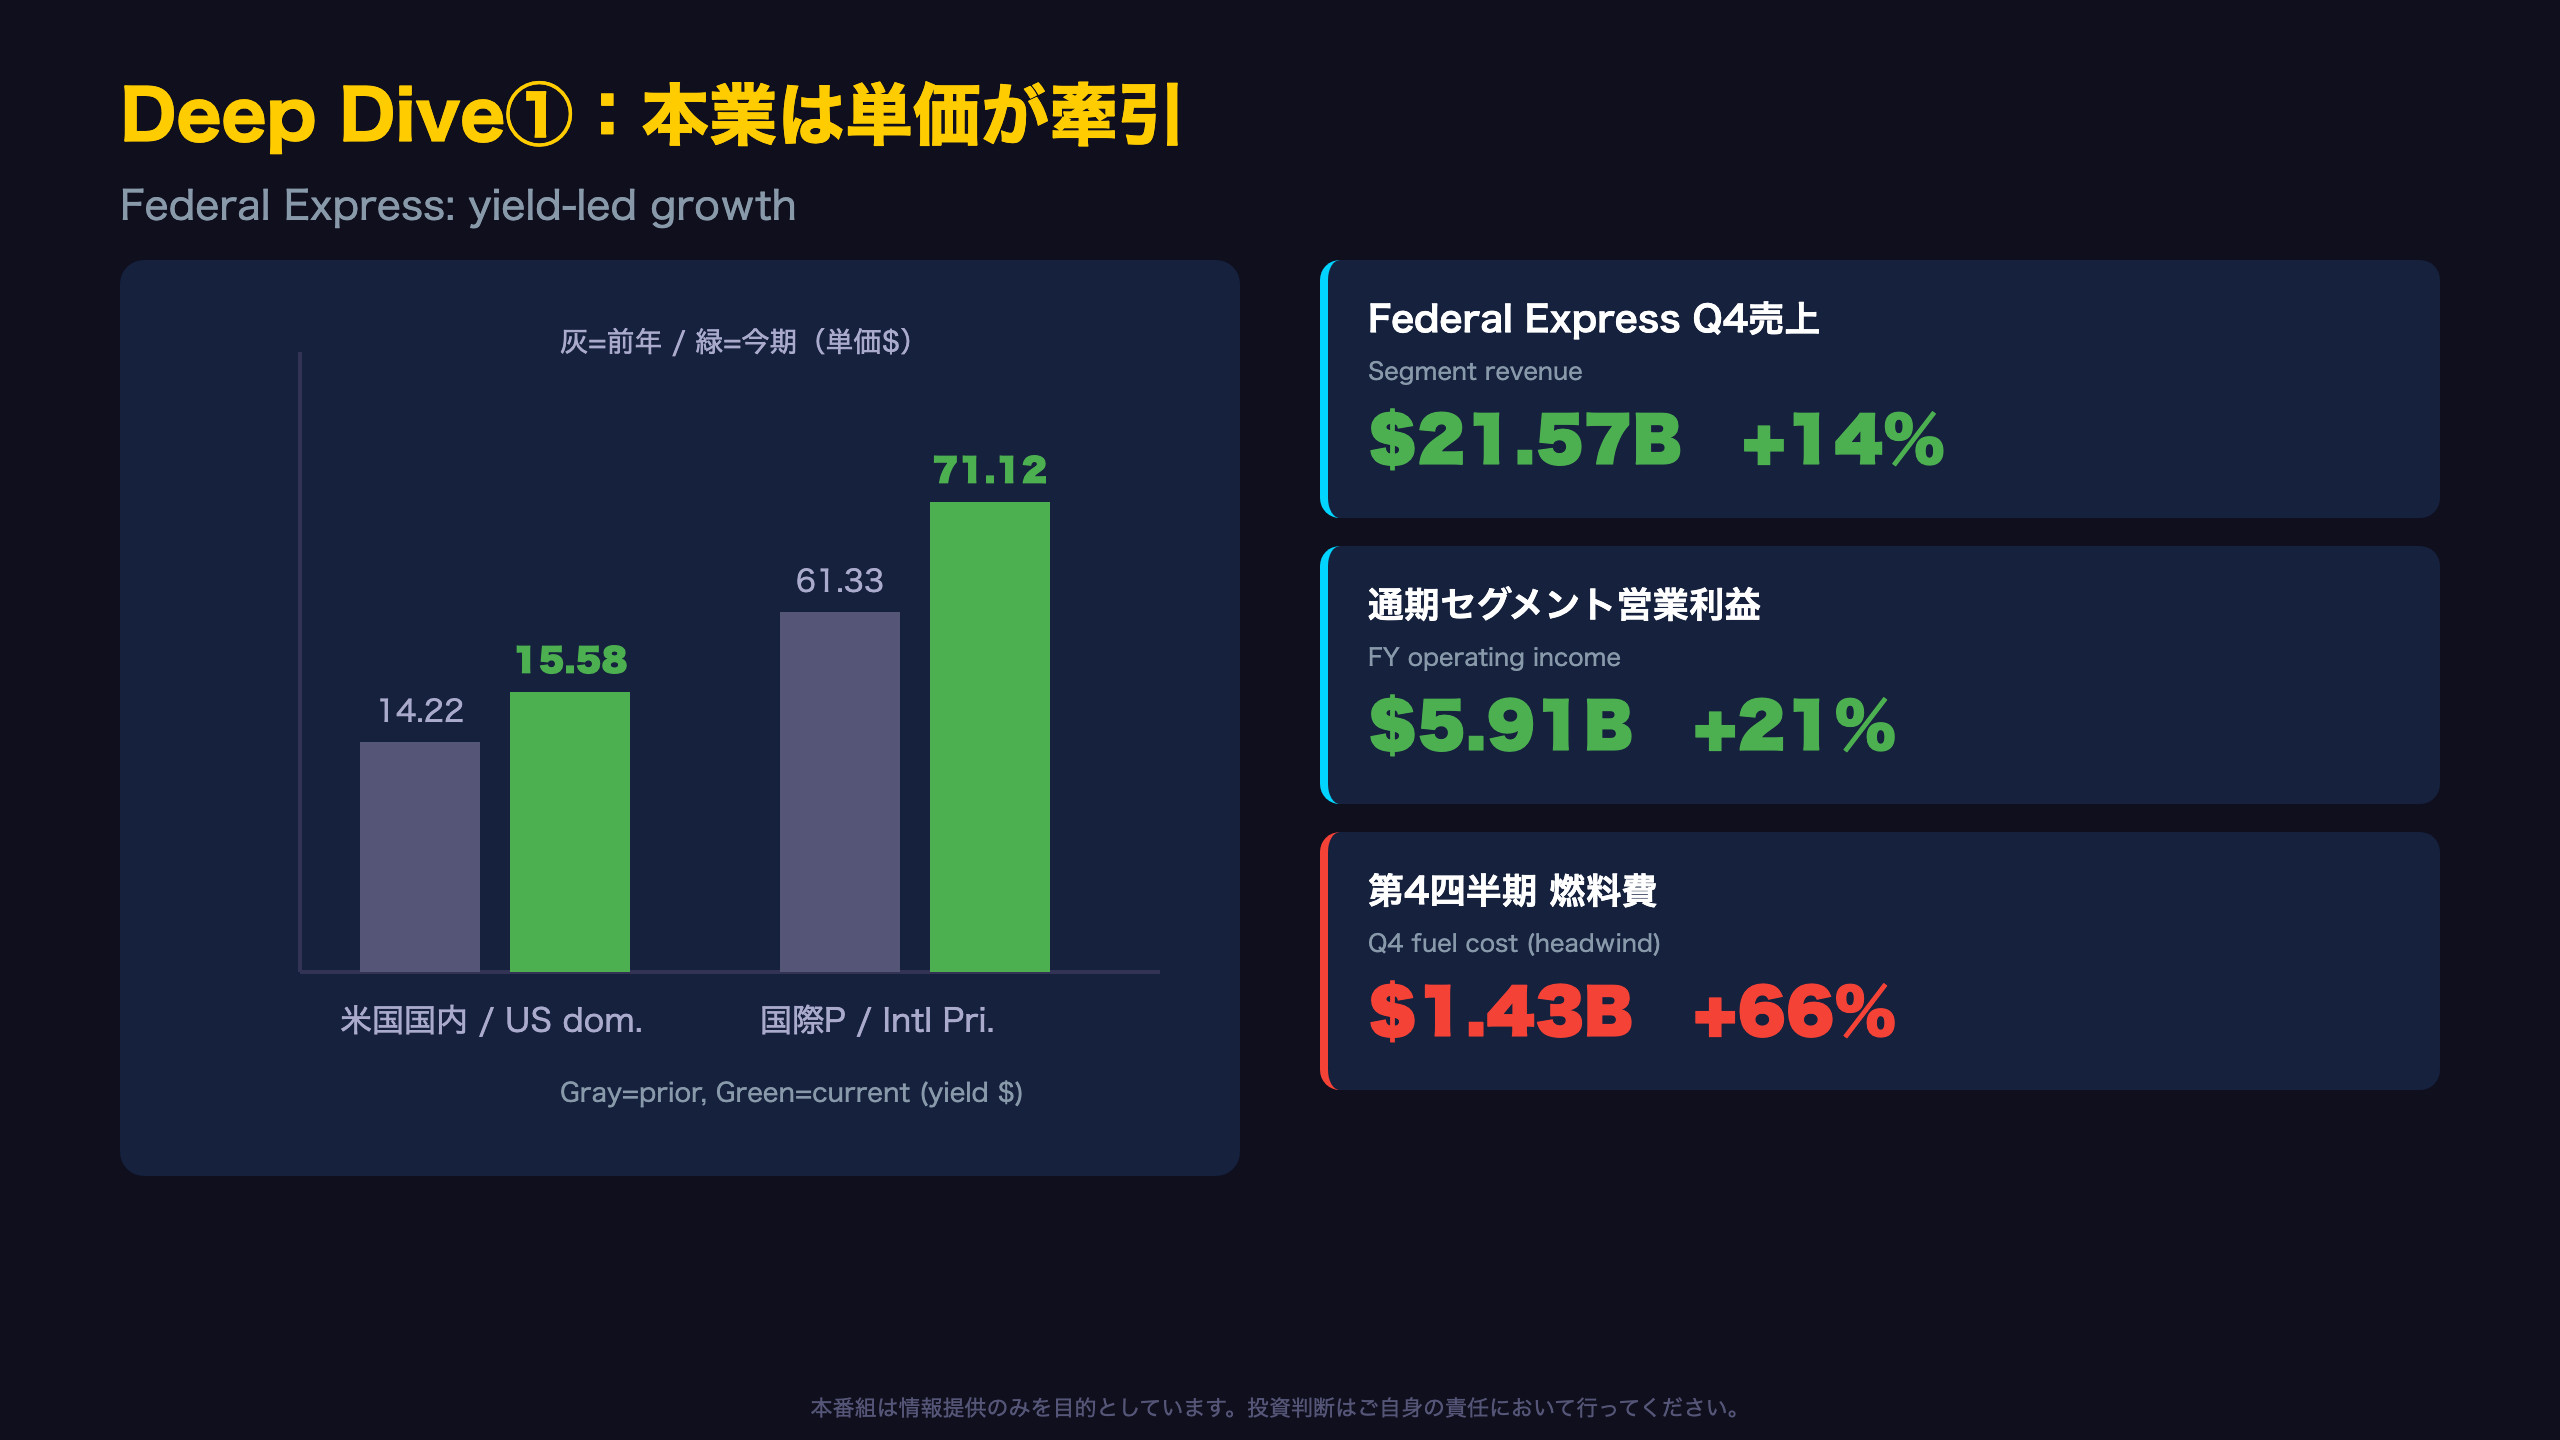
Deep Dive 1: A Yield-Driven Top Line
The quality of FedEx’s revenue growth hinges on a volume-versus-yield split, and this quarter was unambiguously yield-led.
Pricing power on display (FY26 Q4)
| Metric | FY26 Q4 | FY25 Q4 | YoY |
|---|---|---|---|
| U.S. domestic composite yield | $15.58 | $14.22 | +10% |
| International Priority yield | $71.12 | $61.33 | +16% |
| Total avg daily volume | 17,083k | 16,794k | +2% |
With package volume up just 2% but yields rising double digits, the growth reflects pricing and mix shift toward higher-value Priority products rather than raw shipment gains. For international readers: the Federal Express segment now houses both express air and the former Ground operations following FedEx’s network consolidation under “Network 2.0.”
Full-year margin progress
Federal Express full-year operating income hit $5.91B, up 21% from $4.89B, lifting the margin 70bps to 7.2%. The release states FedEx “exceeded its goal of $1 billion of transformation-related cost savings,” a notable structural-cost milestone.
The offsetting headwinds
- Q4 fuel cost surged 66% to $1.43B
- Purchased transportation rose 15%
- Wage rates and variable incentive comp increased
The fact that yield gains absorbed these cost pressures is the bull’s key evidence. But fuel-price sensitivity—amplified by Middle East and Russia-Ukraine geopolitical risk flagged in the release—keeps margin durability an open question.
Deep Dive②:FedEx Freightの利益率急落とスピンオフ
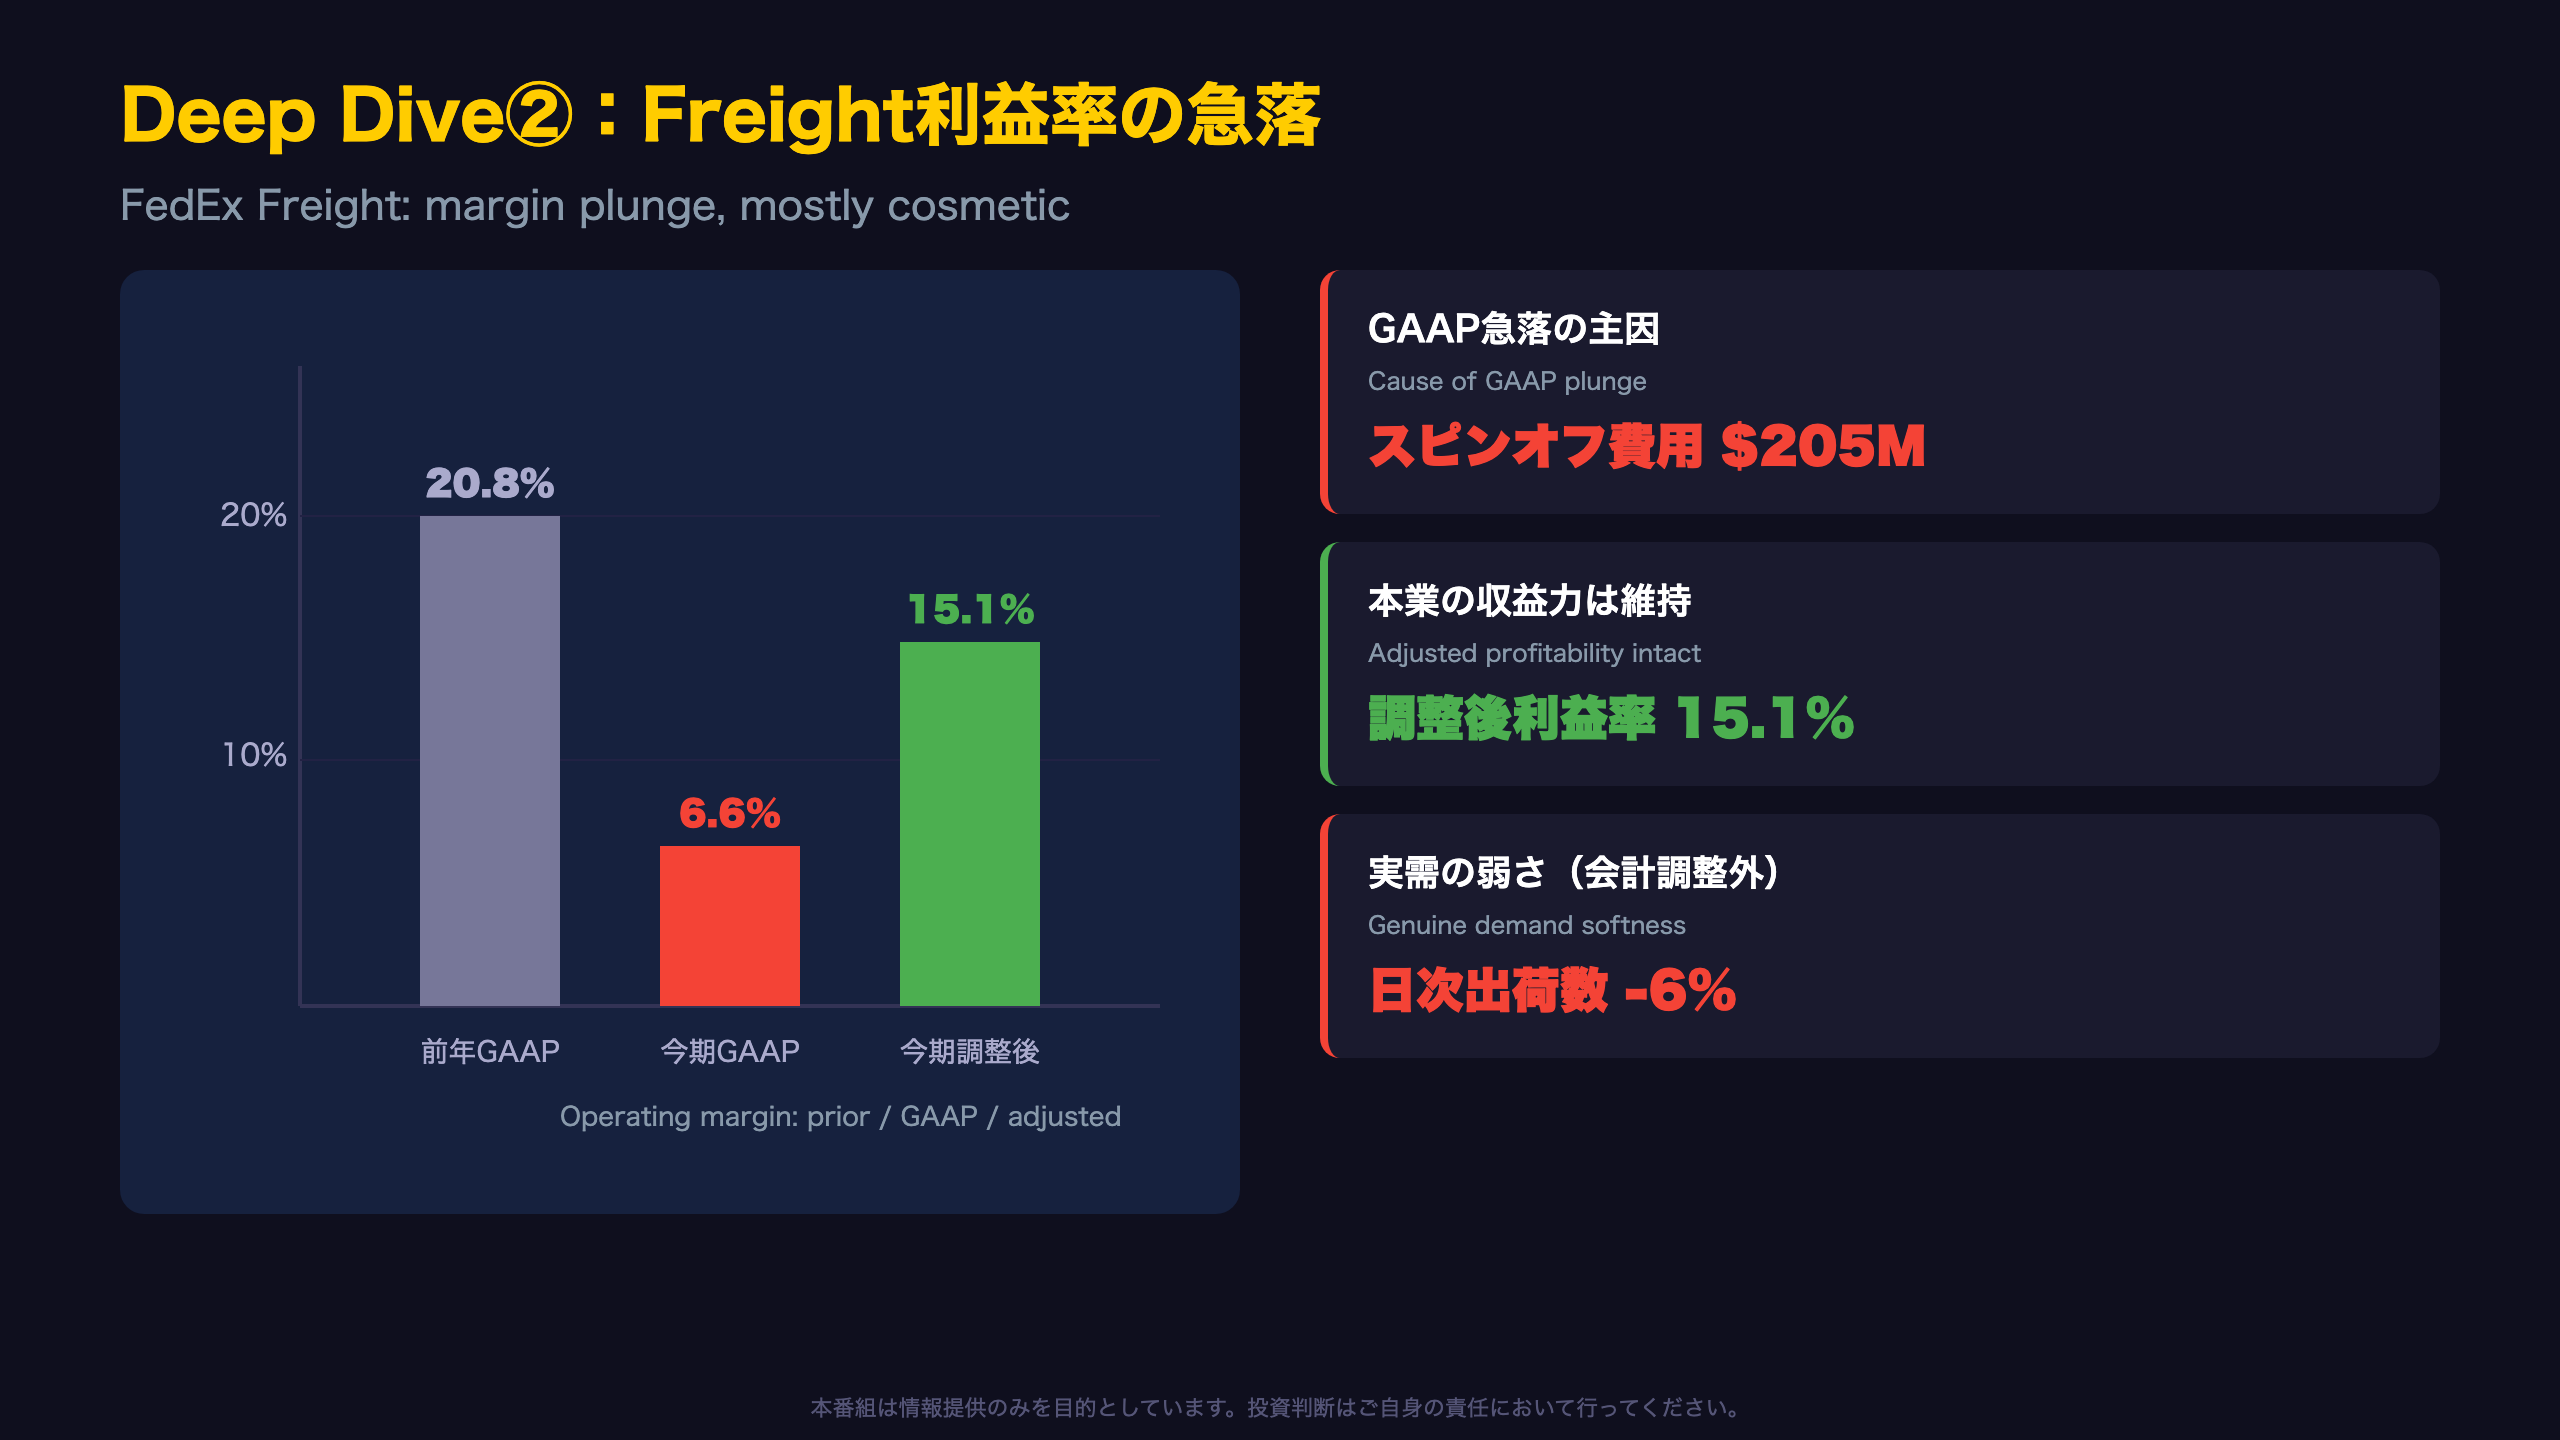
Deep Dive 2: A Cosmetic Plunge vs. a Real Soft Spot
The FedEx Freight segment demands the most careful reading this quarter.
The headline shock
| Metric | FY26 Q4 | FY25 Q4 | Change |
|---|---|---|---|
| GAAP operating income | $158M | $477M | -67% |
| GAAP operating margin | 6.6% | 20.8% | -1420bp |
| Adjusted margin | 15.1% | — | — |
| Avg daily shipments | 86.7k | 92.1k | -6% |
What the plunge really is
The GAAP margin collapse was driven by $205M of “separation and other costs” tied to the June 1 spin-off. The release classifies these as “unrelated to our core operating performance,” and on an adjusted basis the margin held at a healthy 15.1%. For context, FedEx Freight is the largest U.S. less-than-truckload (LTL) carrier, and LTL margins are structurally high—so the cosmetic drop should not be confused with operational deterioration.
But there is a genuine weak signal
Even excluding one-time costs, demand softened: average daily shipments fell 6% YoY, with Priority down 5% and Economy down 8%. This is volume, not accounting—potentially reflecting weaker U.S. industrial/freight demand. Composite revenue per shipment rose 11%, meaning pricing offset the volume decline. This dynamic mirrors broader LTL-industry trends investors track via peers like Old Dominion.
Implication for FDX holders
Since June 1, FedEx Freight trades as a standalone company. Going forward, FedEx (FDX) results will be evaluated on a continuing-operations basis excluding Freight, which is why CY2026 guidance is presented against a recast baseline. Investors should recalibrate their models accordingly.
Deep Dive③:キャッシュ創出と資本効率の改善
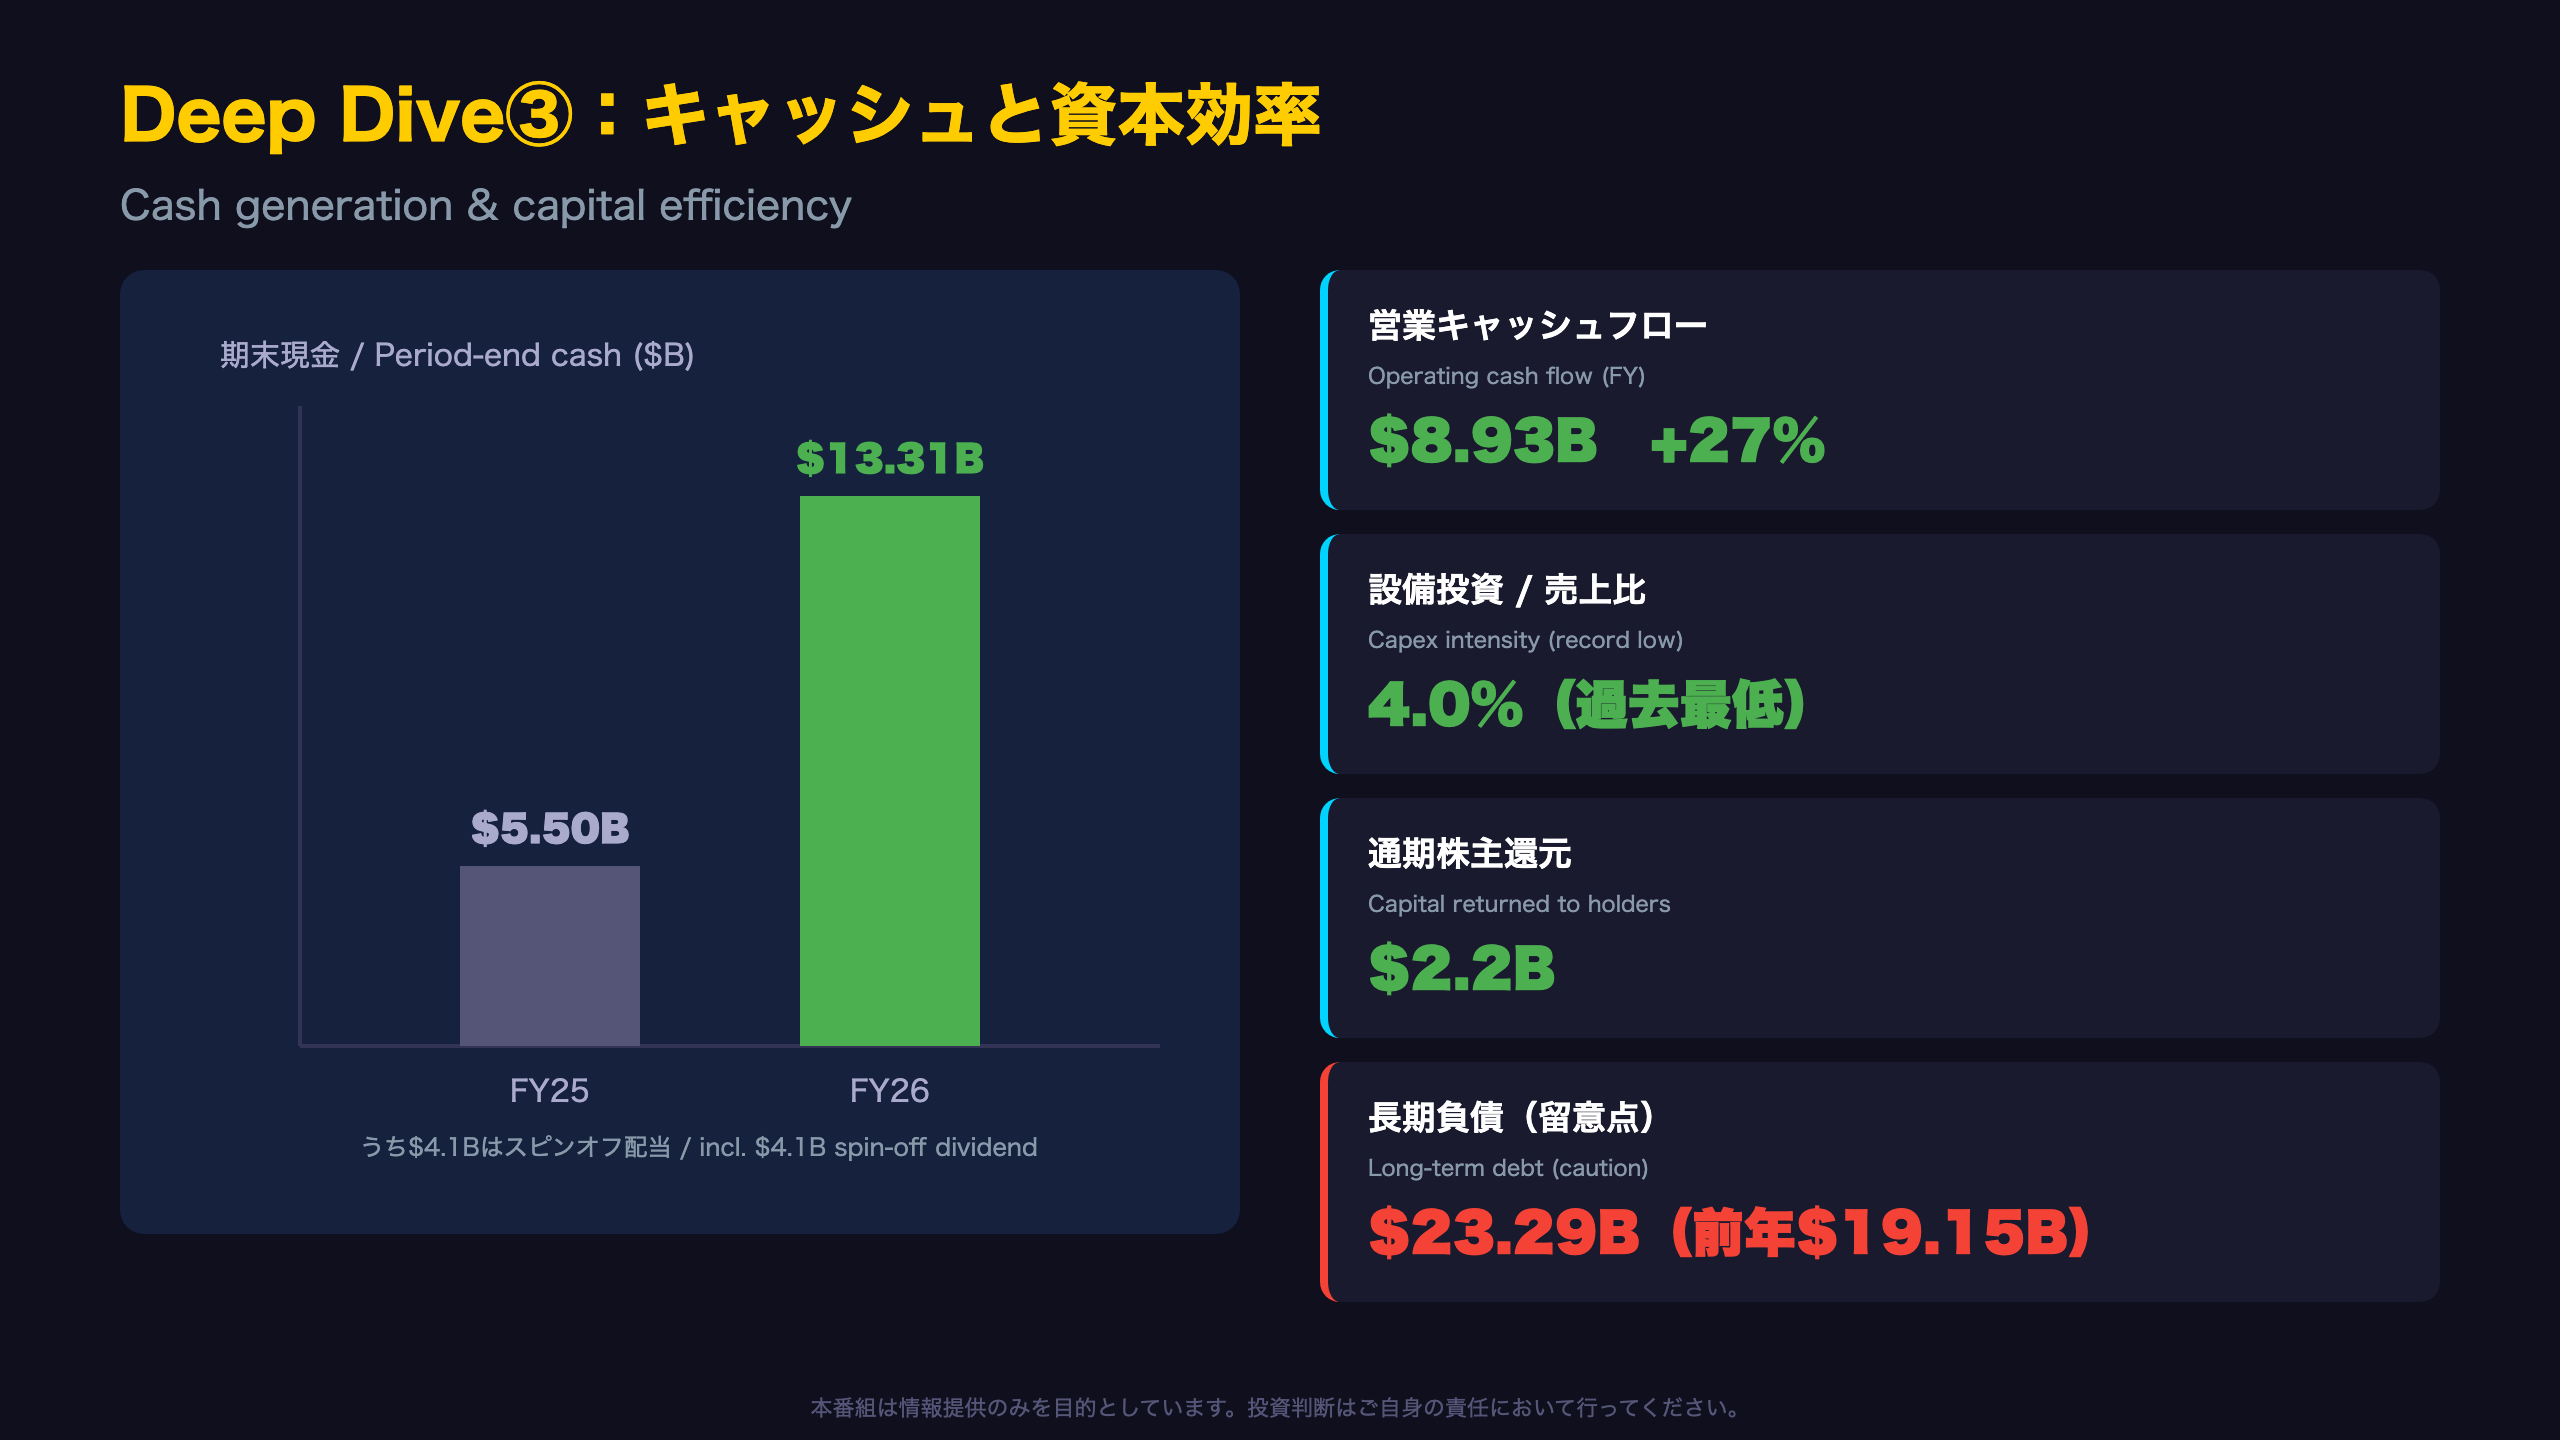
Deep Dive 3: Cash Generation Is the Real Headliner
More than the revenue beat or segment divergence, the structurally important story is cash and capital efficiency.
Cash flow improvement
| Metric | FY26 | FY25 | YoY |
|---|---|---|---|
| Operating cash flow | $8.93B | $7.04B | +27% |
| Capex | $3.81B | $4.06B | -6% |
| Capex/revenue | 4.0% | — | record low |
| Period-end cash | $13.31B | $5.50B | +142% |
Why “record-low capex intensity” matters
The release states capex fell to “4.0%, the lowest annual level in FedEx Corporation history.” Management frames this as a result of network optimization (Network 2.0) rather than underinvestment. When operating cash flow rises 27% while capex is restrained, free cash flow expands structurally—exactly what interim CFO Claude Russ flagged as the company’s “resolute focus.”
A caveat on the $13.3B cash pile
Of the $13.31B period-end cash, ~$4.1B is the spin-off dividend and ~$800M is IEEPA tariff refunds held for customers—not recurring operating cash. (IEEPA refers to U.S. emergency tariff authority; refunds arose from recent judicial rulings.) Investors should discount these when assessing underlying liquidity.
Capital returns vs. balance sheet
- Bull: $2.2B returned in FY26 ($776M buybacks + $1.4B dividends), a planned 5% CY2026 dividend hike, and up to $1B of additional buybacks.
- Caution: Long-term debt rose to $23.29B from $19.15B, reflecting February’s $3.7B senior notes offering. Higher leverage could become a cost factor depending on the rate environment.
インプリケーション:CY2026ガイダンスと市場含意
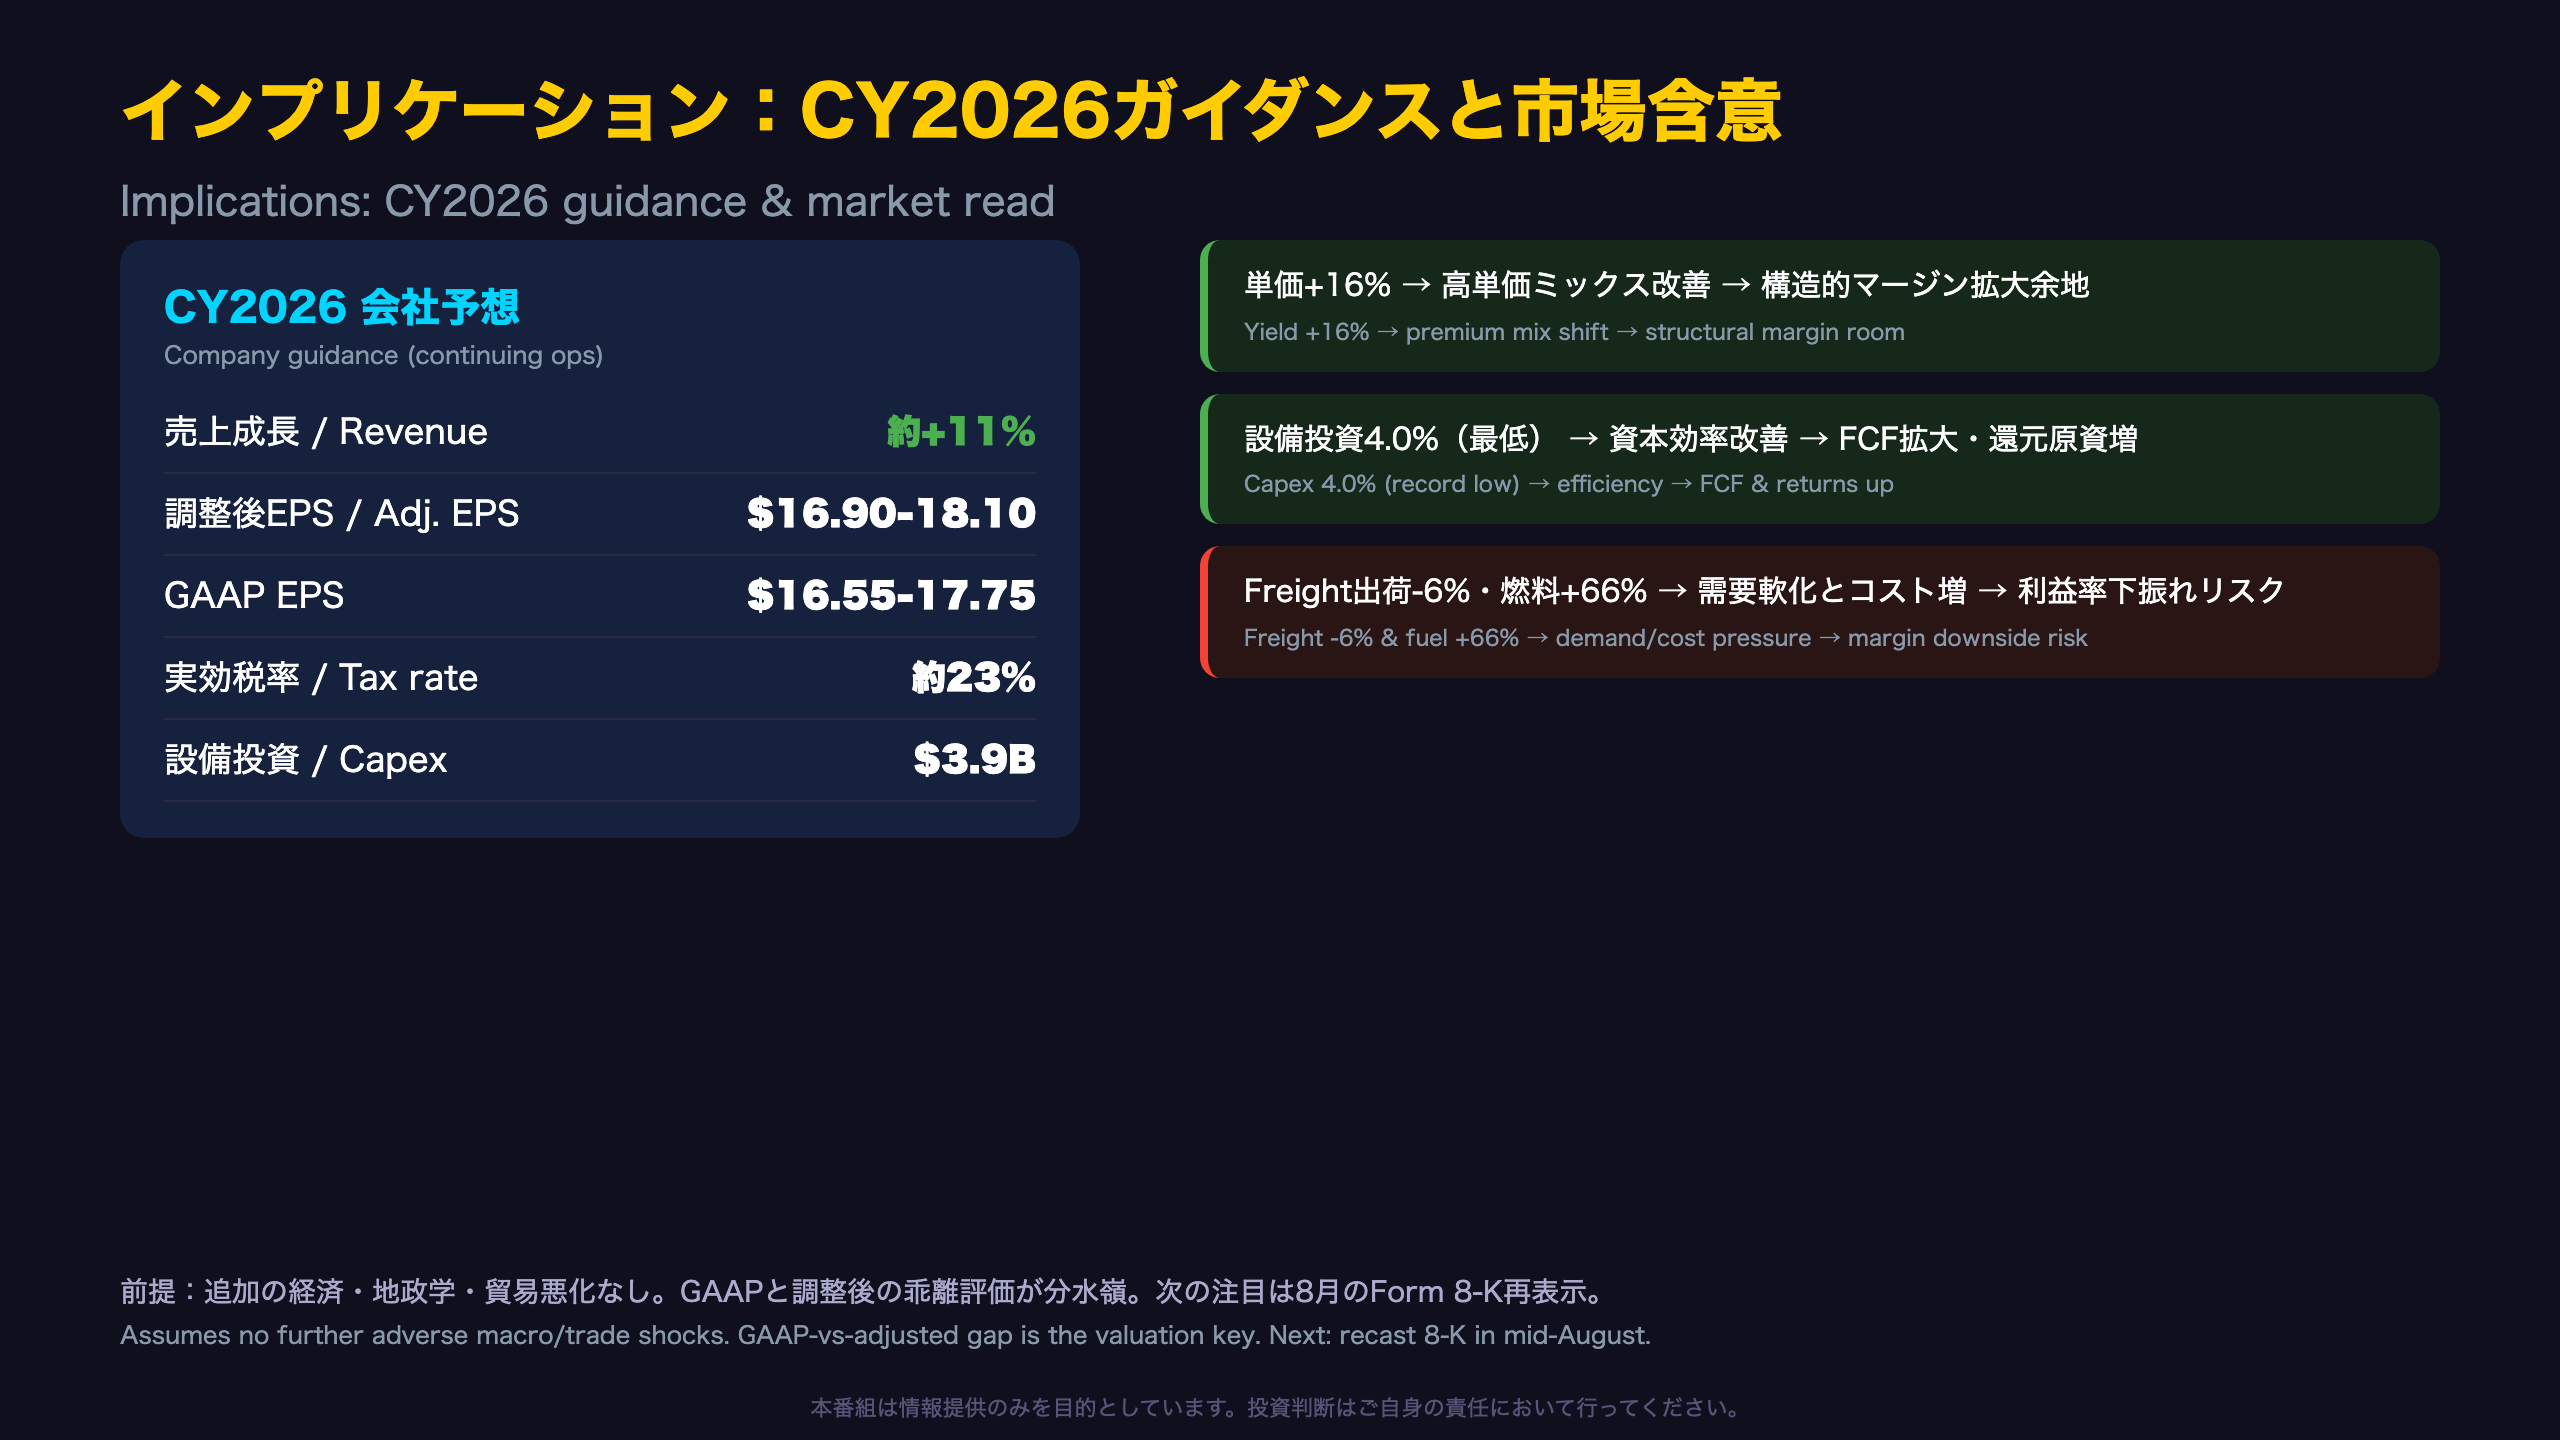
Implications: The Valuation Dividing Line
Parsing CY2026 guidance
| Item | CY2026 forecast |
|---|---|
| Revenue growth | ~+11% YoY |
| Adj. EPS (continuing ops) | $16.90-$18.10 |
| GAAP EPS (continuing ops) | $16.55-$17.75 |
| Effective tax rate | ~23% |
| Capex | $3.9B |
Crucially, this guidance is presented on a continuing-operations basis that treats FedEx Freight as discontinued. With CY2025 recast adjusted EPS at $15.00, the outlook implies double-digit EPS growth on the new baseline.
Chain of evidence: market implications
Implication 1 (strength)
Intl Priority yield +16% (data) → mix shift toward higher-value services (mechanism) → structural margin-expansion room (market implication)
Implication 2 (strength)
Capex/revenue at a record-low 4.0% (data) → improved capital efficiency lifts FCF (mechanism) → larger pool for buybacks/dividends, supportive for valuation (implication)
Implication 3 (weakness)
Freight shipments -6%, fuel +66% (data) → coexisting demand softness and cost pressure (mechanism) → downside risk to margins (implication)
Key assumption
The release explicitly states guidance assumes “no additional adverse economic, geopolitical, or international trade-related developments.” Tariff and fuel-price uncertainty—both flagged among risk factors—are pivotal to delivery.
Bottom line
For English-speaking investors who treat FedEx as a global-trade bellwether, the takeaway is balanced: adjusted results show genuine strength in earnings and cash generation, while GAAP figures and Freight demand reveal real soft spots. Whether one reads the GAAP-vs-adjusted gap as transformation “investment” or as declining earnings quality will drive the valuation debate. The next catalyst: recast continuing-operations financials in a Form 8-K expected by mid-August 2026.
Disclaimer: This article is for informational purposes only. All investment decisions are made solely at your own risk.