📺 Watch the Full Video Analysis
This article was automatically generated by the NFC Market Live AI analysis system. (Updated: 2026-10-01 05:12 JST)
📊 Micron Technology (MU) reported fiscal Q4 2026 results.
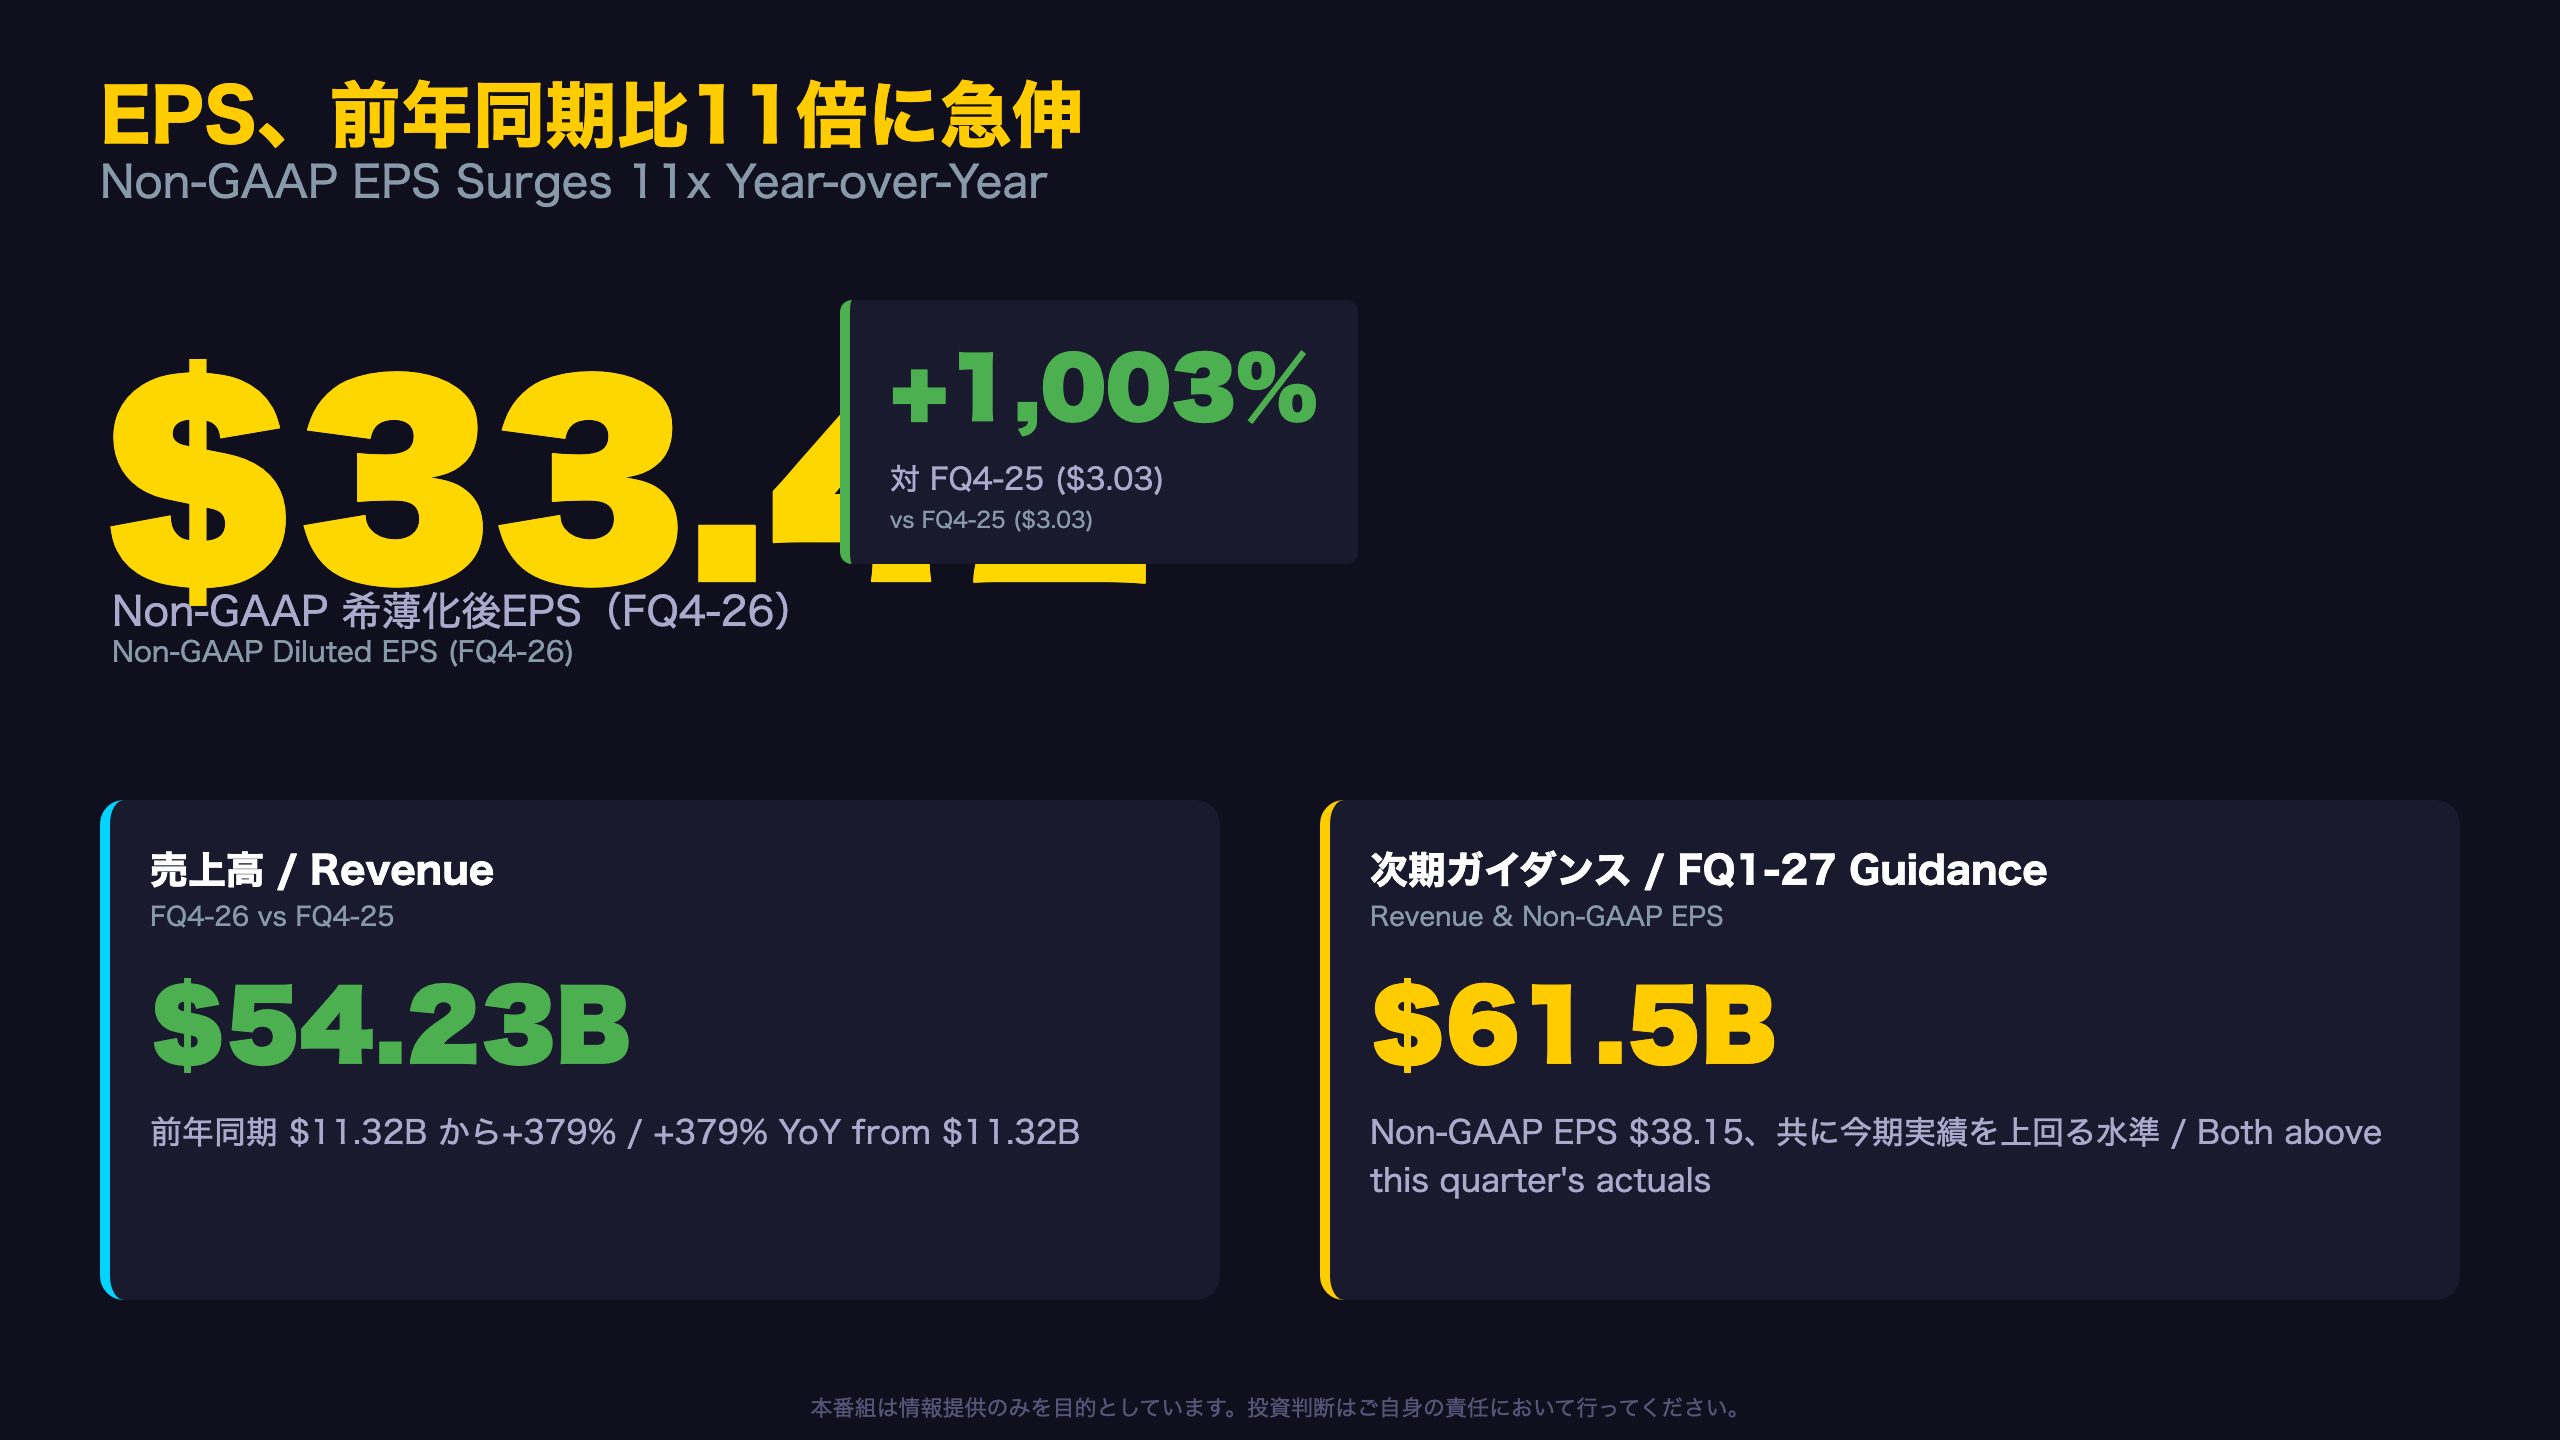
💰 Non-GAAP EPS hit $33.42, roughly 11x the $3.03 a year ago. Revenue reached $54.23B, up 379% YoY.
🚀 Core Data Center revenue grew over 10x YoY, confirming intense AI memory demand.
⚠️ Cloud Memory margins slipped slightly, showing uneven benefits across segments.
📈 Guidance for next quarter points to $61.5B revenue. Durability of AI demand is the key question ahead.
The Ultimate Summary:EPS前年比11倍の記録的決算
The Anatomy of a Record Quarter
Micron’s fiscal 2026 marks a dramatic inflection point. Full-year revenue reached $133.19 billion, up 256.5% from $37.38 billion in fiscal 2025, while GAAP net income surged nearly tenfold, from $8.54 billion to $84.97 billion.
Context for International Readers
Micron reports under U.S. GAAP and also discloses non-GAAP figures excluding items like stock-based compensation—standard practice among U.S. semiconductor companies. Notably, this press release does not disclose Wall Street consensus estimates, so readers cannot independently verify whether results beat or missed analyst forecasts.
Quarter-over-Quarter Acceleration
| Quarter | Revenue | Non-GAAP EPS |
|---|---|---|
| FQ4-25 | $11.32B | $3.03 |
| FQ3-26 | $41.46B | $25.11 |
| FQ4-26 | $54.23B | $33.42 |
Revenue grew 30.8% sequentially even after already surging the prior quarter—evidence this is a multi-quarter demand wave tied to AI server memory, not a one-off spike.
Market Implications
Micron’s non-GAAP gross margin of 87.0% this quarter signals extraordinarily tight memory supply-demand dynamics, comparable in scale to the AI infrastructure cycle benefiting peers like SK Hynix. CEO Sanjay Mehrotra framed AI as becoming “Super Intelligence,” underscoring management’s structural, not merely cyclical, view of demand.
セグメント概況:4事業部門すべてが増収も成長率に格差
Divergent Growth Across Business Units
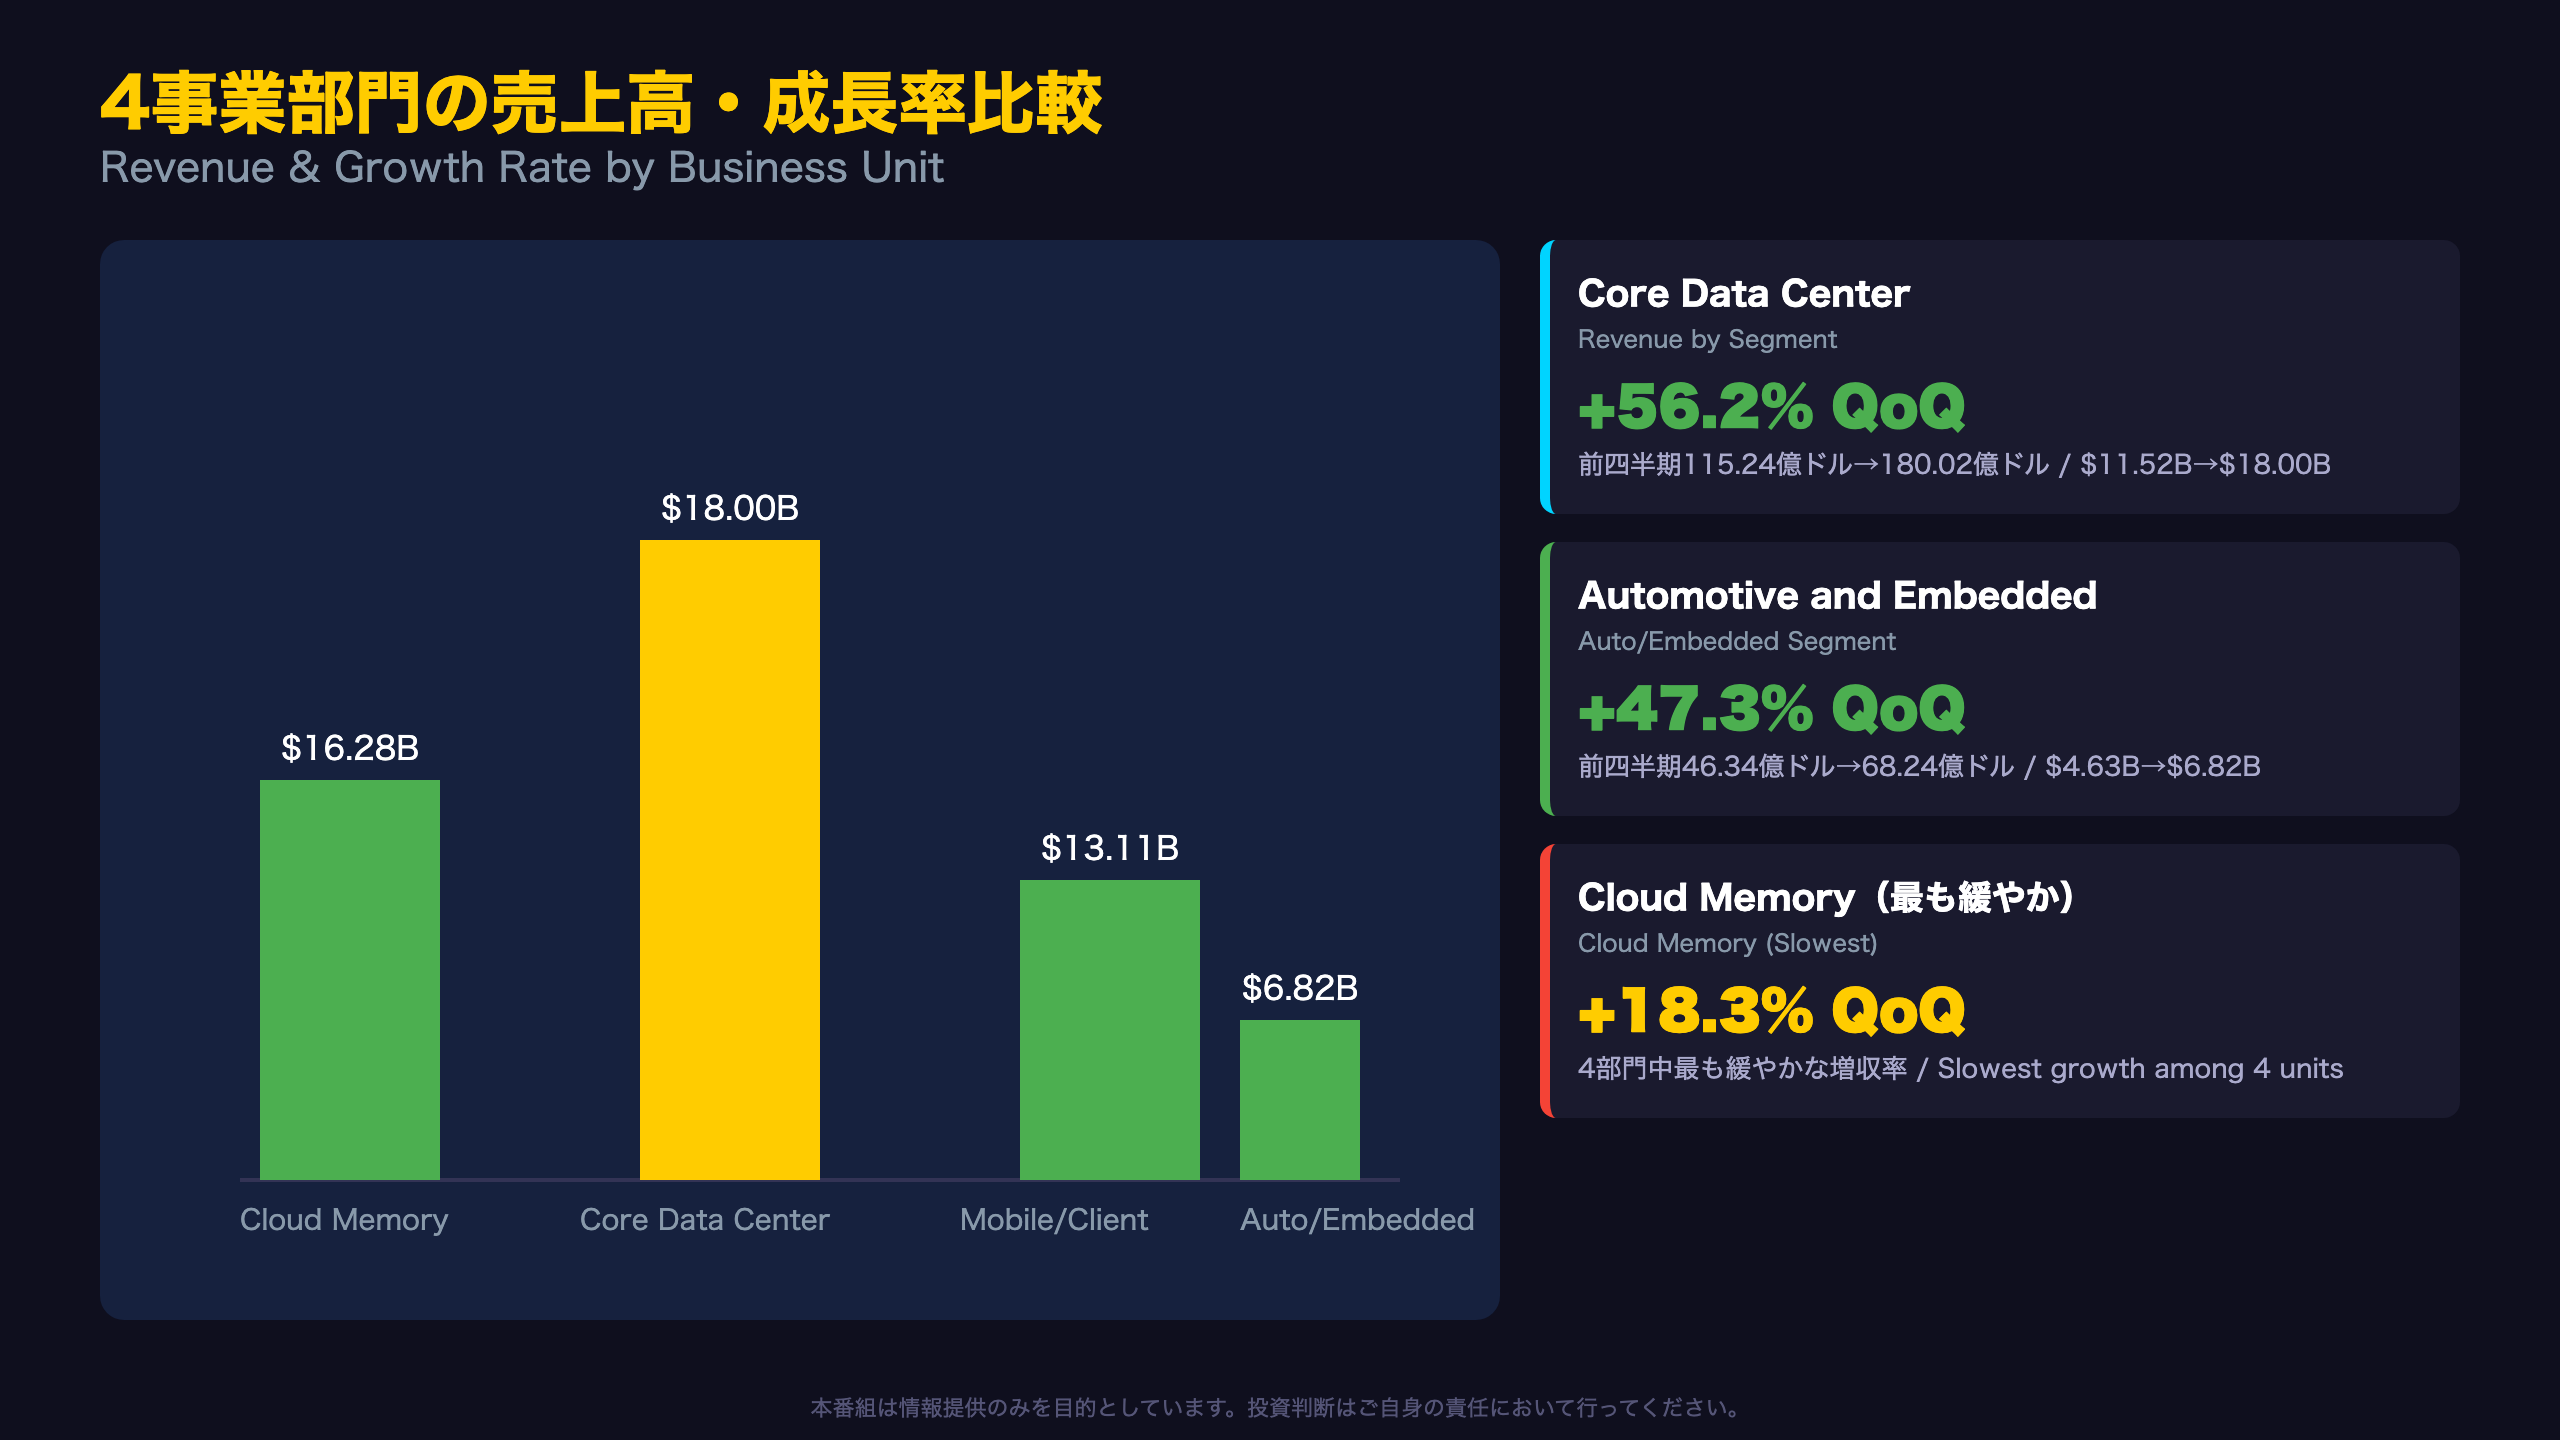
All four of Micron’s reporting segments—Cloud Memory, Core Data Center, Mobile and Client, and Automotive and Embedded—posted sequential and year-over-year revenue growth, but the pace varies sharply.
Sequential Growth Ranking
- Core Data Center: +56.2% ($11.52B → $18.00B)
- Automotive and Embedded: +47.3% ($4.63B → $6.82B)
- Cloud Memory: +18.3% ($13.77B → $16.28B)
- Mobile and Client: +13.8% ($11.52B → $13.11B)
Why This Matters for International Investors
Unlike Samsung or SK Hynix, which report memory revenue as a blended DRAM/NAND figure, Micron breaks out data-center-specific demand separately. Core Data Center—most directly tied to AI server buildouts (HBM, high-capacity DIMMs)—posted 1,041.6% year-over-year growth from just $1.58B a year ago. Automotive and Embedded also grew 376.0% YoY, suggesting AI-adjacent demand is broadening beyond hyperscale data centers.
Market Implication
This segment breakdown offers independent confirmation that AI memory demand is running through multiple channels, not solely hyperscaler capex. The next slide examines whether this growth divergence shows up in margin structure.
深掘り:Core Data Centerのマージン急拡大とCloud Memoryの陰り
What Margin Divergence Reveals About AI Demand Quality
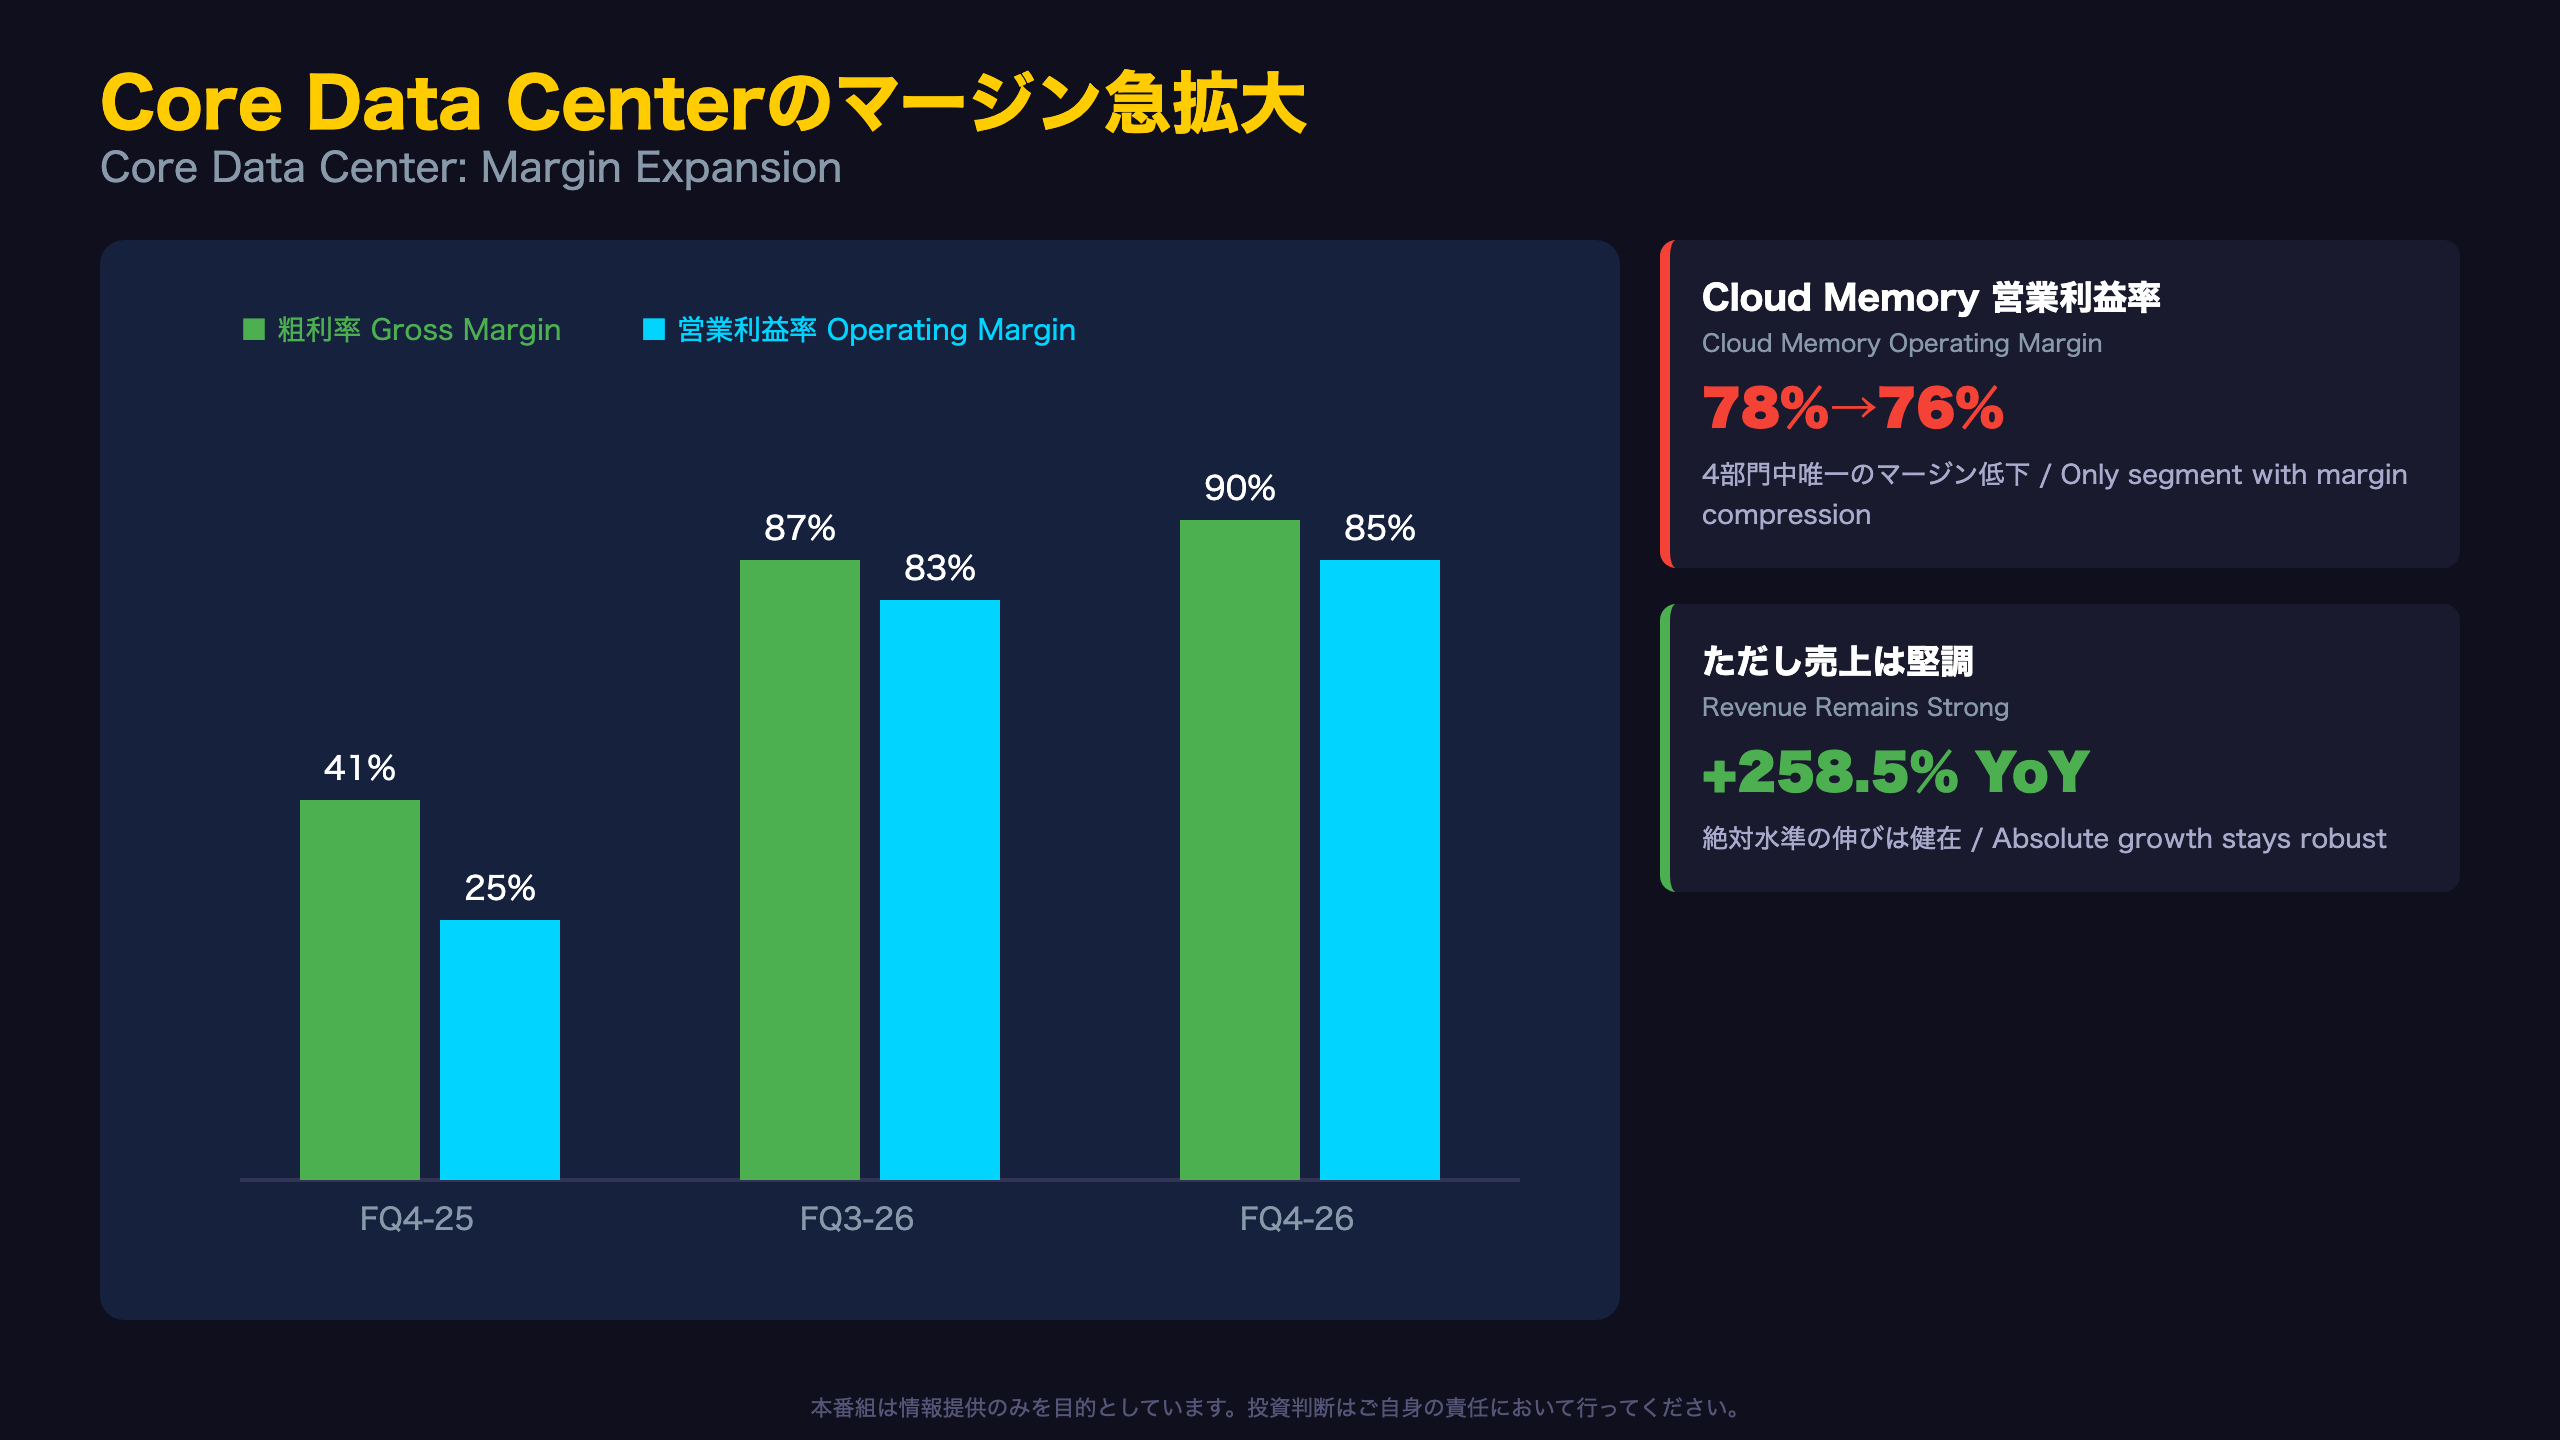
Core Data Center’s 90% gross margin and 85% operating margin this quarter both exceed the company-wide non-GAAP gross margin of 87.0%.
Three-Quarter Margin Trajectory
| Quarter | Gross Margin | Operating Margin |
|---|---|---|
| FQ4-25 | 41% | 25% |
| FQ3-26 | 87% | 83% |
| FQ4-26 | 90% | 85% |
Gross margin expanded 49 percentage points and operating margin 60 points in just two quarters—a magnitude rarely seen among U.S. semiconductor peers, pointing to a structural supply-demand imbalance rather than routine cyclical pricing.
The Cloud Memory Counterpoint
Cloud Memory’s operating margin slipped from 78% to 76%—the only segment to see margin compression this quarter. A bearish read: Cloud Memory may be lagging the AI pricing wave enjoyed by Core Data Center. A more balanced read: Cloud Memory revenue still grew 18.3% sequentially and 258.5% year-over-year, comparable to peers, suggesting this is a relative pricing-power gap rather than genuine weakness. The filing does not disclose the specific product mix or pricing dynamics behind the divergence.
深掘り:キャッシュフローの質と一時費用の中身
Cash Flow Quality and One-Time Cost Items
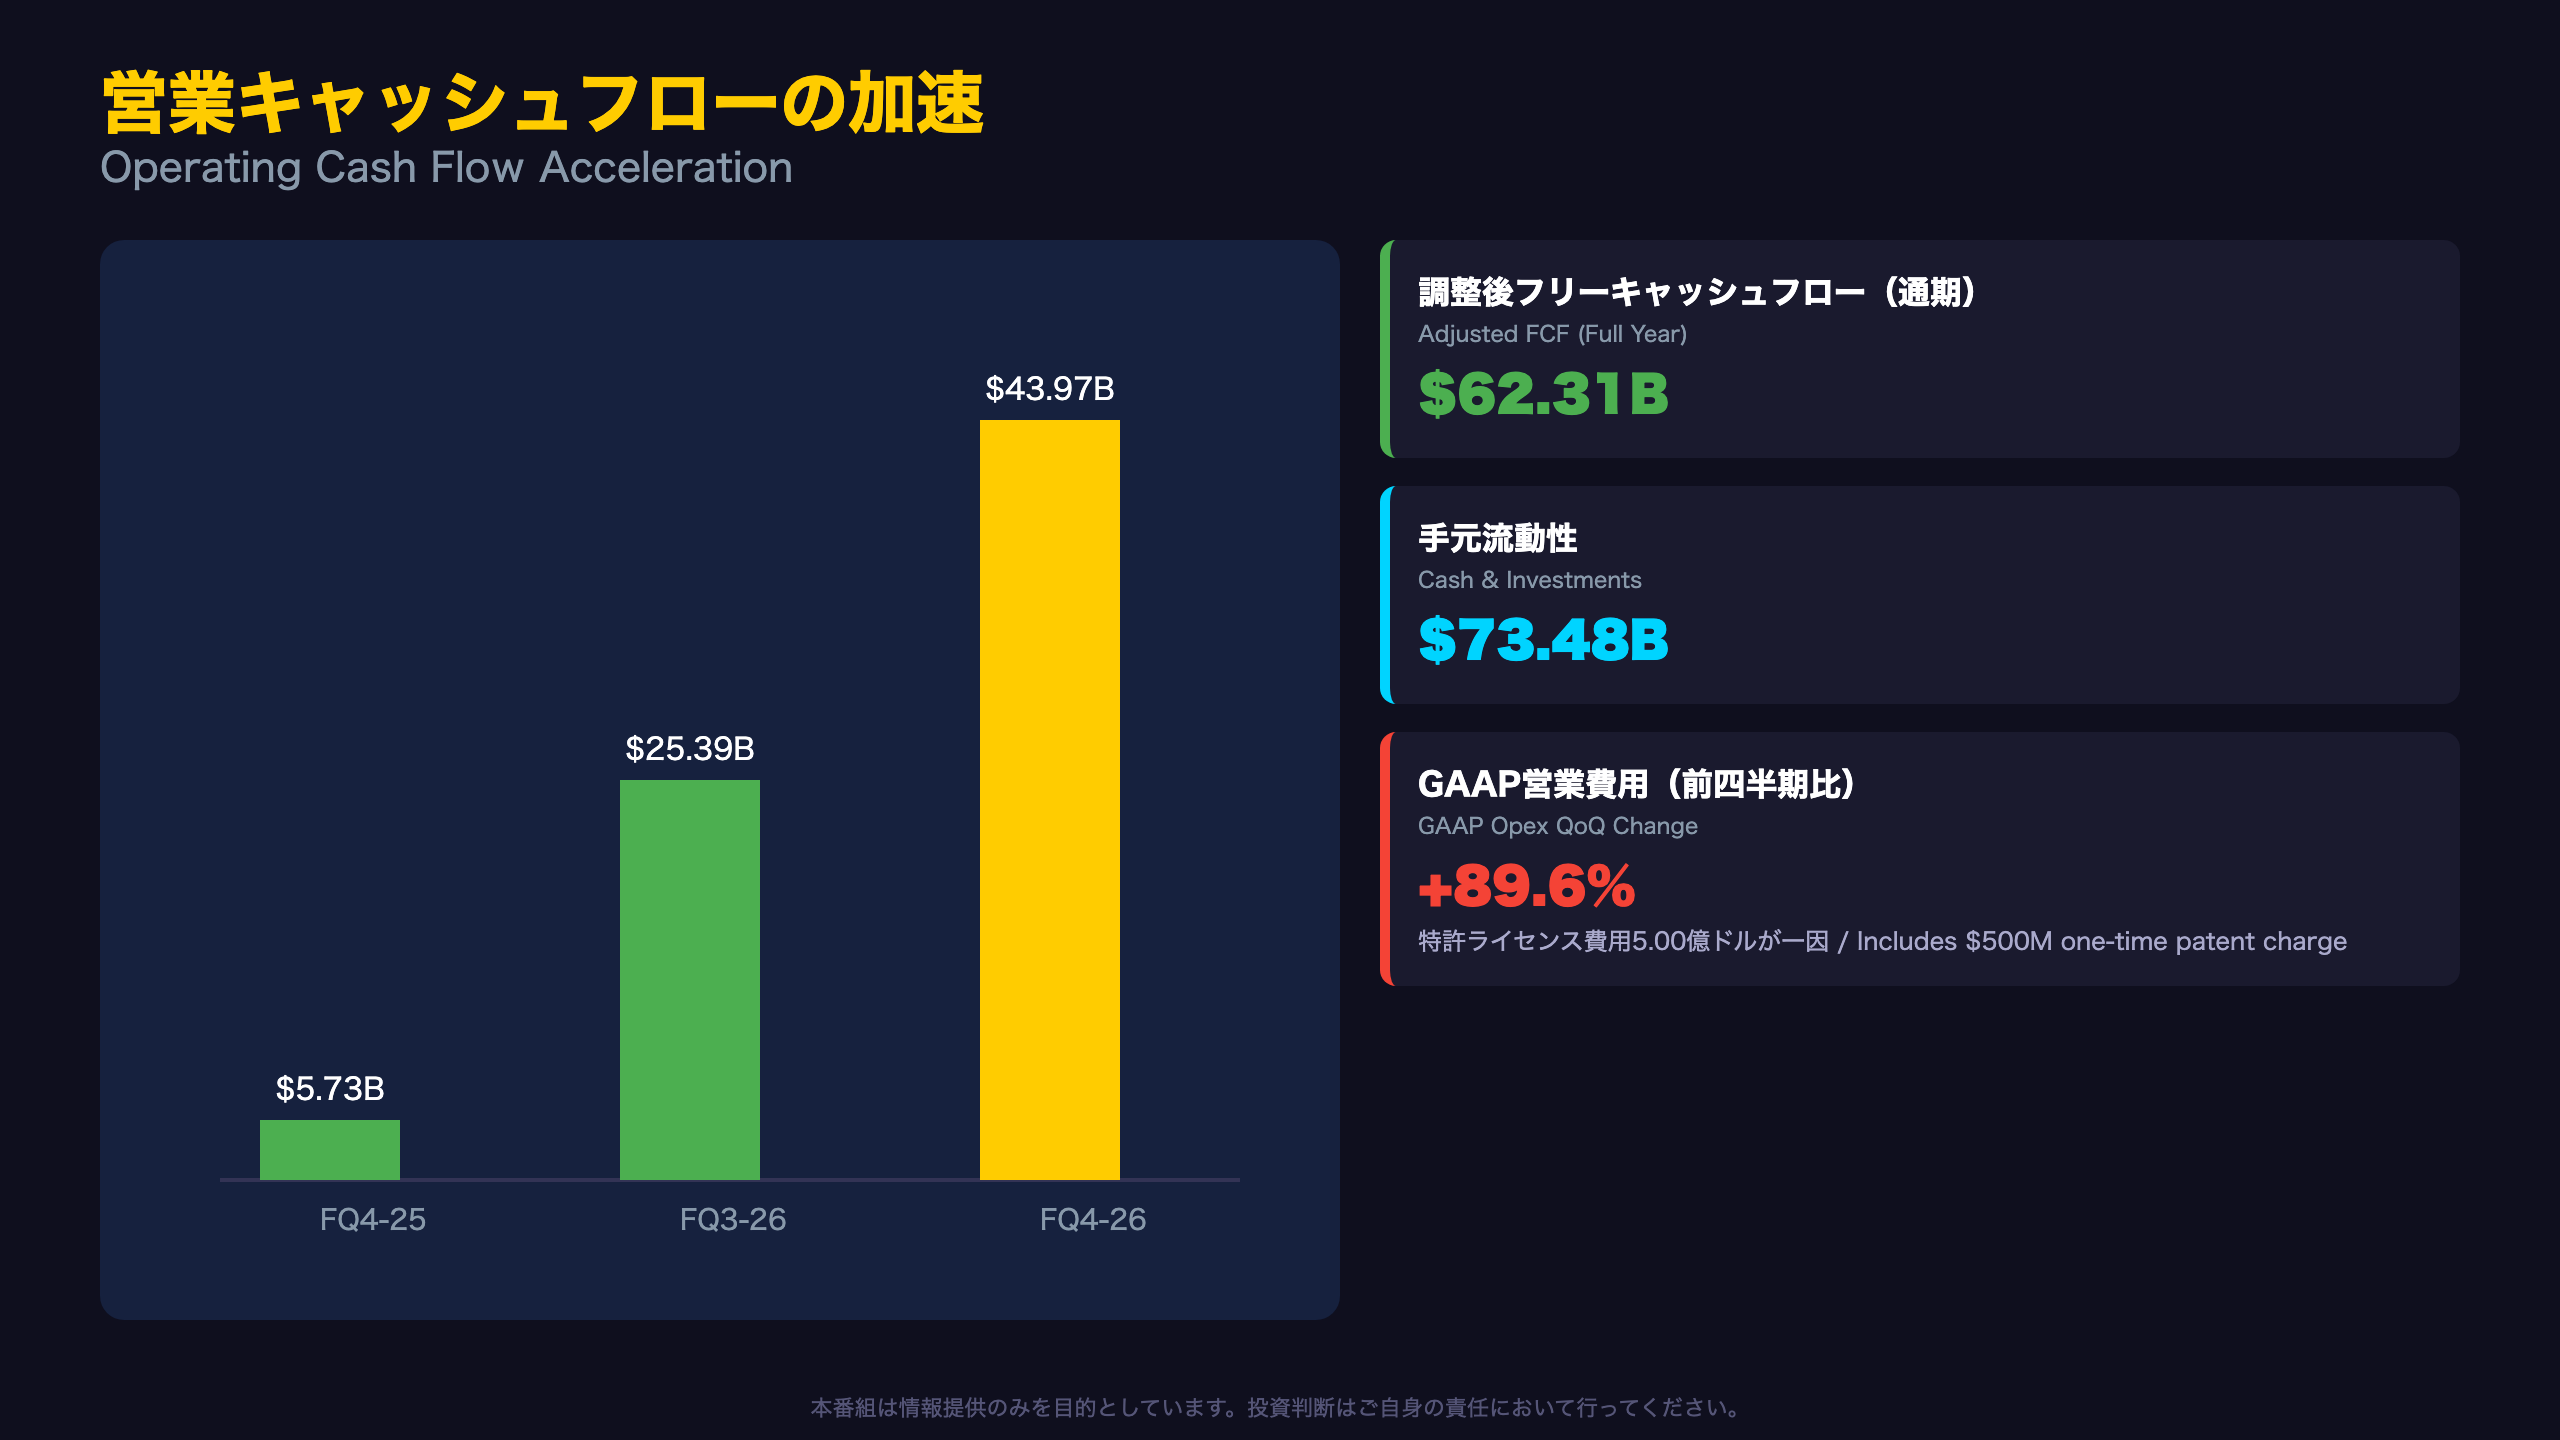
Full-year operating cash flow of $89.68 billion exceeded GAAP net income of $84.97 billion, indicating high-quality, cash-backed earnings rather than purely accounting-driven profit growth.
Breaking Down the Opex Surge
GAAP operating expenses rose 89.6% sequentially to $3.30 billion. Disclosed contributing factors:
– One-time patent license charge: $500 million (excluded from non-GAAP)
– R&D expense: $1.91 billion, up 45.4% sequentially
– SG&A: $859 million, more than doubling from $407 million (+111%)
Even stripping out the patent charge, non-GAAP opex still rose 69.2% sequentially to $2.57 billion, suggesting elevated R&D and SG&A investment beyond the one-off item.
The Customer Contract Liability Spike
Noncurrent customer contract liabilities jumped from $568 million to $12.90 billion quarter-over-quarter. This likely reflects prepayments tied to the “Strategic Customer Agreements” CEO Sanjay Mehrotra referenced, which he said “provide added confidence in the durability of Micron’s financial performance.” For U.S. investors, this resembles a build-up of deferred revenue or customer deposits—a signal of long-term supply commitments, though the filing does not disclose specific contract terms.
フォワードルック:次期ガイダンスと次の焦点
Reading the Guidance and What Comes Next
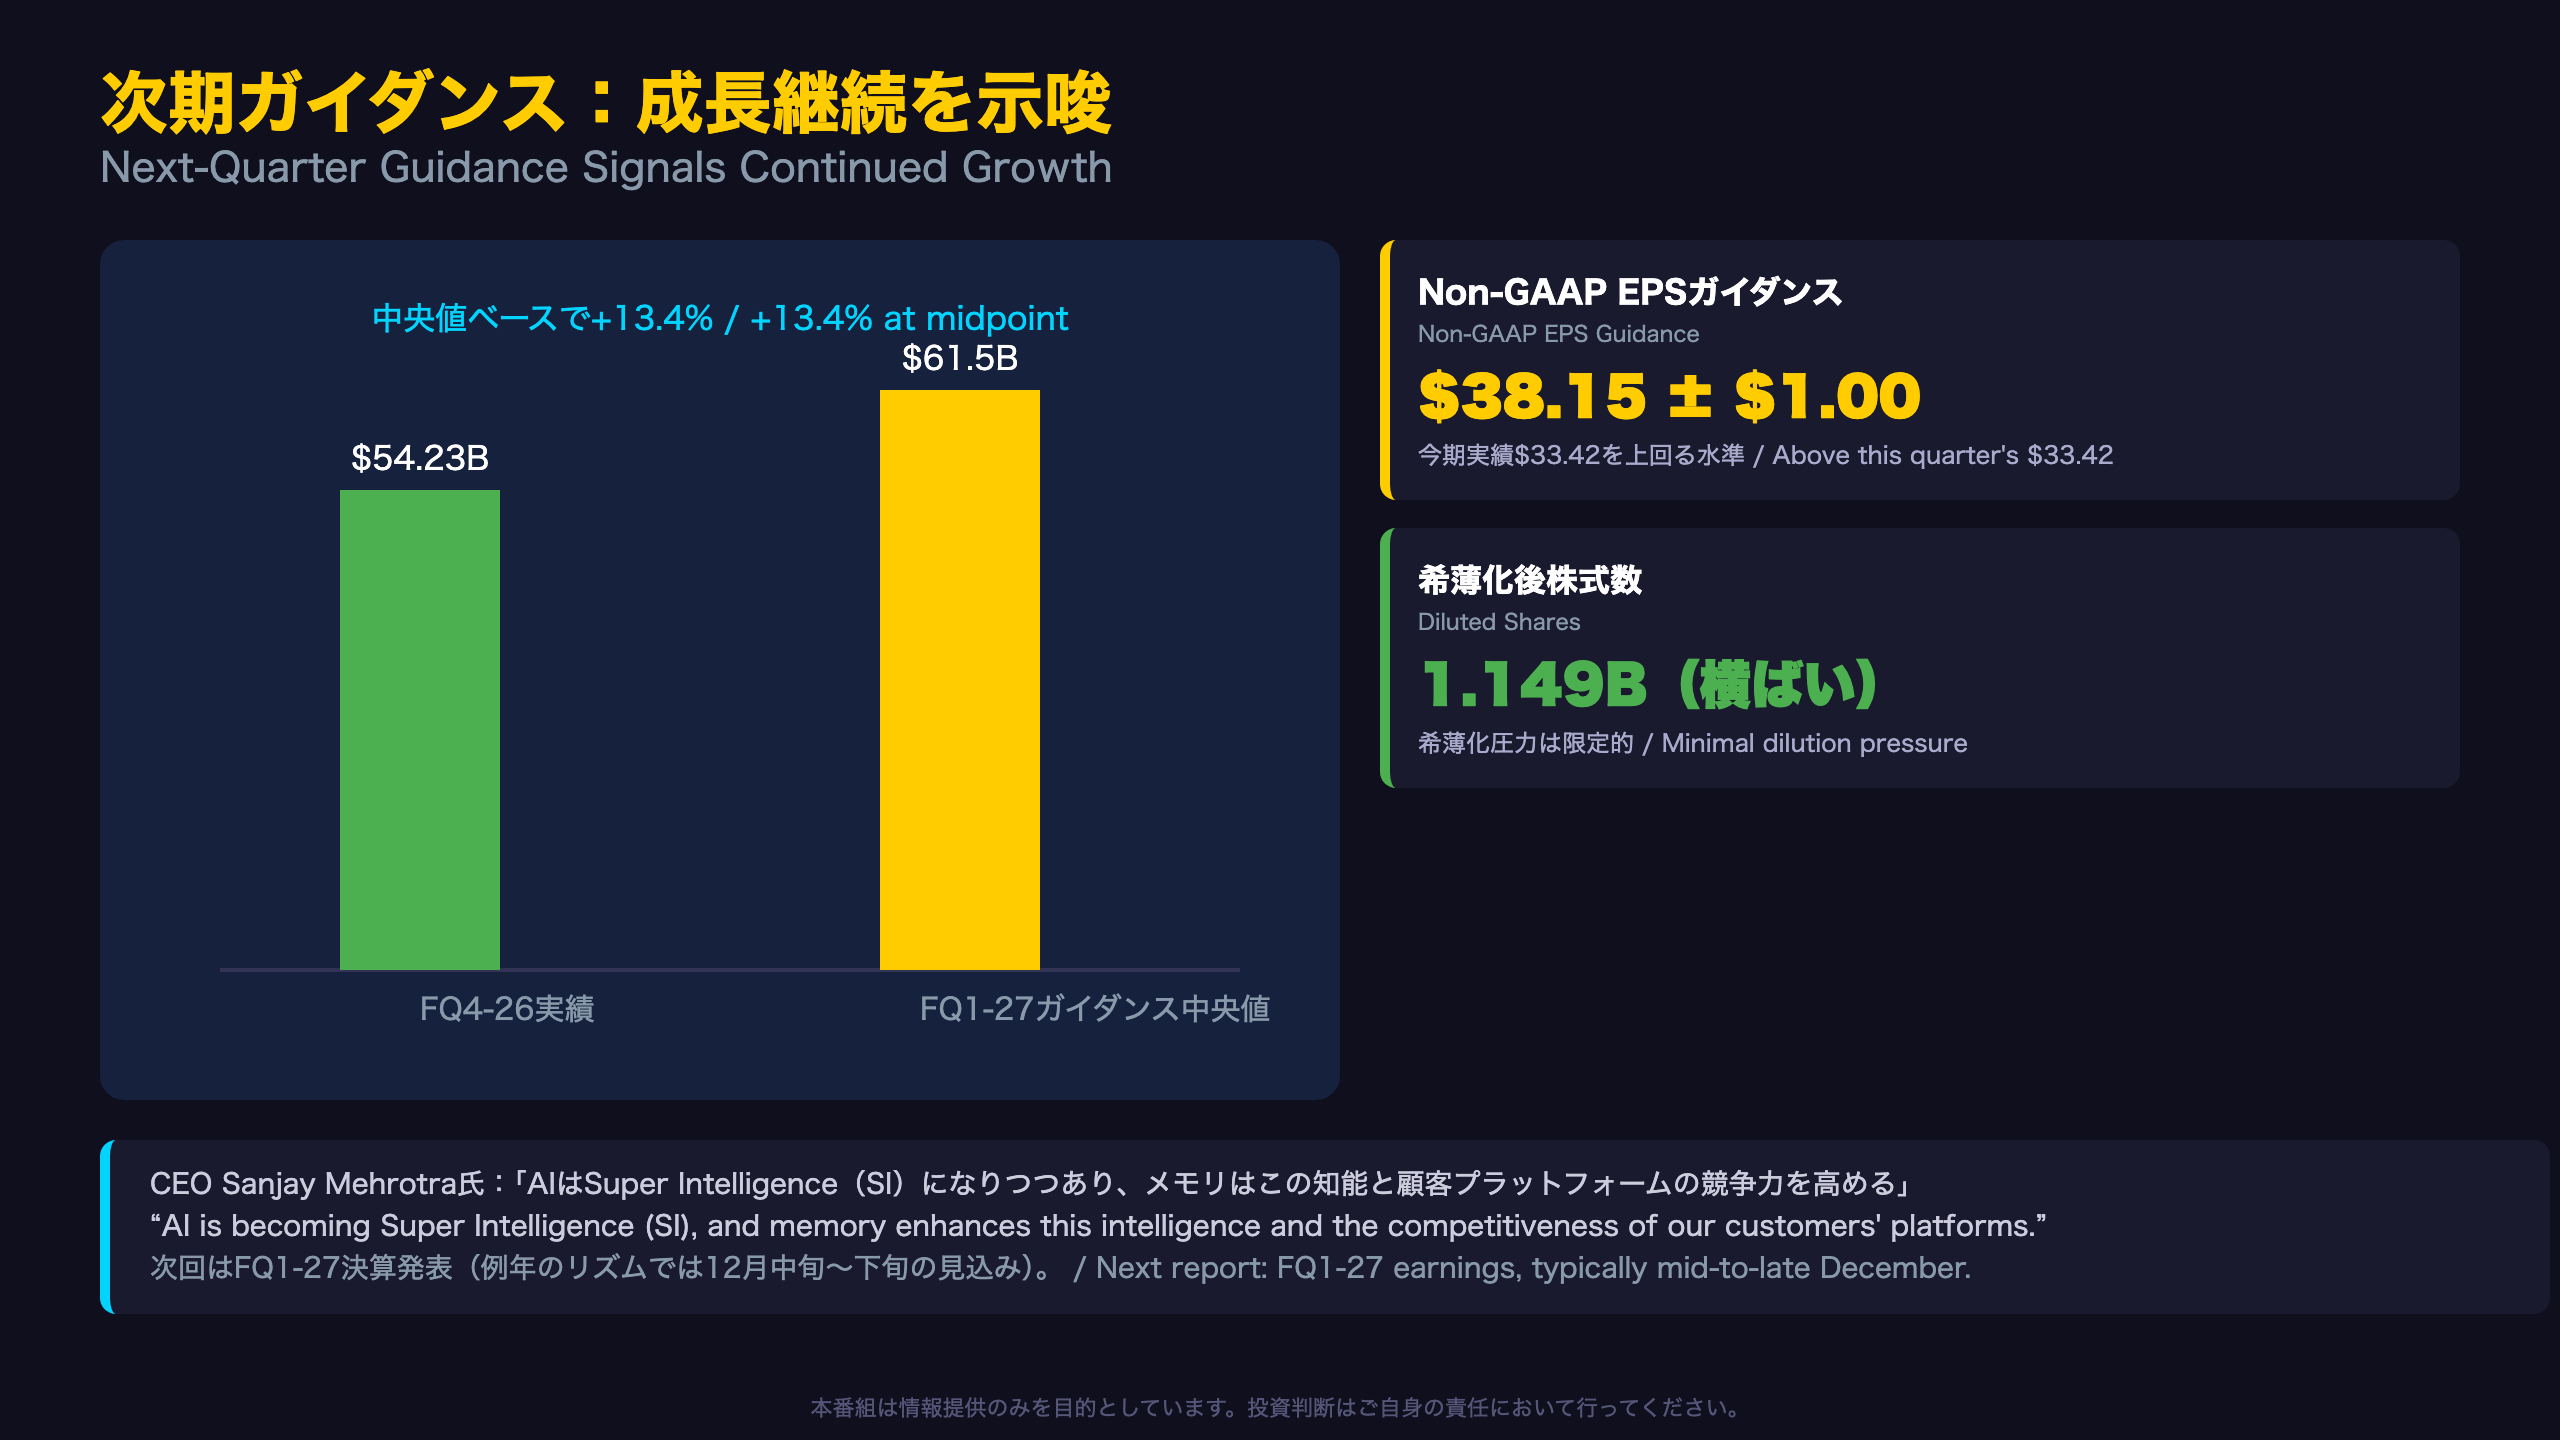
Non-GAAP EPS guidance of $38.15 ± $1.00 implies even the low end ($37.15) would exceed this quarter’s $33.42 actual result.
Inside the GAAP-to-Non-GAAP Bridge
The $0.31 total EPS adjustment breaks down as:
– Stock-based comp (COGS): $174M
– Stock-based comp (R&D): $166M
– Stock-based comp (SG&A): $87M
– Tax effects: -$65M
The adjustments are almost entirely stock-based compensation—a standard, well-understood non-GAAP practice among U.S. tech companies, not a red flag of earnings manipulation.
Bull Case vs. Bear Case
Bull case: Revenue guidance midpoint of $61.5 billion implies 13.4% sequential growth, showing no deceleration signal.
Bear case: The guidance range (±$1.5B on revenue, ±$1.00 on EPS) is relatively wide, reflecting real uncertainty around AI memory demand durability.
What to Watch Next
Micron’s fiscal Q1 2027 results are typically released in mid-to-late December based on its fiscal calendar. Key questions: can the company hit the $61.5 billion revenue guide, and does Core Data Center’s growth rate hold near +56.2% or decelerate?
Disclaimer: This article is for informational purposes only. All investment decisions are made solely at your own risk.