This article was automatically generated by the NFC Market Live AI analysis system. (Updated: 2026-10-21 05:20 JST)
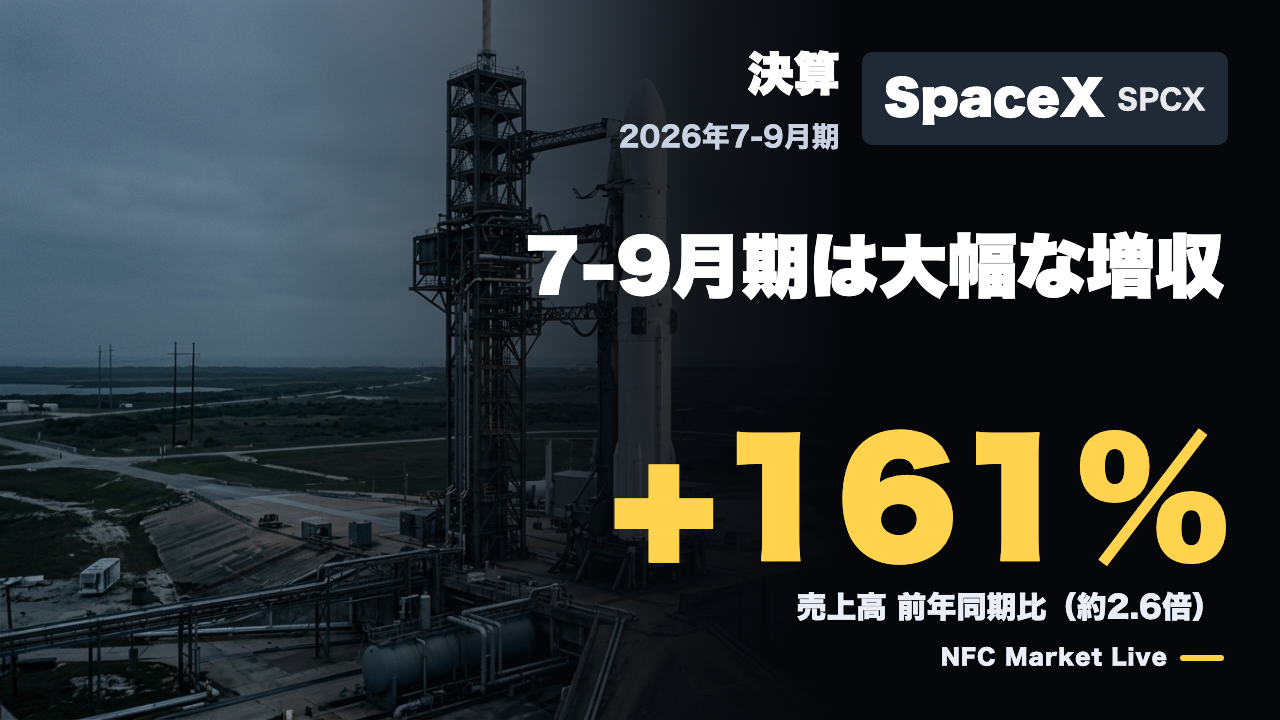
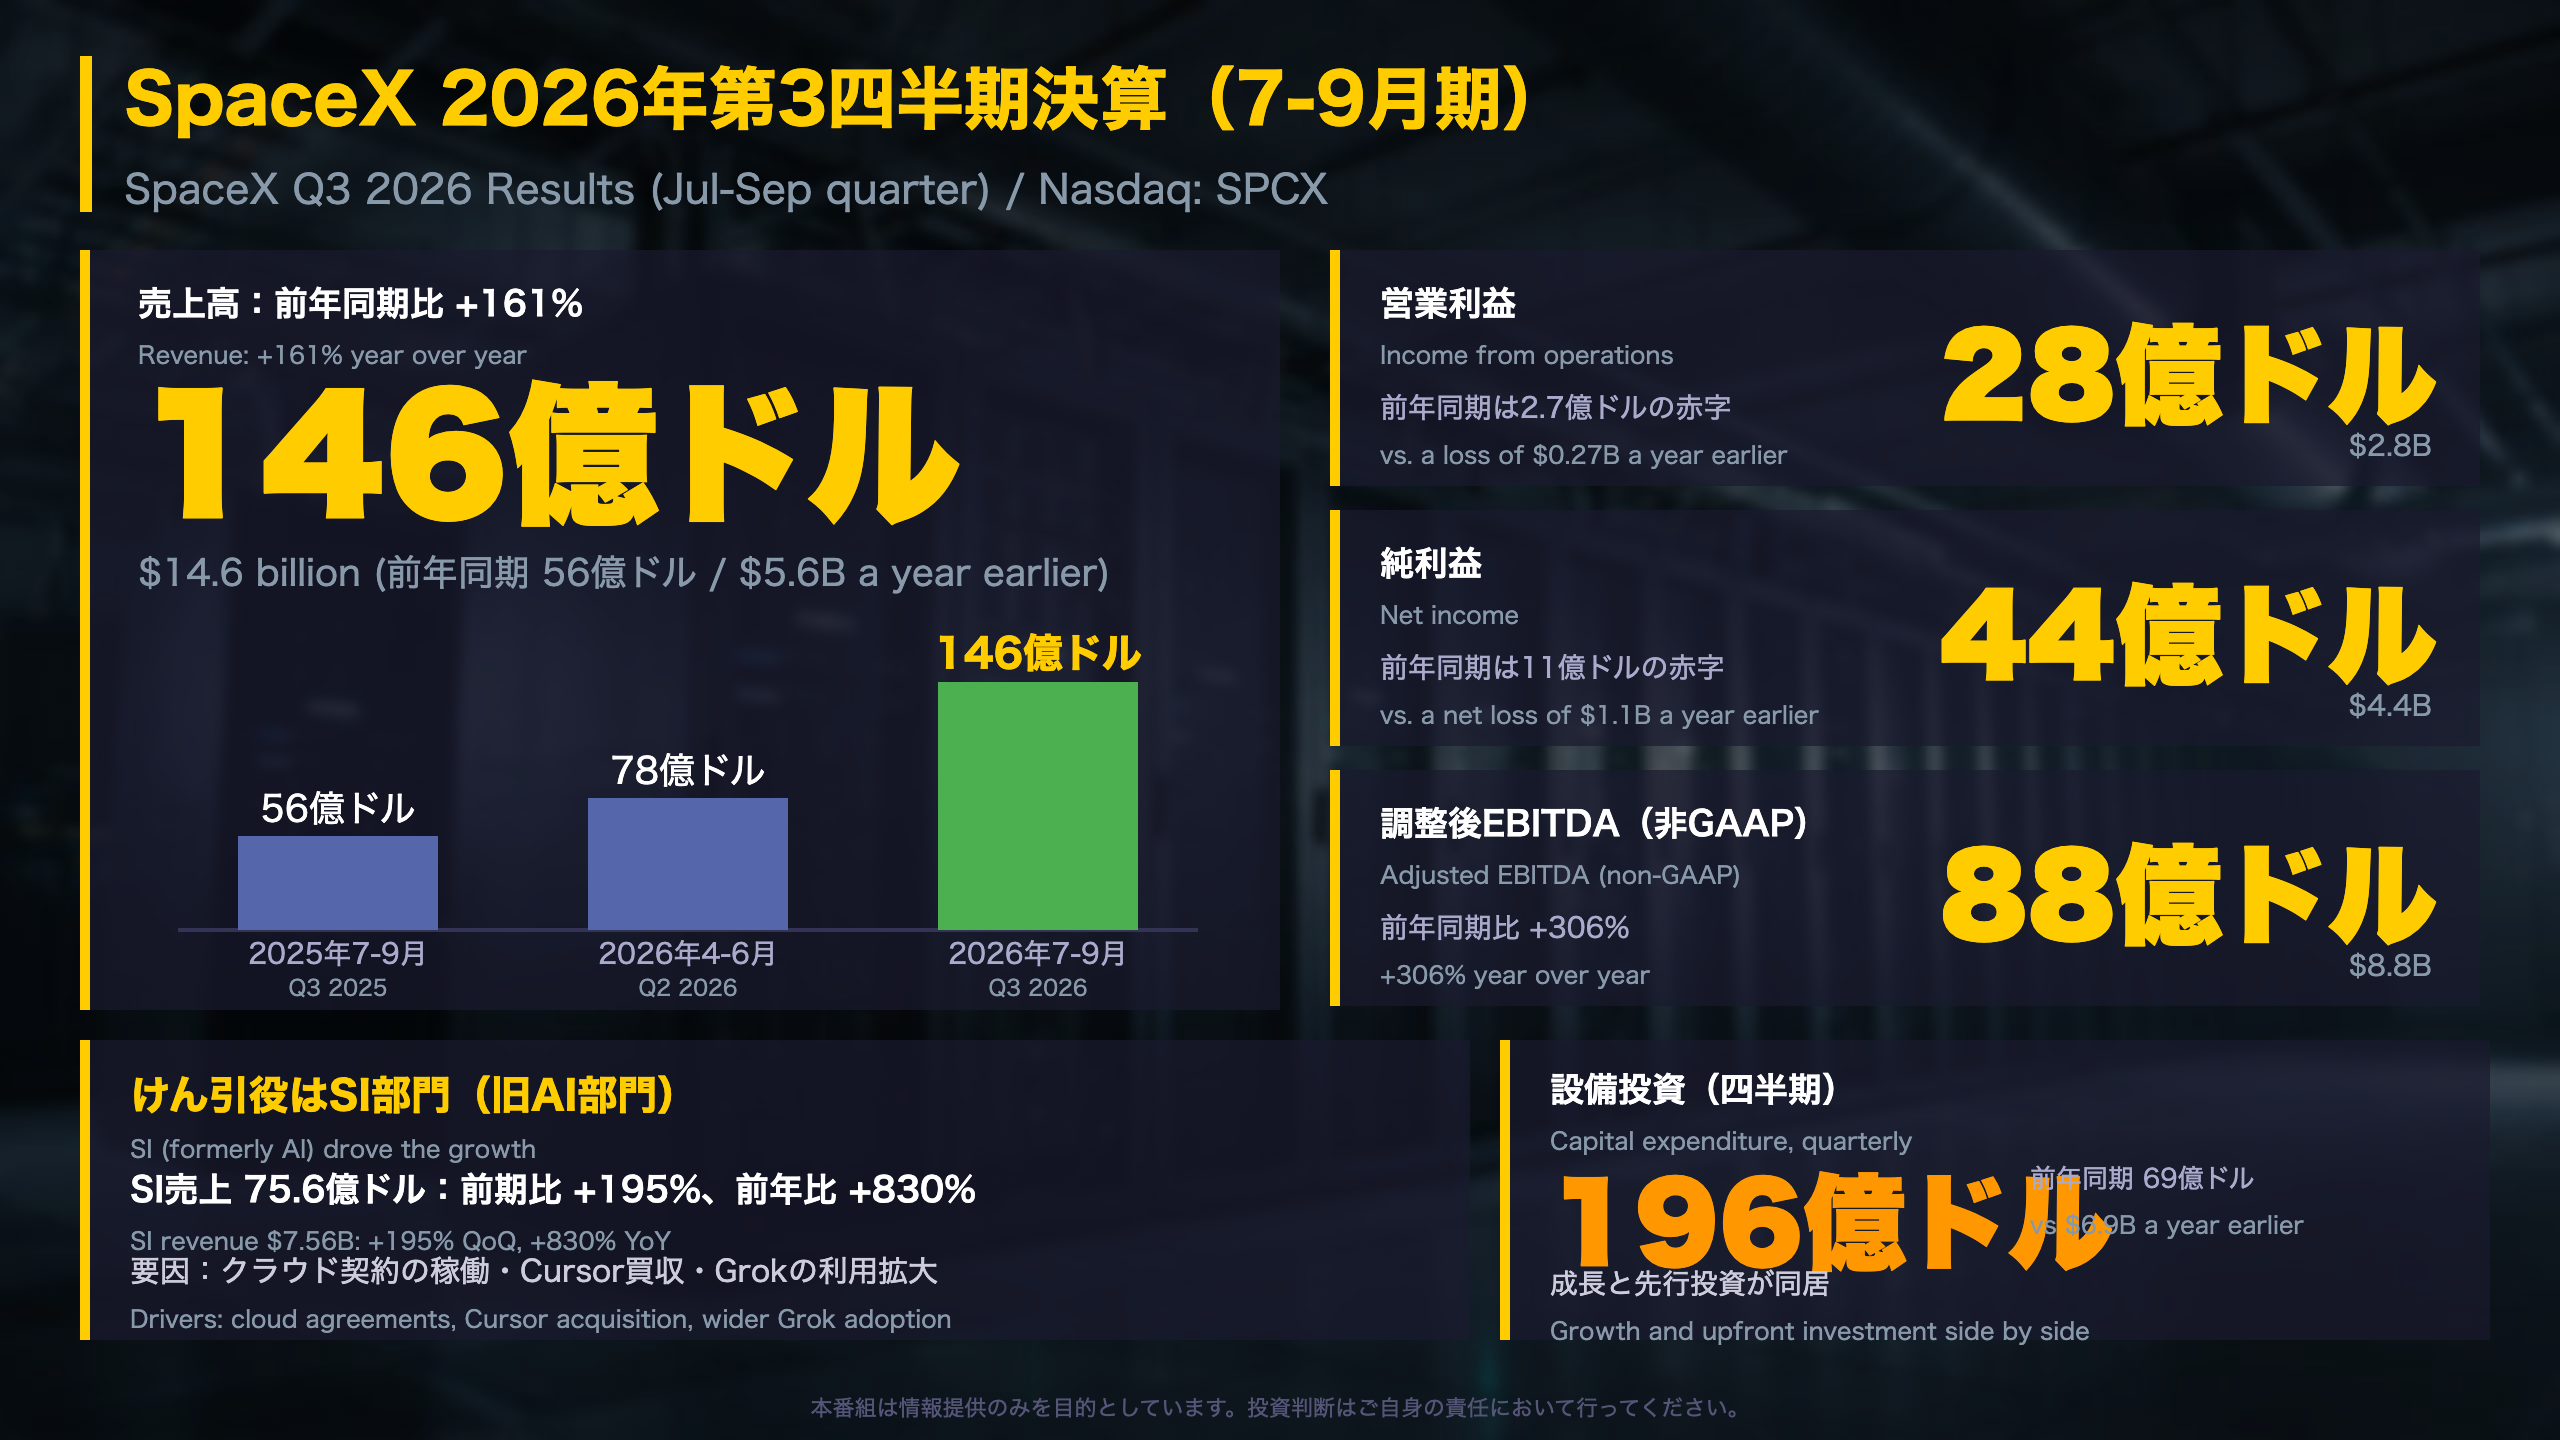
📊 SpaceX reported Q3 2026 results: revenue of $14.6B (+161% YoY), operating income of $2.8B and net income of $4.4B.
📈 The SI (formerly AI) segment led growth with $7.56B in revenue, while Connectivity operating income roughly doubled to $2.37B.
⚠️ On the other side, quarterly capex reached $19.6B, and net income includes interest income, other income and a tax benefit.
💡 We walk through the SI surge, who earns vs. who spends, and what is inside the profit, using only the release’s figures.
※ Analyst consensus and the next earnings date are not stated in the release.
SpaceX 2026年第3四半期決算:全体像
What SpaceX Reported
SpaceX (Nasdaq: SPCX) published its third-quarter 2026 results as an SEC Form 8-K, Exhibit 99.1, on October 20, 2026. Revenue was $14.6 billion (vs. $5.6 billion a year earlier), income from operations $2.8 billion, net income $4.4 billion and Adjusted EBITDA $8.8 billion. Adjusted EBITDA is a non-GAAP measure that adds back items such as depreciation and share-based compensation, so it should be read alongside the GAAP figures.
Why the segment structure matters
The company reports three segments: Space (launch services), Connectivity (Starlink) and SI, short for Super Intelligence, which was previously reported as AI. SI generated $7.56 billion of the $14.58 billion in Q3 revenue, about half of the total, versus roughly 15% a year earlier ($0.81 billion of $5.58 billion). The mix of the business has therefore shifted quickly from a launch-and-broadband company toward one that also sells AI models and compute infrastructure.
Reading the release
This document contains no analyst consensus, so a beat or miss cannot be judged from it alone. What it does offer is a clean year-over-year and quarter-over-quarter comparison across all three segments.
Two readings
- Constructive: revenue nearly doubled from the prior quarter ($7.8 billion), and two of the three segments posted operating profits.
- Cautious: quarterly capital expenditure of $19.6 billion is heavy, and net income includes non-operating items.
What to watch next
The release does not state the next earnings date. Management held a live webcast at 4:30 pm ET on October 20. The 800 MHz spectrum purchase is expected to close in the first half of 2027, subject to regulatory approval.
要点1:SI部門の急拡大
Inside the SI Segment
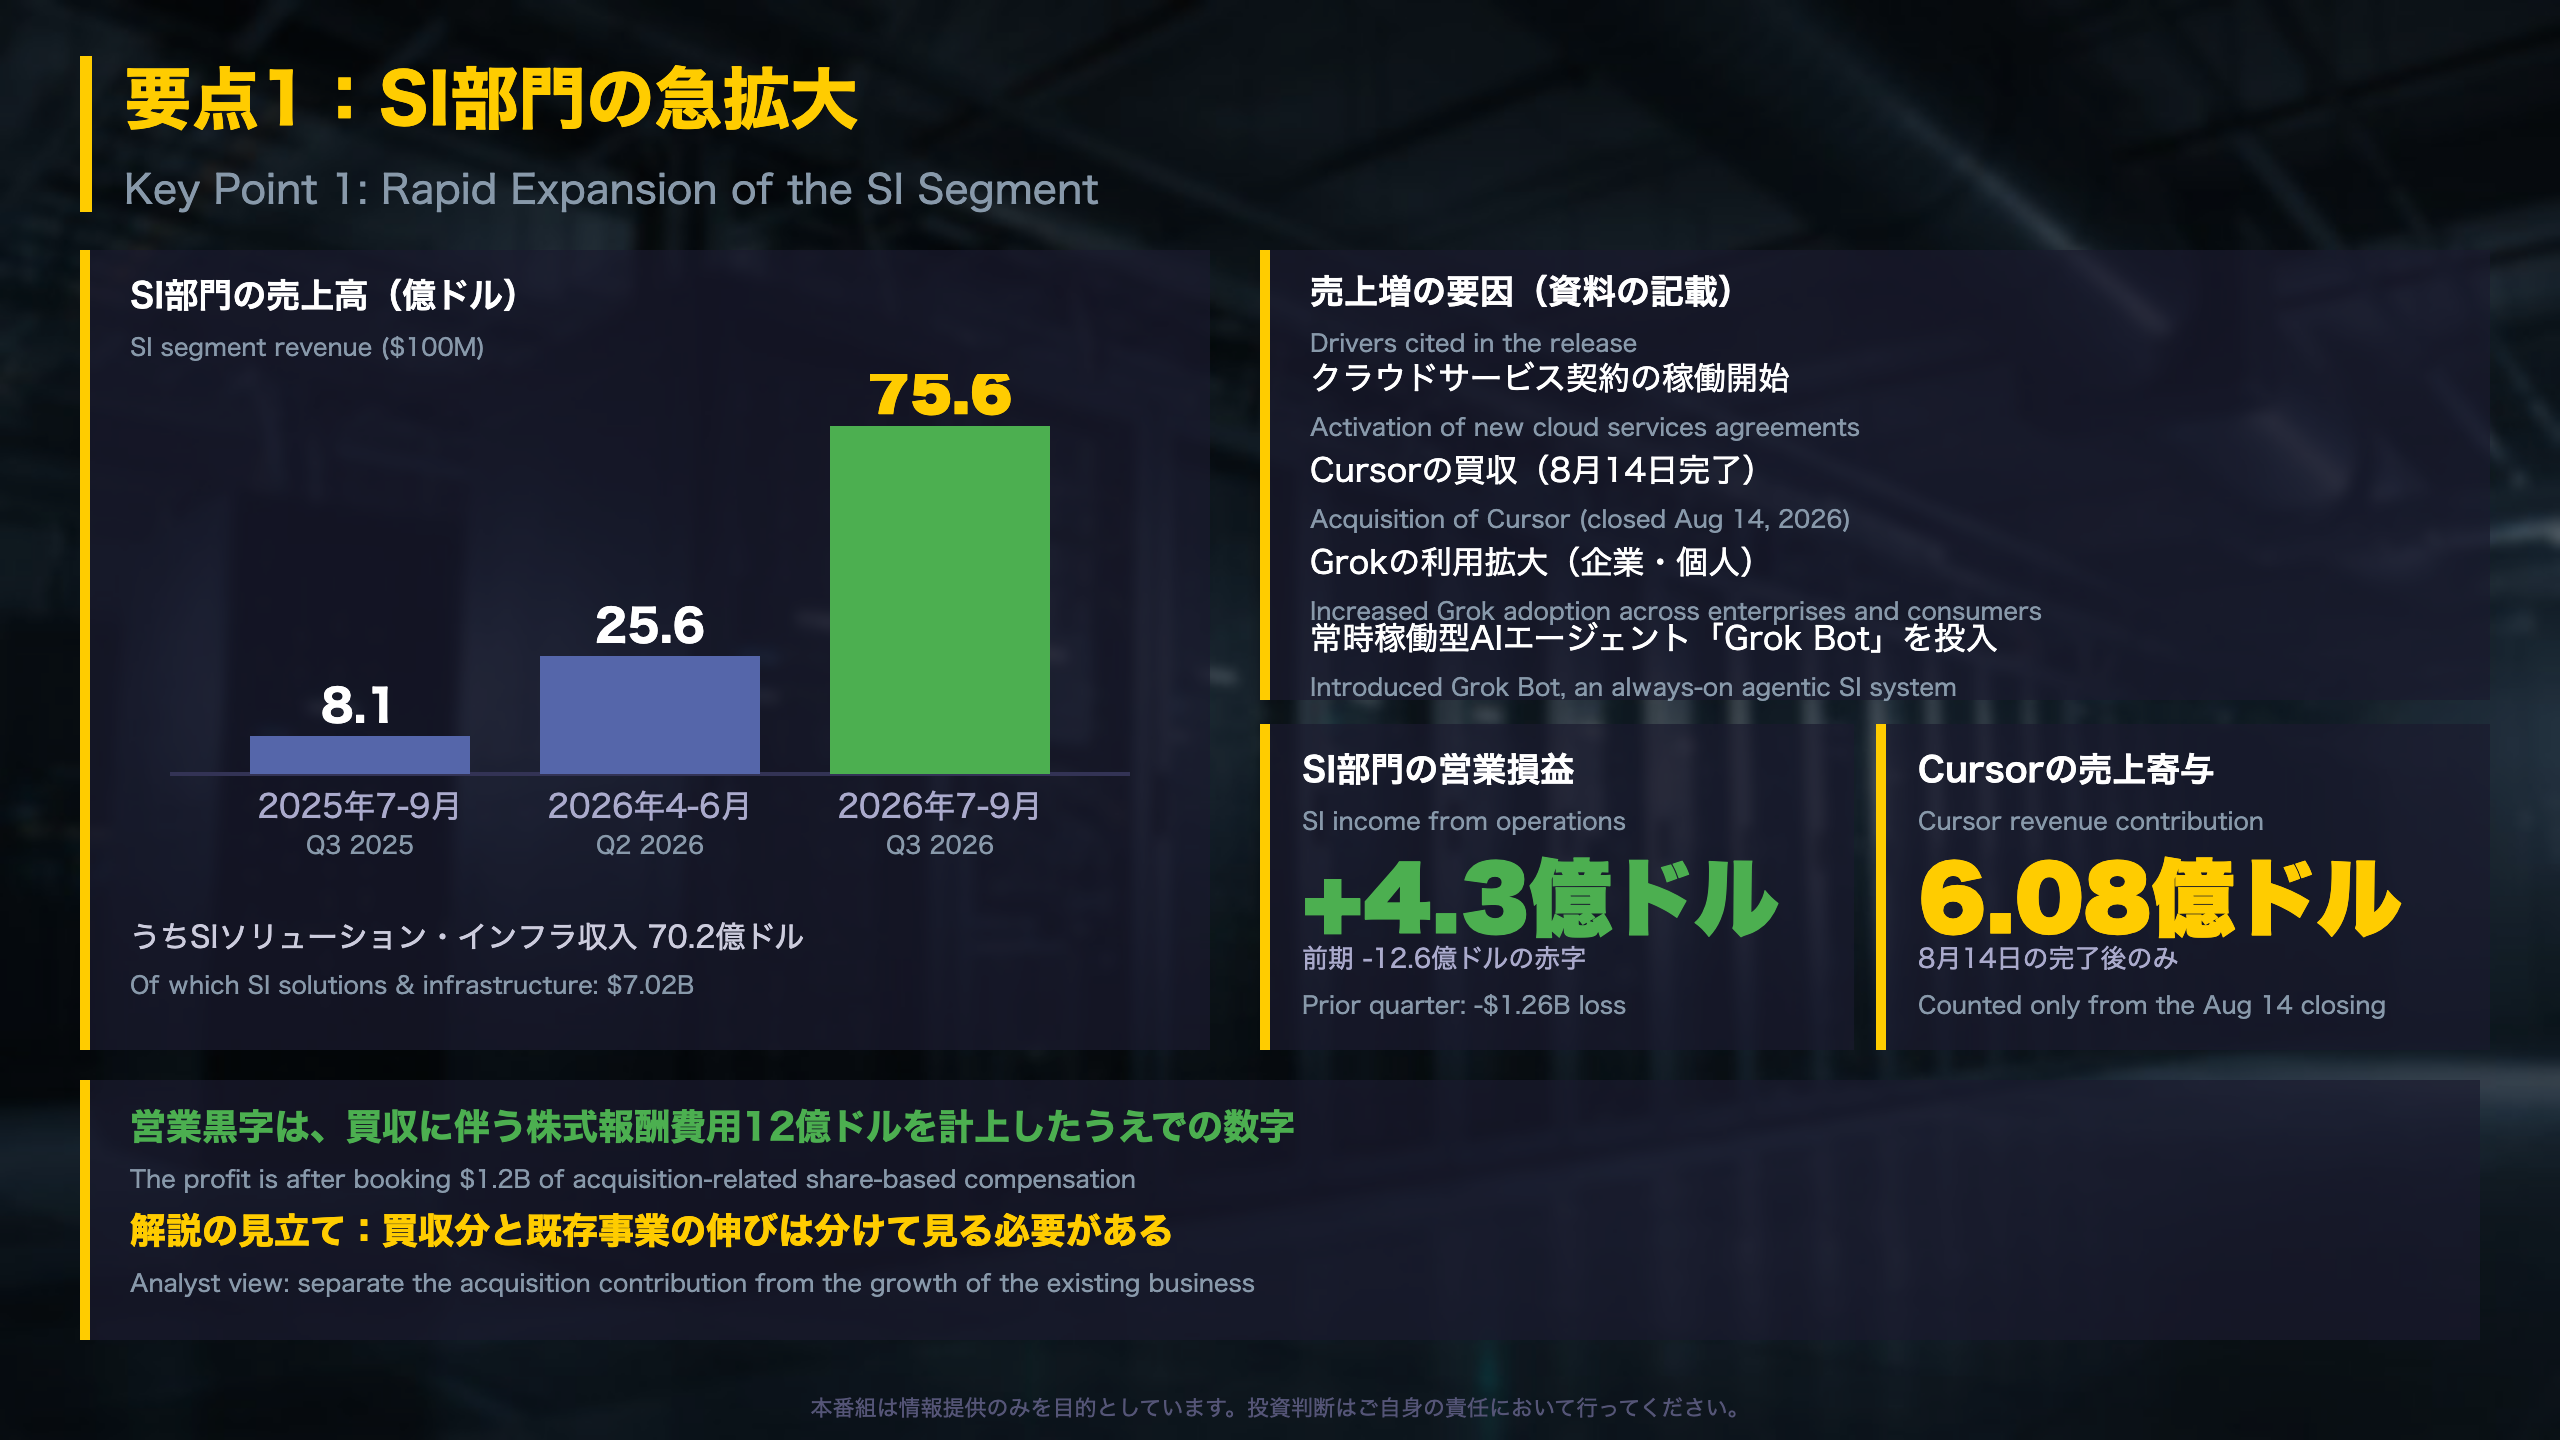
SI (Super Intelligence) is the segment SpaceX previously reported as AI. In Q3 it earned $7.56 billion, up 195% from the prior quarter and 830% from a year earlier, according to the release.
Revenue mix
- SI solutions & infrastructure: $7.02 billion (vs. $2.19 billion in Q2 and $0.36 billion a year ago).
- Advertising: $0.54 billion (vs. $0.37 billion in Q2 and $0.45 billion a year ago).
Growth is therefore concentrated in selling compute and AI solutions rather than in advertising.
Profit: GAAP vs. adjusted
SI posted operating income of $0.43 billion, after a loss of $1.26 billion in Q2. Adjusted EBITDA was $4.95 billion, but that figure adds back $2.47 billion of depreciation and $2.04 billion of share-based compensation ($0.82 billion regular plus $1.22 billion tied to the Cursor deal). The gap between the two measures is large, which is common for capital-intensive AI infrastructure businesses.
The Cursor deal
SpaceX closed the Cursor acquisition on August 14, 2026, at an implied equity value of $60 billion. GAAP purchase consideration was $42.5 billion, and $23.4 billion of equity awards relate to post-acquisition service. Cursor contributed $608 million of revenue from closing to September 30, so Q3 includes only about six weeks of its sales.
Independent view
This structure is closer to a cloud and AI platform provider than to a traditional aerospace segment. Compute capacity (‘nameplate compute’) rose to 1.7 GW from 1.4 GW in Q2 and 0.6 GW a year earlier.
Two readings
- Constructive: SI moved to an operating profit even after a large acquisition-related expense.
- Cautious: part of the growth is acquired, and organic growth cannot be isolated from this release. The next earnings date is not stated.
要点2:稼ぎ手と投資の使い手
Who Earns, Who Spends
Connectivity: the profit engine
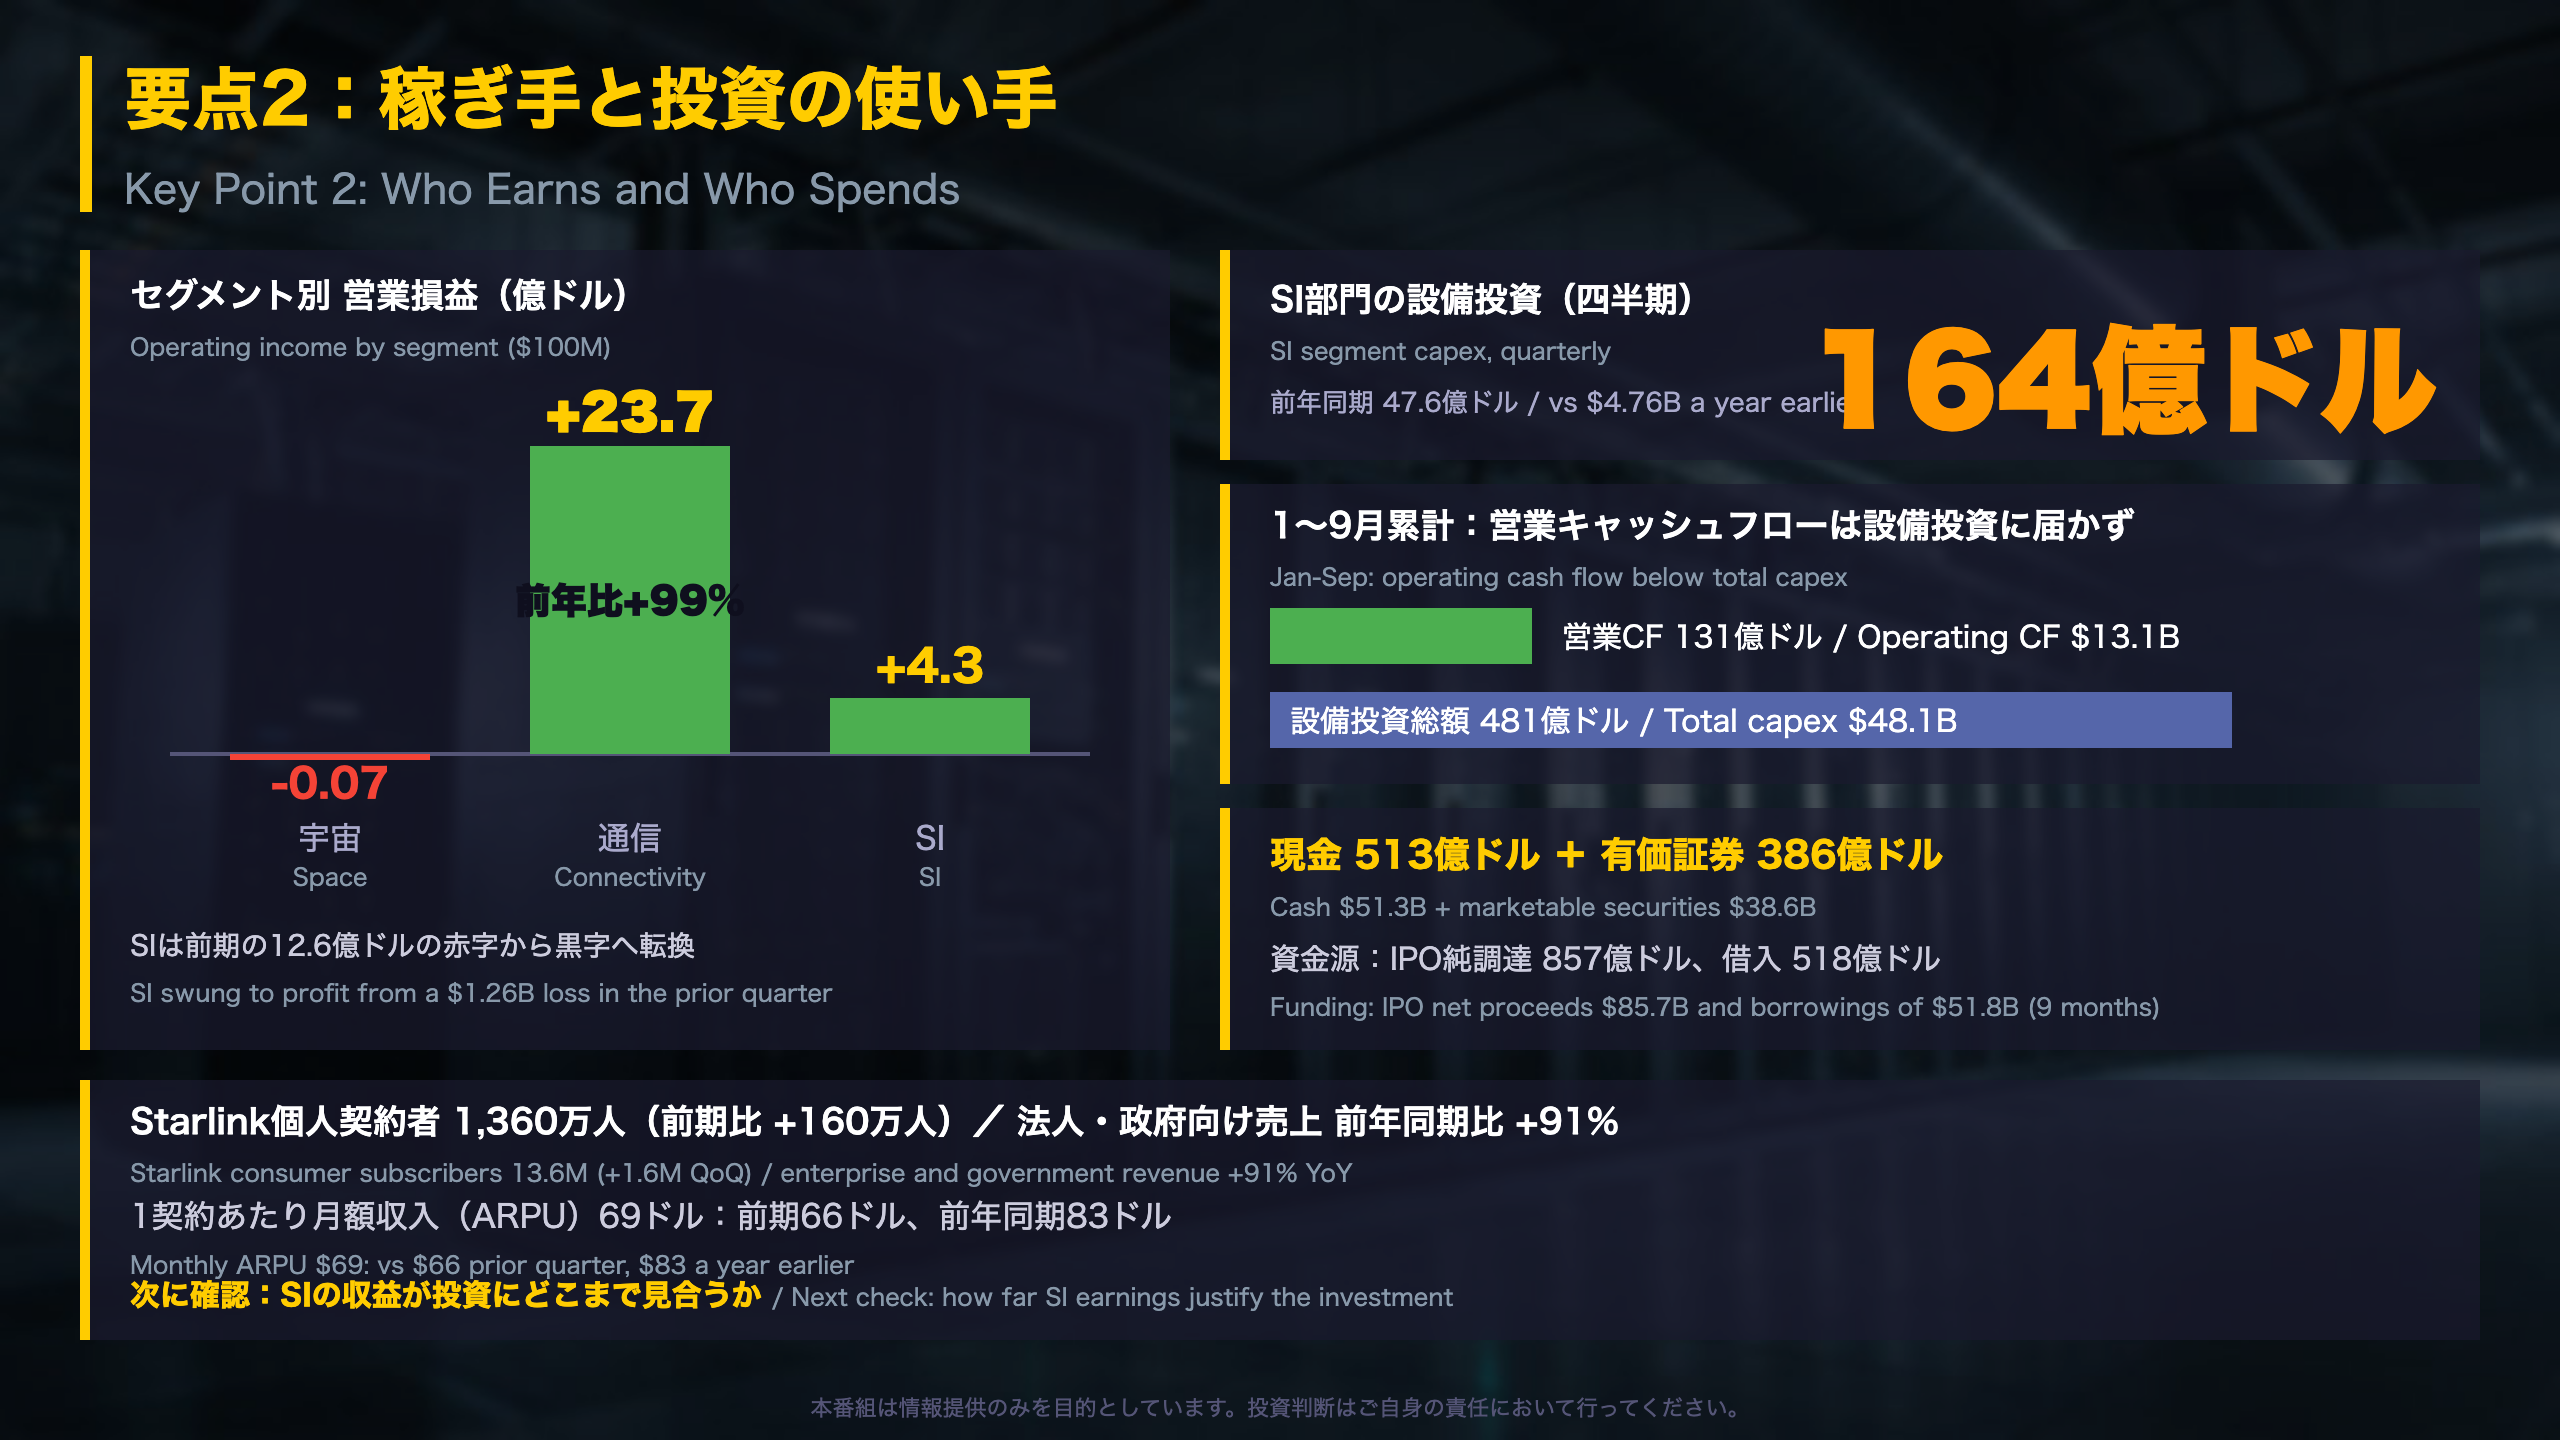
Connectivity (Starlink) earned $2.37 billion in operating income (vs. $1.66 billion in Q2 and $1.19 billion a year ago), an operating margin of about 45% on $5.25 billion of revenue. Adjusted EBITDA was $3.50 billion, about 67% of revenue. Consumer revenue grew 57% YoY and enterprise & government revenue 91%. Consumer subscribers reached 13.6 million (12.0 million in Q2, 7.2 million a year ago). One caveat: monthly ARPU was $69, above Q2’s $66 but below the $83 of a year earlier, so subscriber growth is outpacing revenue per user.
Capex: concentrated in SI
Total Q3 capex was $19.6 billion (Q2: $18.4 billion; a year ago: $6.9 billion), of which SI was $16.4 billion. Capex for the first nine months was $48.1 billion, about 3.7 times operating cash flow of $13.1 billion. Operating cash flow was helped by a $4.9 billion increase in deferred revenue, which reflects customer prepayments.
Balance sheet and funding
Cash was $51.3 billion and marketable securities $38.6 billion. Long-term debt was $36.1 billion, of which $10.7 billion is owed to related parties. Funding in the nine-month cash flow statement includes net IPO proceeds of $85.7 billion and $51.8 billion of new borrowings against $39.8 billion of repayments.
Independent view
The pattern resembles other large technology builders of AI capacity: profits from a mature cash-generating line fund a very large infrastructure program. Here, the cash-generating line is satellite broadband.
Two readings
- Constructive: liquidity of roughly $89.9 billion gives substantial room to keep building.
- Cautious: most capex sits in SI, so payback can only be assessed in future quarters.
質疑で深める:黒字の中身と次の注目点
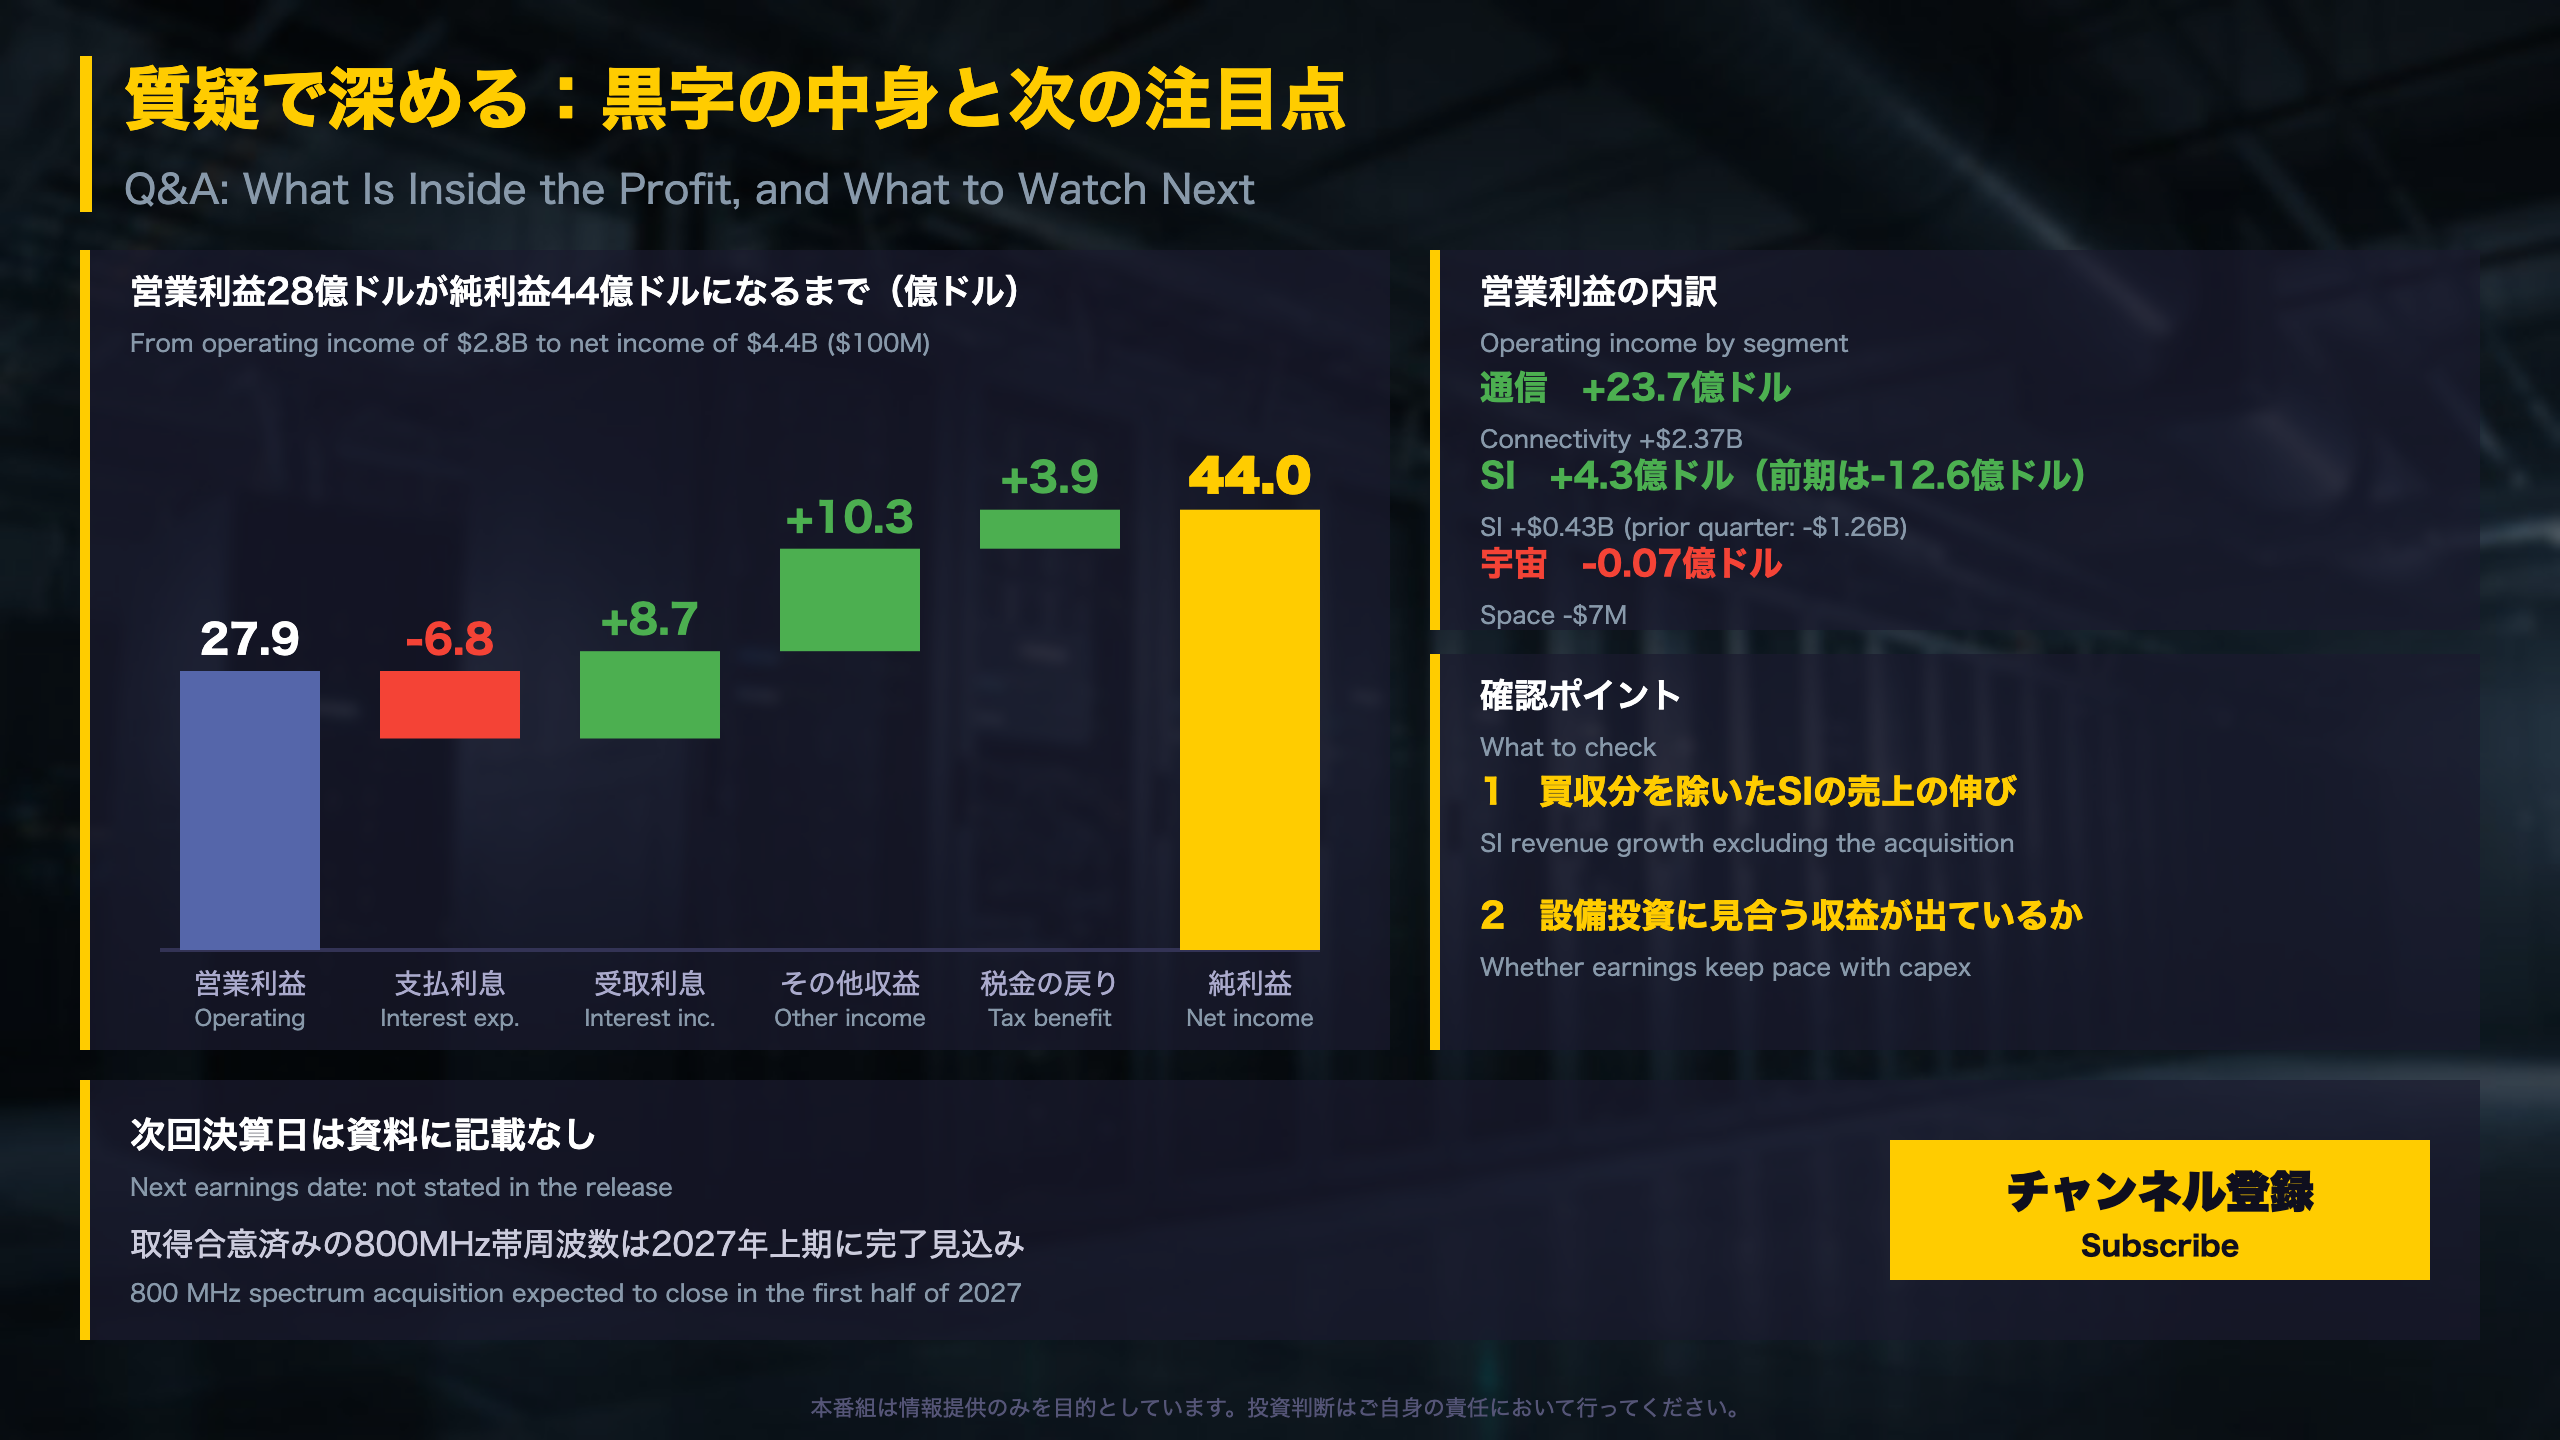
From Operating Income to Net Income
The bridge ($ billions)
- Operating income: 2.79
- Interest expense: -0.68 (of which related-party 0.35)
- Interest income: +0.87
- Other income, net: +1.03 (of which related-party 0.56)
- Pre-tax income: 4.01
- Income tax benefit: +0.39
- Net income: 4.40
The $1.61 billion between operating income and net income therefore comes from financial items, other income and a tax benefit rather than from operations. More than half of the ‘other income’ line is tied to related parties, which is worth reading in the full filing.
Per-share view
Diluted EPS was $0.35 versus -$0.36 a year earlier. The weighted diluted share count rose to 12.475 billion from 2.941 billion, reflecting the IPO and the conversion of preferred stock, so per-share comparisons across periods need care. For the nine months, net loss remains $0.41 billion, so the company is not yet profitable on a year-to-date basis.
Why GAAP vs. adjusted matters
The release itself cautions that Adjusted EBITDA is not a substitute for net income. For an SEC-registered company, GAAP operating income of $2.79 billion is the cleaner measure of core profitability, and it is positive.
Two readings
- Constructive: operating profit is positive, Connectivity carries most of it, and SI turned positive after absorbing acquisition-related stock compensation.
- Cautious: SI’s profit is a single quarter, and the net income margin is flattered by non-operating items.
What to watch
SI revenue growth excluding the acquisition, and whether revenue keeps pace with capex. The next earnings date is not stated; the 800 MHz spectrum deal is expected to close in the first half of 2027.
Disclaimer: This article is for informational purposes only. All investment decisions are made solely at your own risk.