
📺 Watch the Full Video Analysis
This article was automatically generated by the NFC Market Live AI analysis system. (Updated: 2026-10-21 05:15 JST)
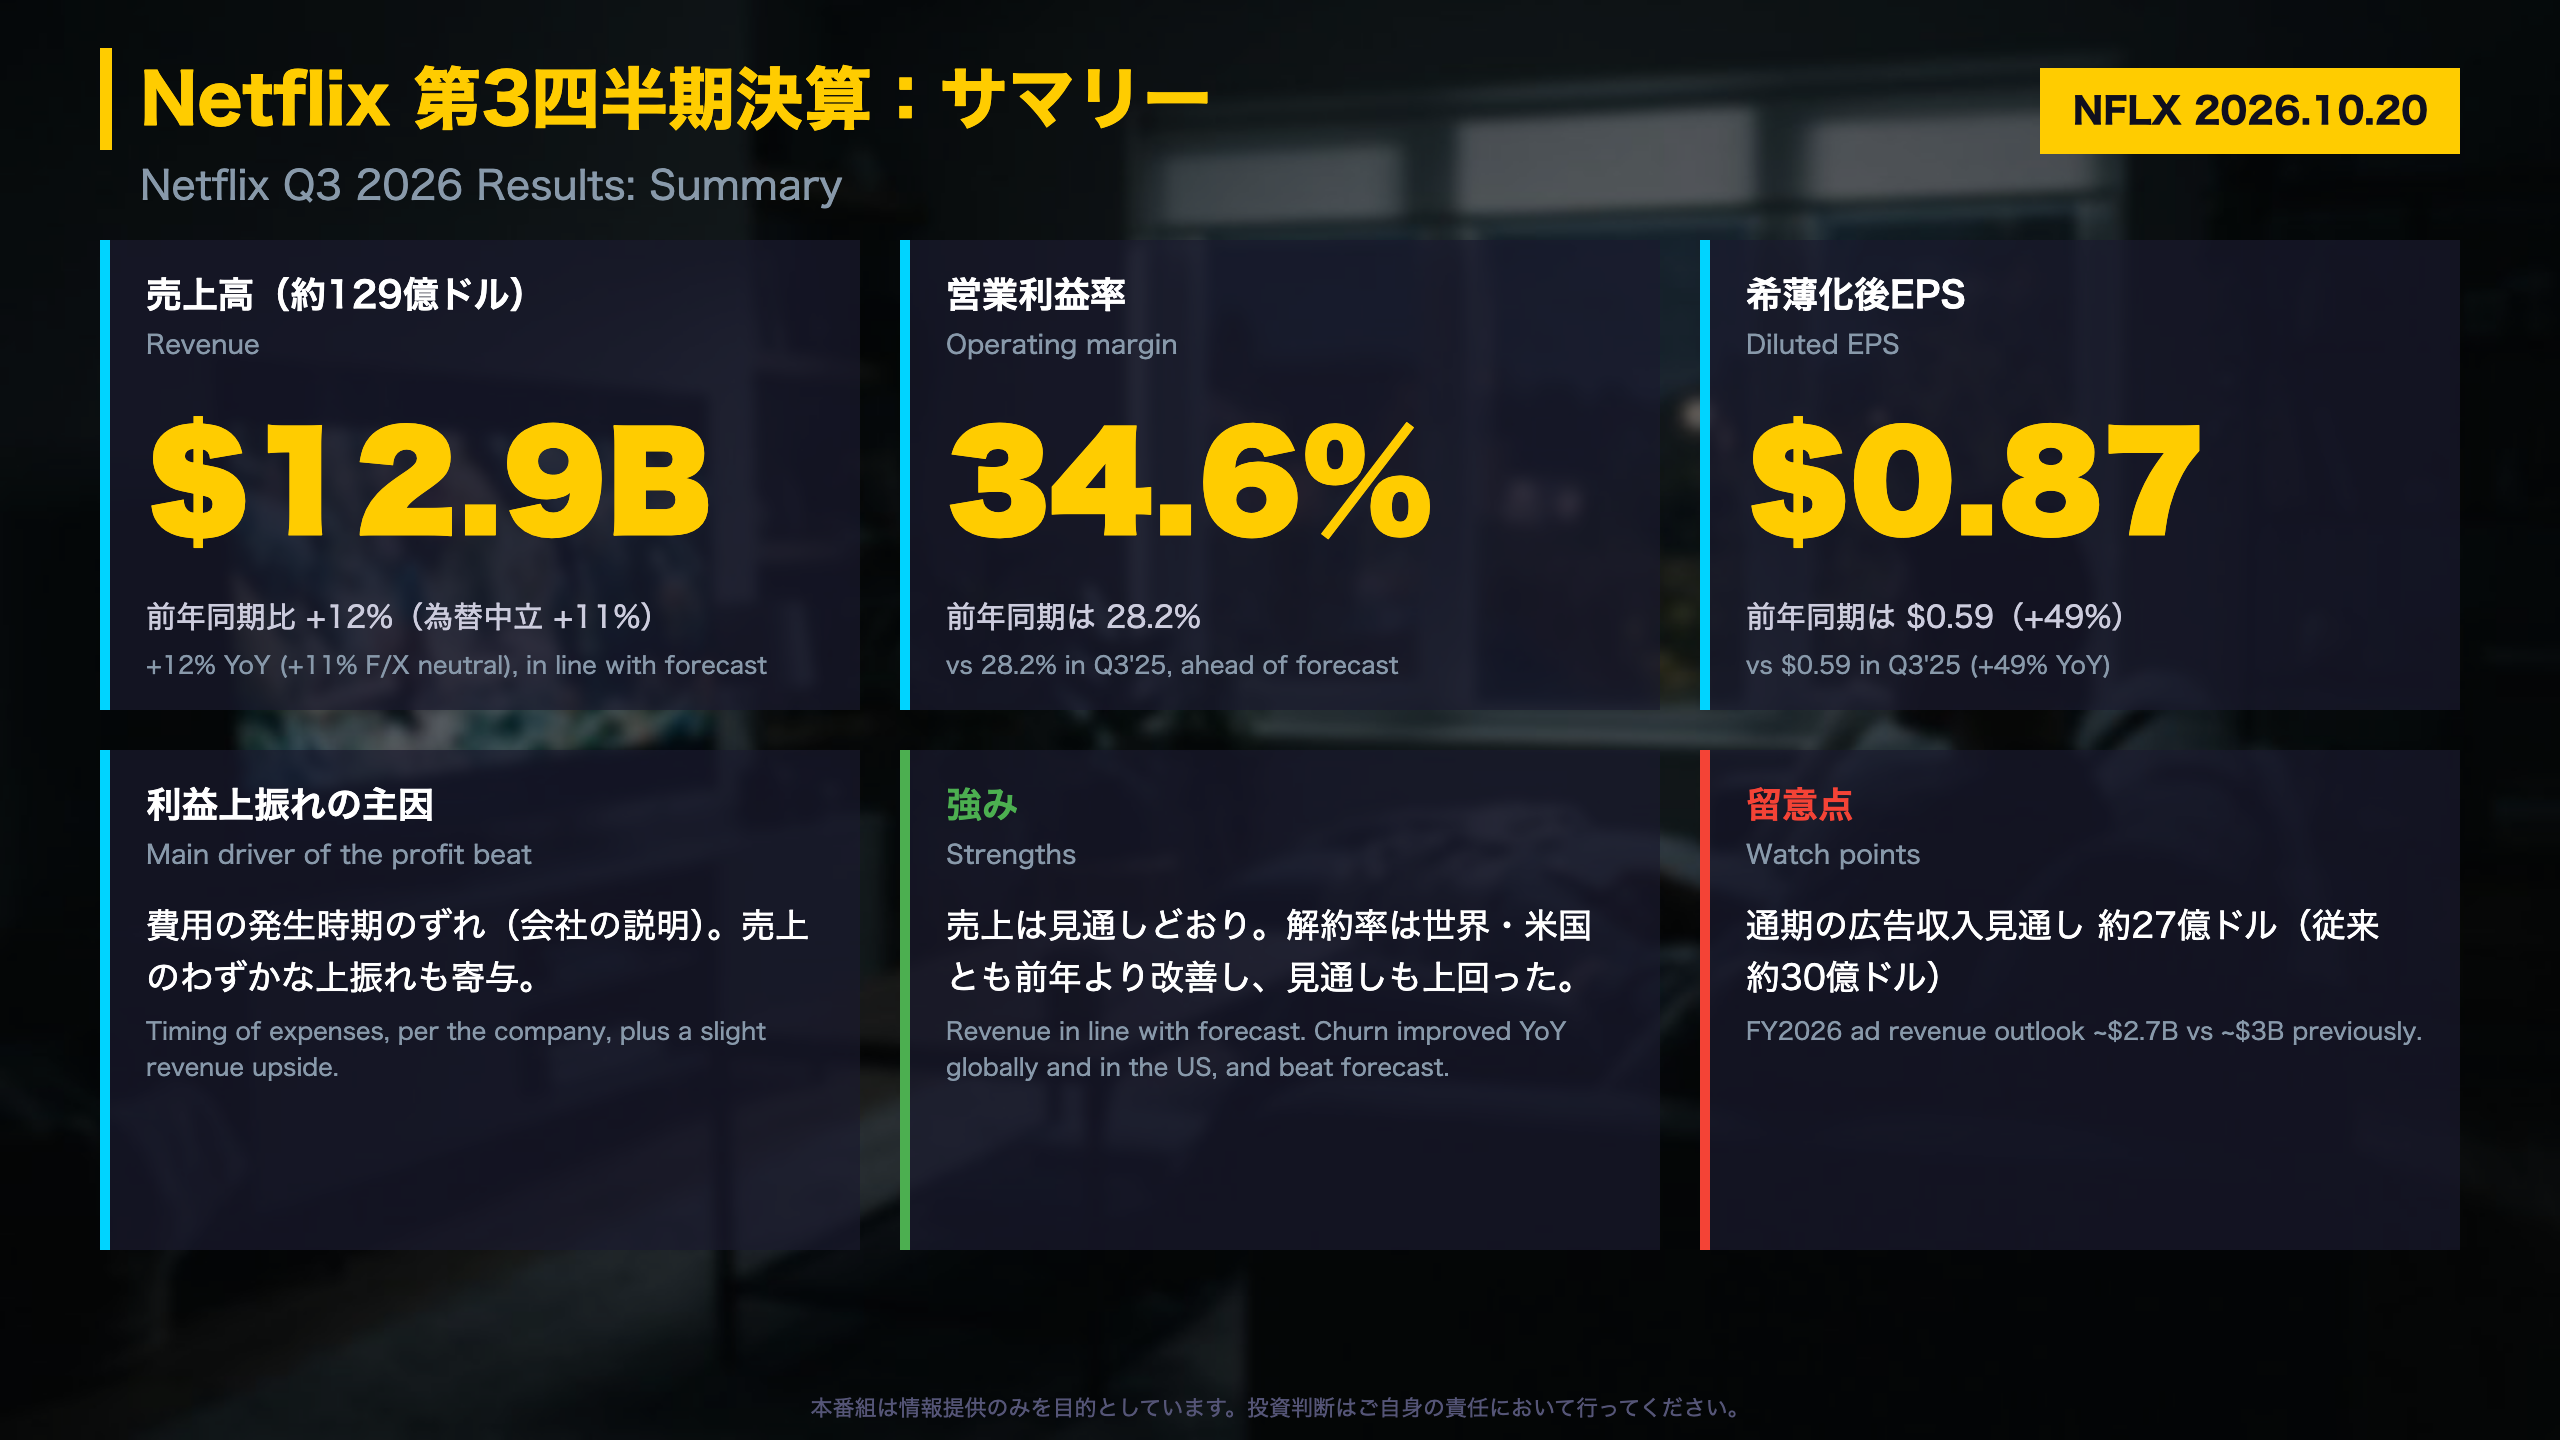
📊 Netflix (NFLX) reported Q3 2026 results on Oct 20. Revenue was $12.9B (+12% YoY), operating margin 34.6% (vs 28.2% a year earlier) and diluted EPS $0.87.
💡 The company attributes the beat versus its own forecast mainly to the timing of expenses. Churn improved, and the full-year operating margin forecast is 31.5%.
⚠️ On the other hand, full-year ad revenue is now expected at about $2.7B (prior: about $3B). The Q4 margin forecast of 26.0% includes the impact of headcount reductions.
📈 A balanced read of strength and caution, based strictly on the primary source.
サマリー:利益率は改善、広告見通しは下方修正
Netflix Q3 2026: what the shareholder letter actually says
Netflix does not hold a traditional earnings-call script; the primary document is a shareholder letter filed with the SEC as Exhibit 99.1 of a Form 8-K. Management states that its guidance is its “actual internal forecast,” and it names revenue (growth) and operating margin (profitability) as its primary metrics.
Key numbers
- Revenue: $12.87B, +11.8% YoY (+11% on a currency-neutral basis)
- Operating income: $4.46B; operating margin 34.6% vs 28.2% a year earlier
- Diluted EPS: $0.87 vs $0.59 (share counts adjusted for the 10-for-1 split of November 2025)
- Q4 forecast: revenue $13.4B, operating margin 26.0%, EPS $0.67
Context for non-US readers
- “F/X neutral” strips out the year-over-year effect of currency moves and realized hedging, so it isolates underlying growth.
- The company beat its own forecast on profit; the letter does not compare results with analyst consensus, so we make no such claim.
- Net income in Q1 2026 ($5.28B) was inflated by a large item in “interest and other income” (about $2.9B across nine months); the letter does not explain it.
Balanced reading
Positives: revenue in line, churn improved globally and in the US, shrinking share count. Cautions: management says the profit beat came “primarily” from timing of expenses, and ad revenue guidance for 2026 was cut.
What to watch
Q4 delivery against the forecast. The next earnings date is not stated in the letter.
深掘り1:営業利益率34.6%の中身
Reading the 34.6% operating margin
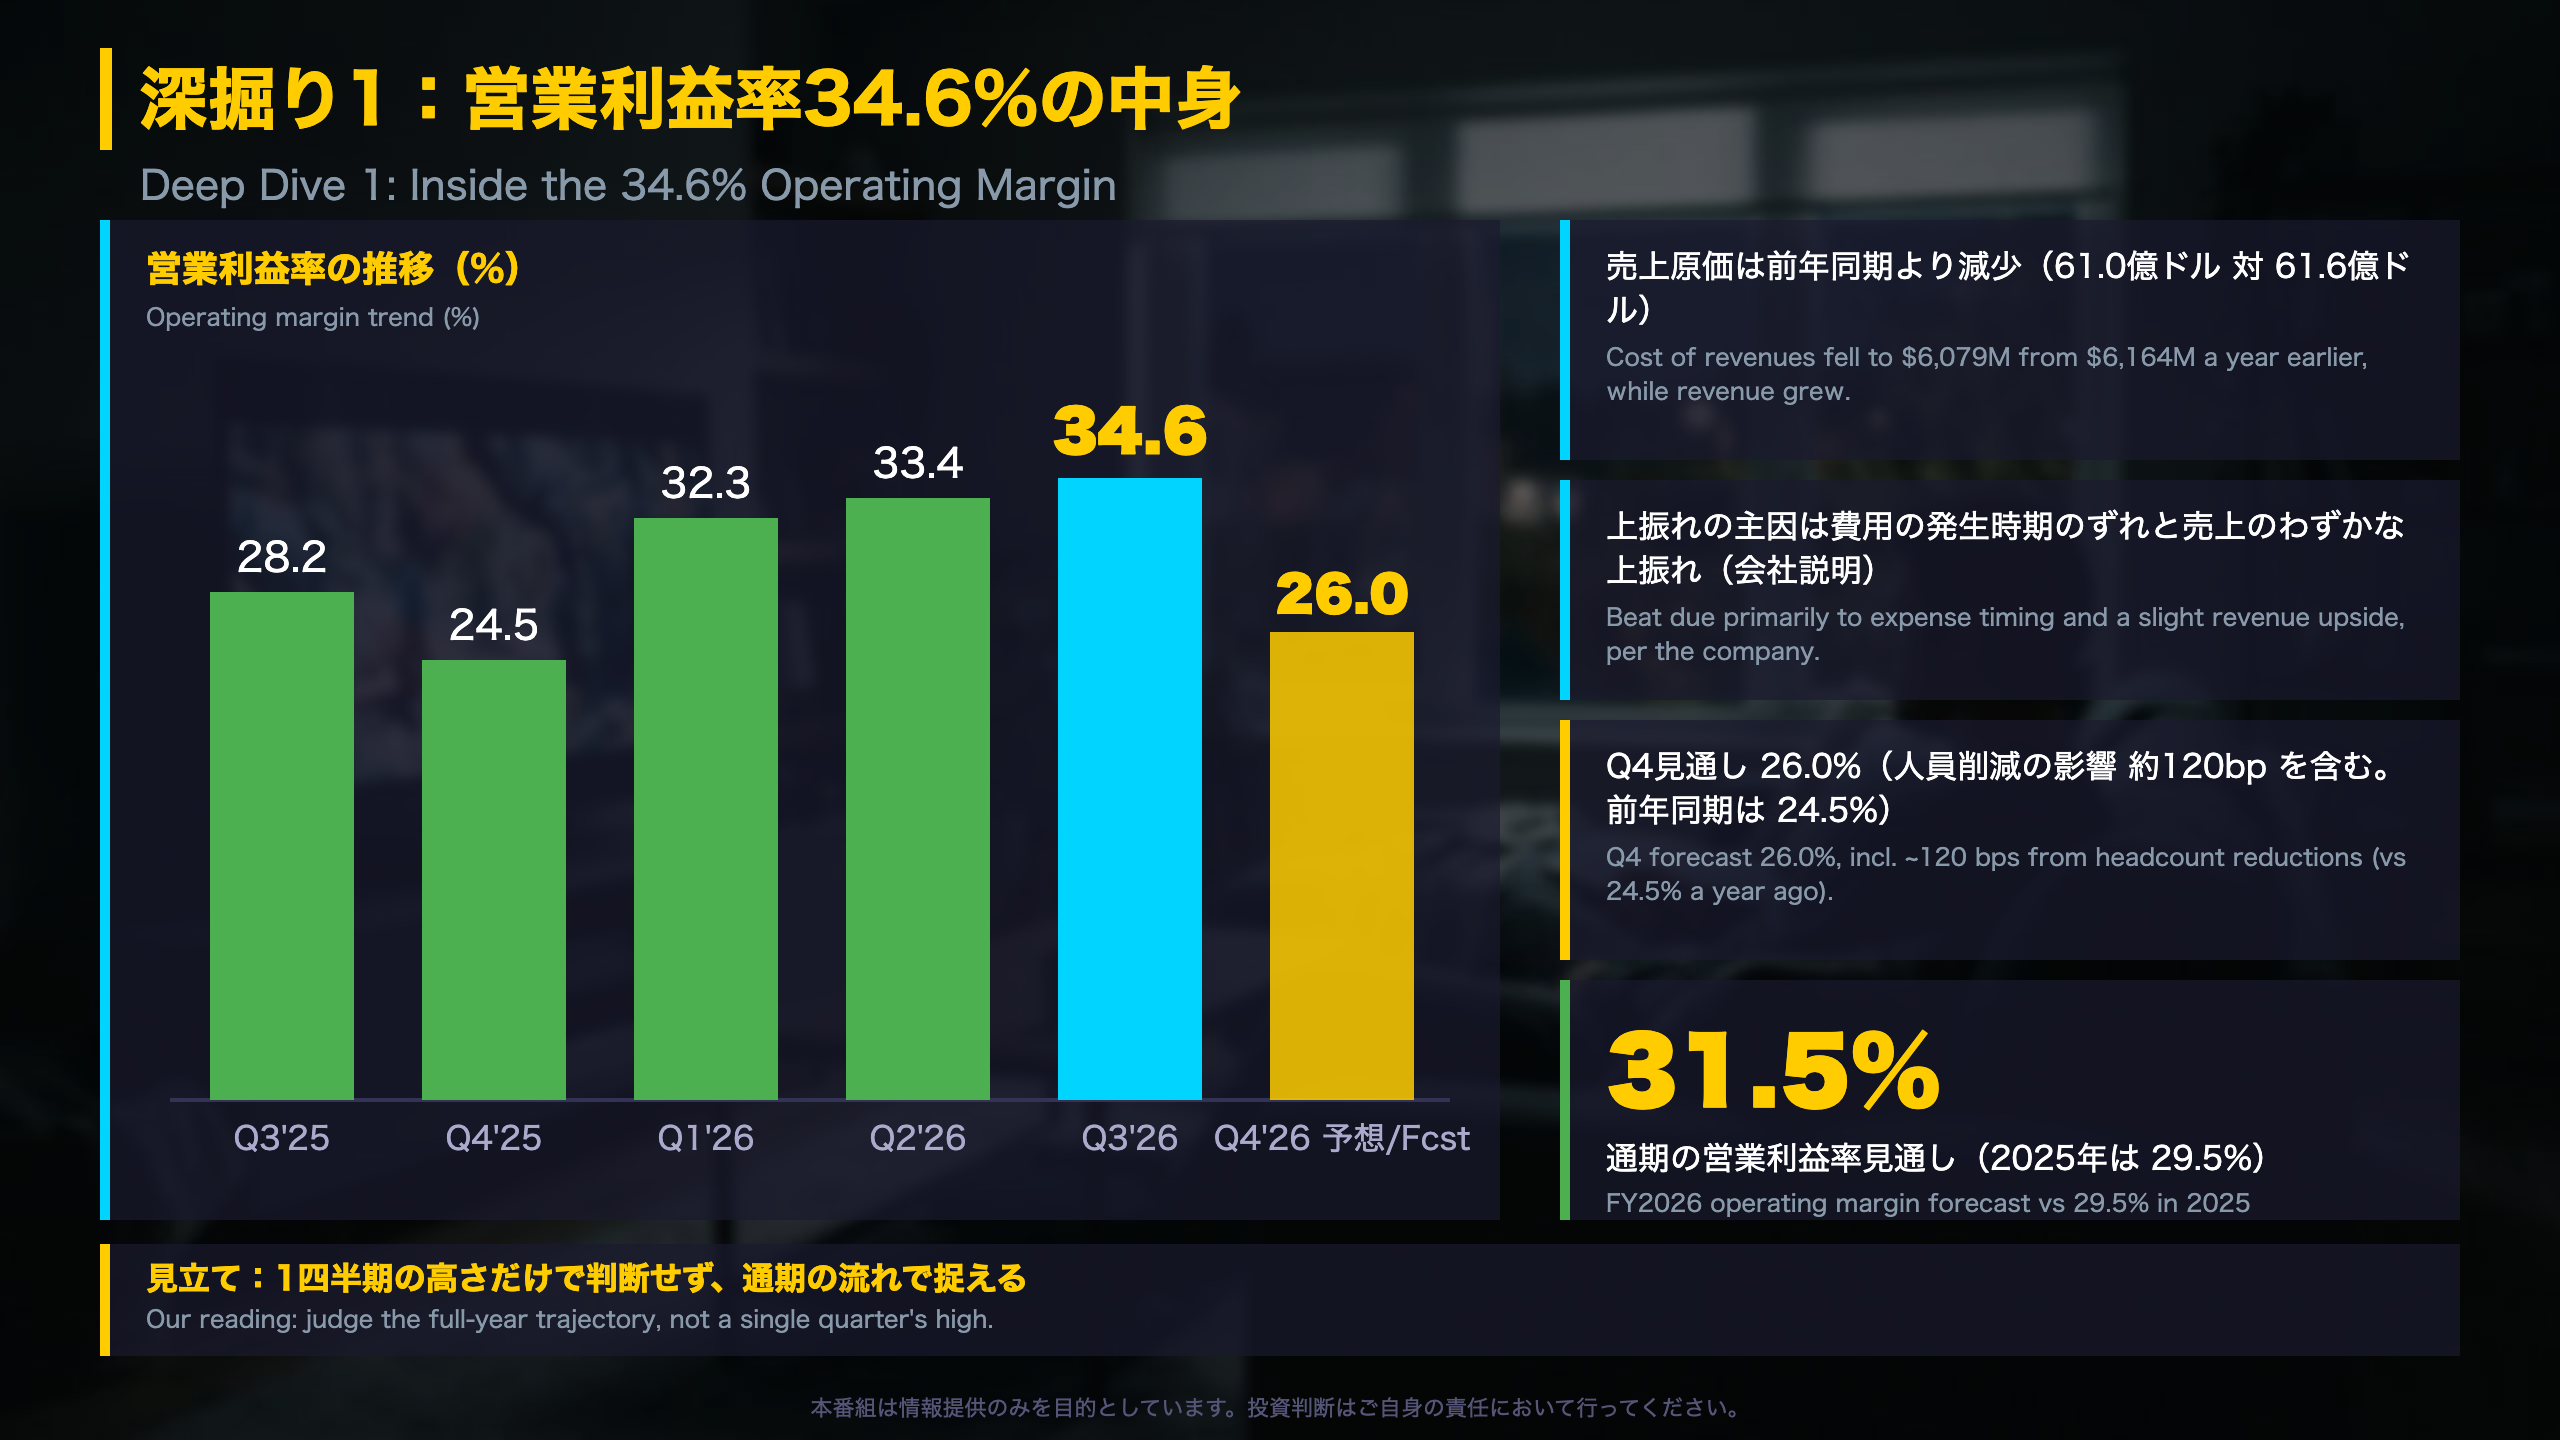
Netflix’s operating margin is its main profitability yardstick. In Q3 2026 it was 34.6%, versus 28.2% in Q3 2025 and 33.4% in Q2 2026.
What moved
- Cost of revenues fell to $6.08B from $6.16B a year ago even as revenue rose about 12%.
- Technology and development rose to $1.03B from $0.85B, and sales and marketing to $0.84B from $0.79B.
- Content: amortization was $4.24B (vs $4.00B) and additions to content assets $5.16B (vs $4.65B). Management still expects a cash content spend to amortization ratio of about 1.1x for 2026.
Management’s explanation
The letter says the margin and operating income were ahead of forecast “due primarily to the timing of expenses and the slight upside in revenue.” That wording matters: it points to phasing rather than a change in the cost base.
Why Q4 looks lower
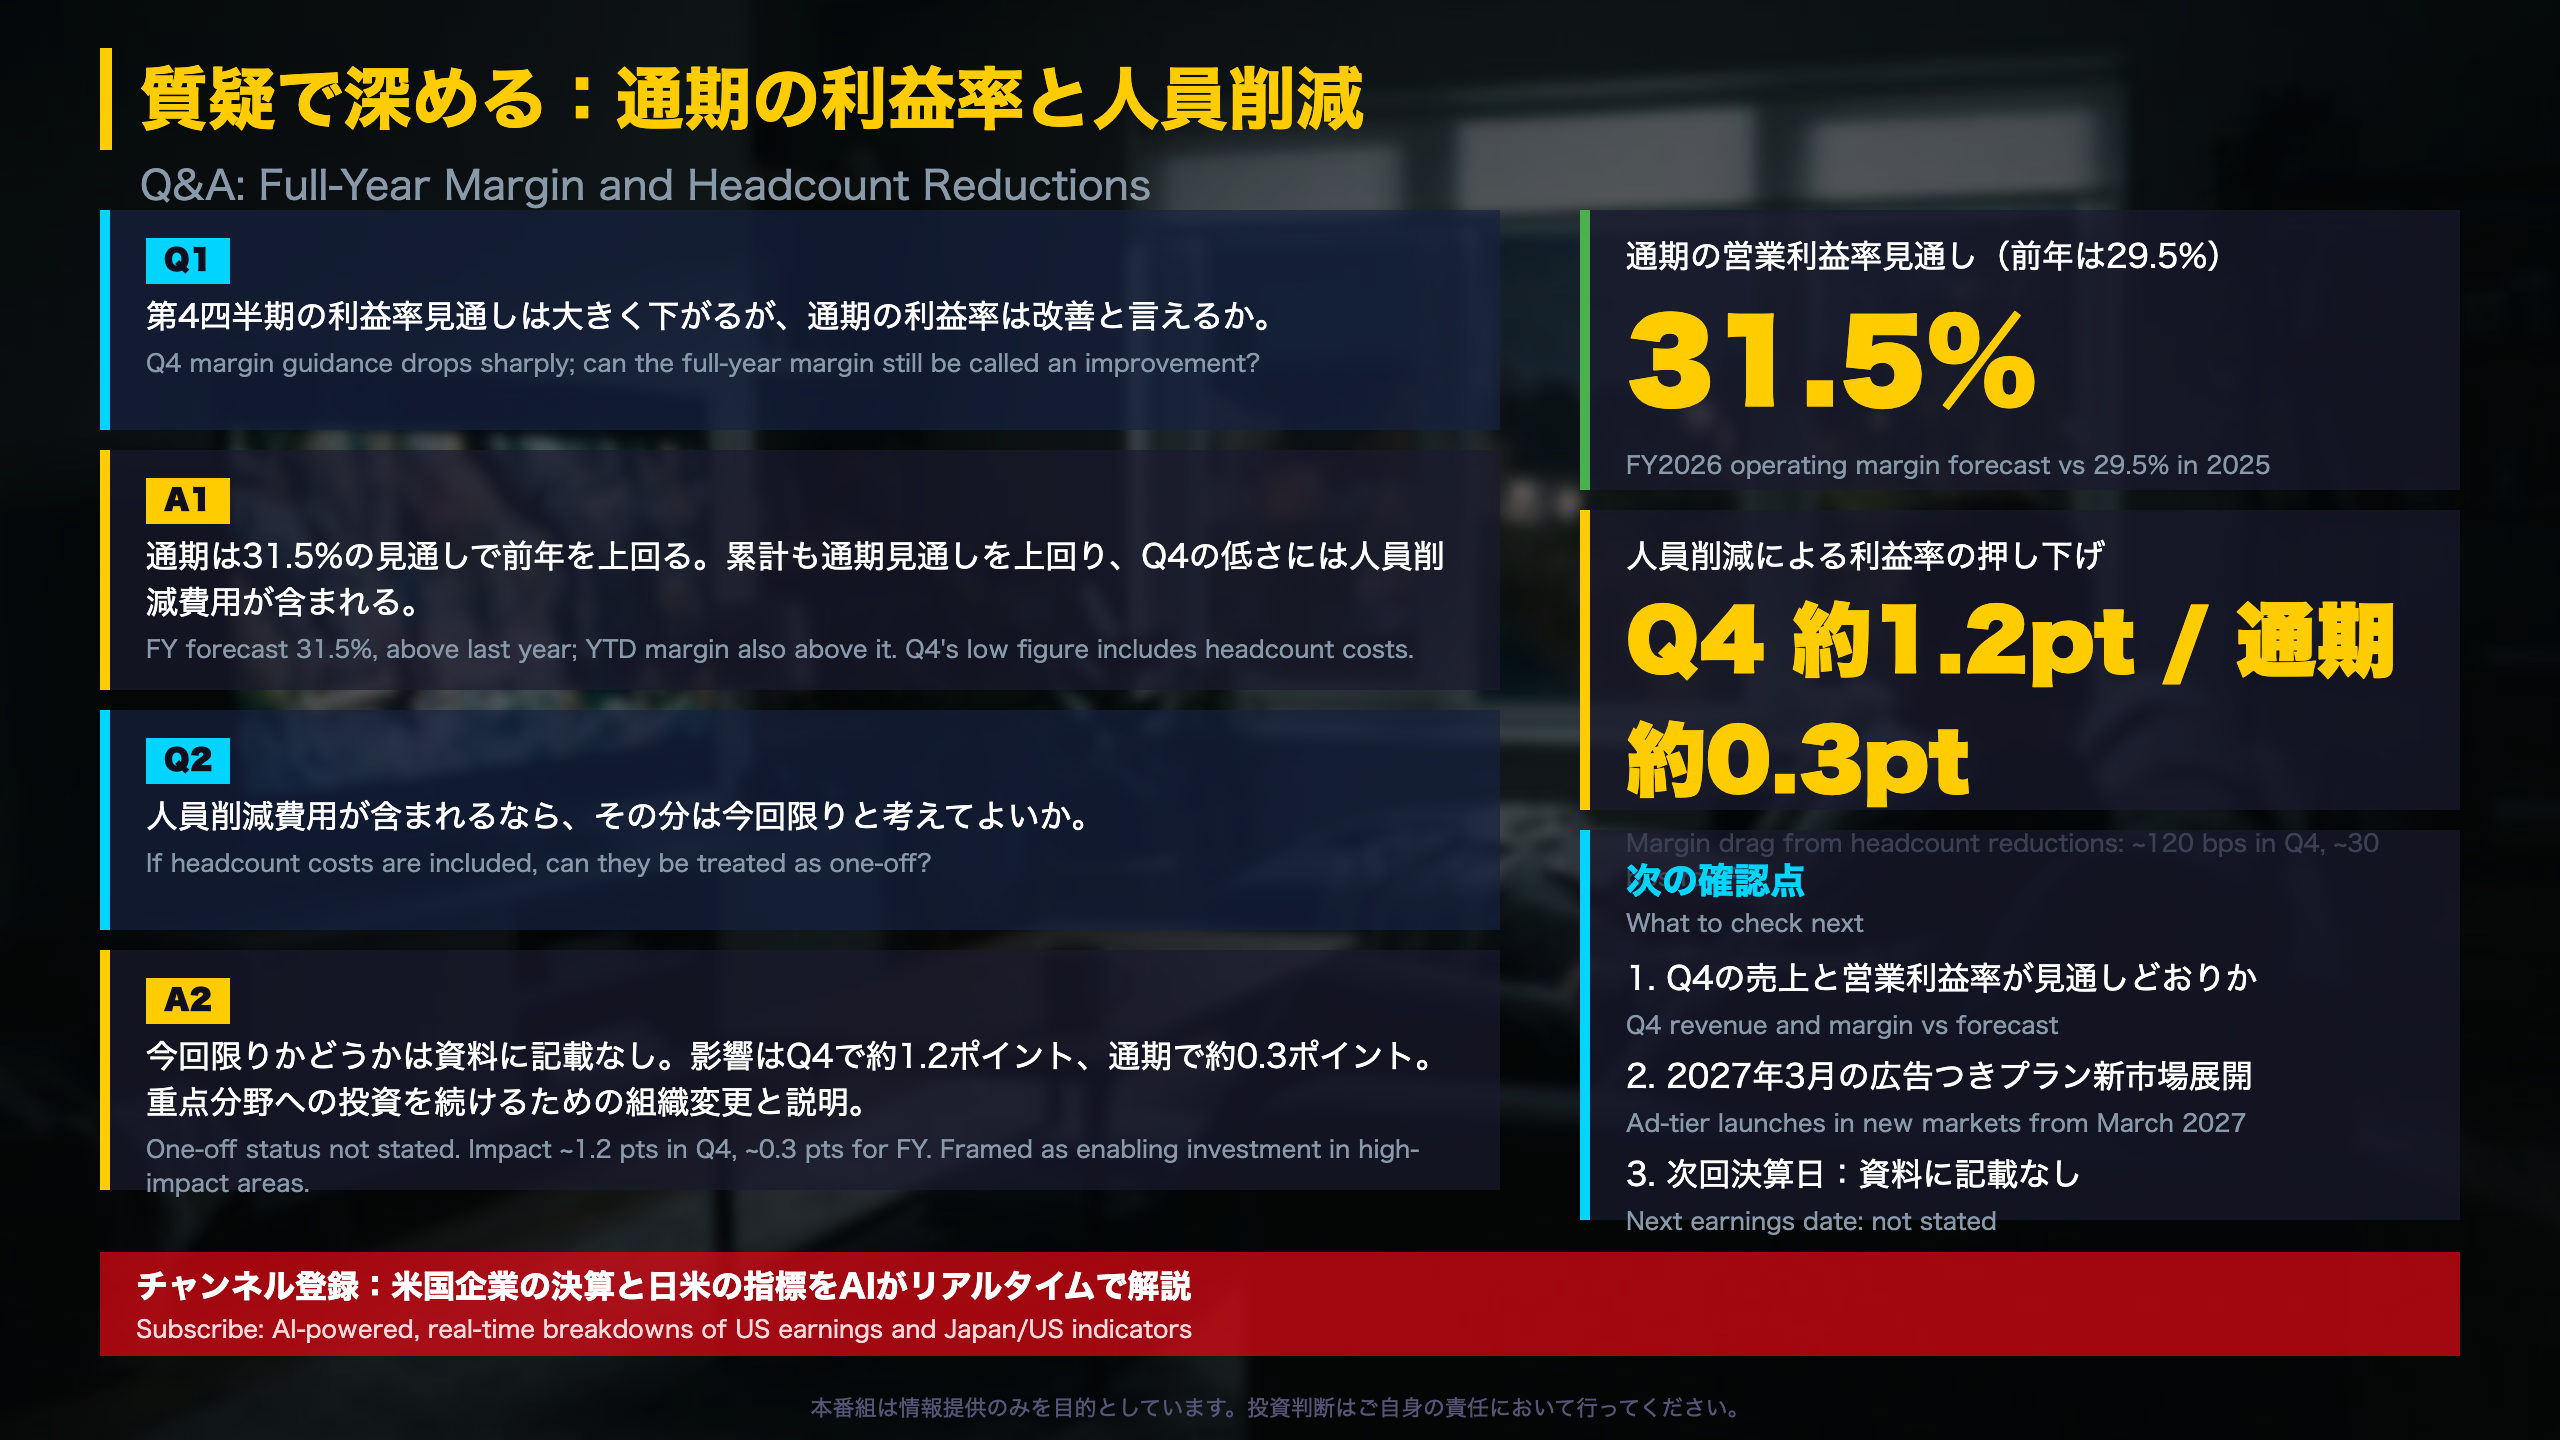
The Q4 margin forecast is 26.0%, including roughly 120 basis points of drag from announced headcount reductions (about 30 bps for the full year). Last year the margin also dropped from 28.2% in Q3 to 24.5% in Q4; whether this is seasonal is not stated.
Full-year frame
The 2026 margin forecast is 31.5% (31.4% at January 1 FX rates) versus 29.5% in 2025, implying operating income growth above 20%.
Takeaway
We offer no market forecast. The factual checkpoints are Q4 delivery against 26.0% and any update on the cost phasing.
深掘り2:成長の減速と地域差
Growth is cooling, but unevenly
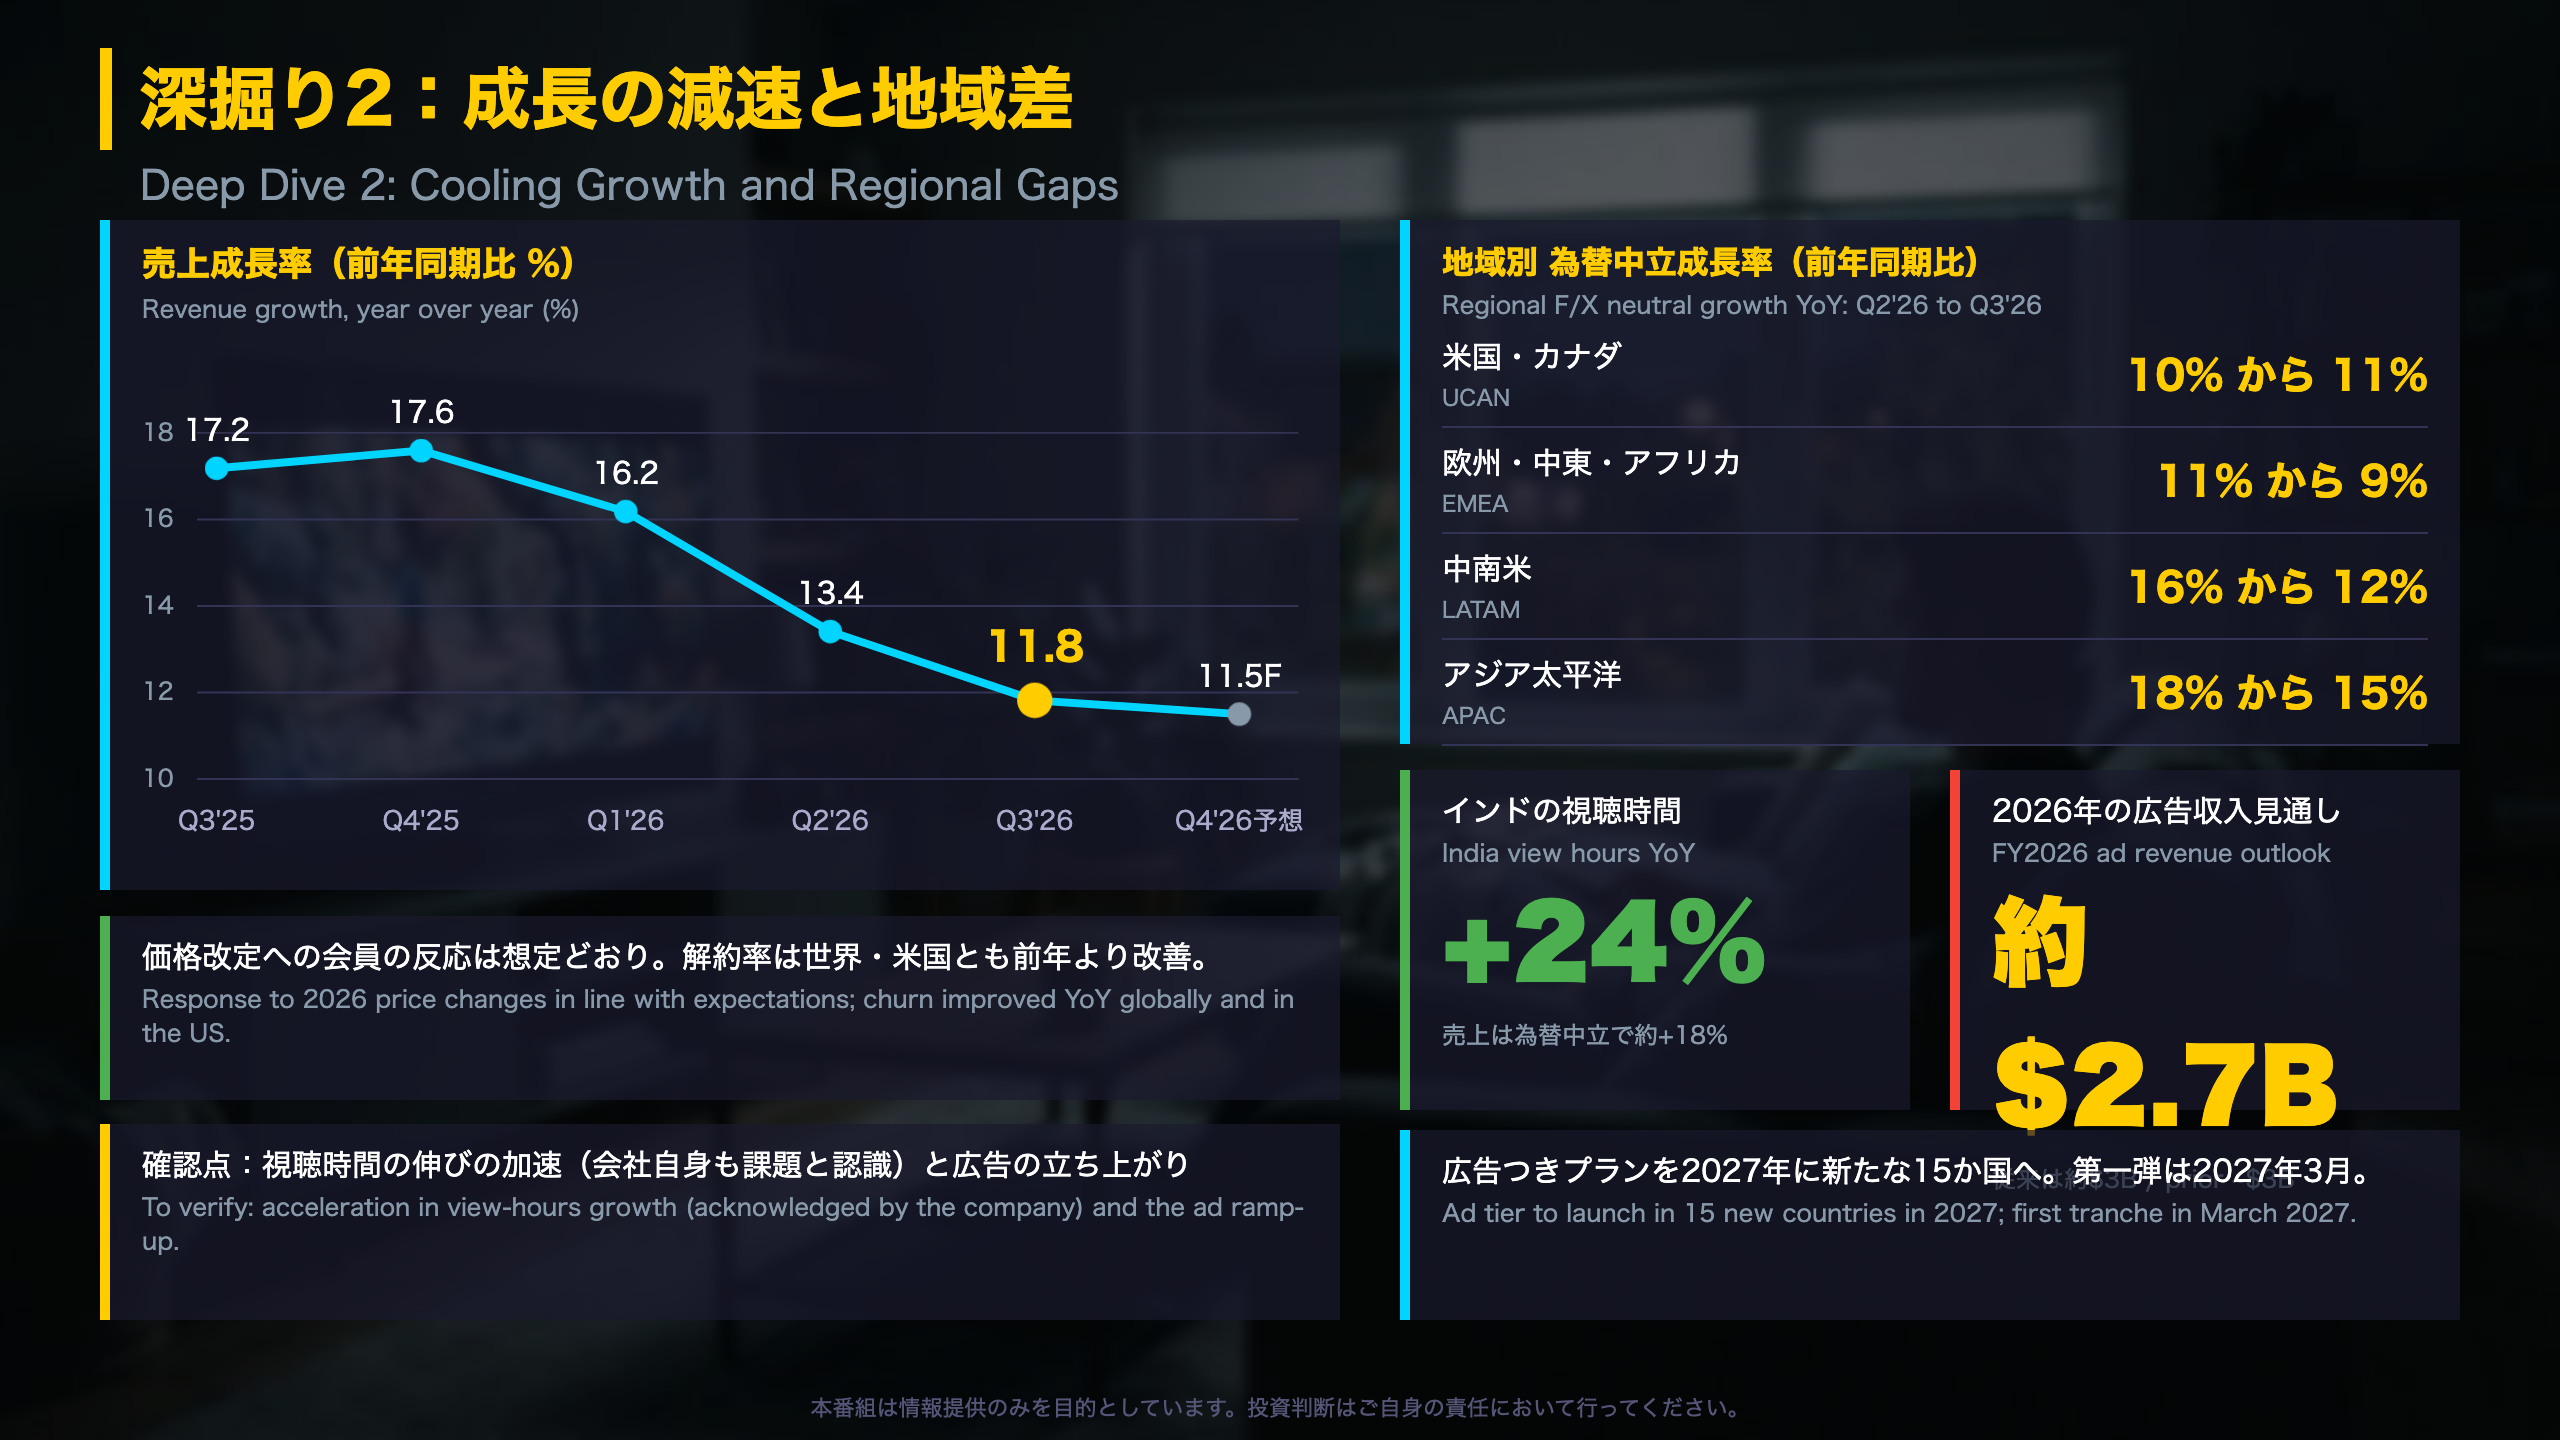
Netflix’s revenue growth has stepped down from 17.2% (Q3’25) to 13.4% (Q2’26) and 11.8% (Q3’26), with the Q4 forecast at 11.5%.
Regional detail (reported / F/X neutral)
- UCAN (US and Canada): 11% / 11%, up from 10% in Q2.
- EMEA: 11% / 9%; currency-neutral growth has slowed from 15% a year ago.
- LATAM: 17% / 12%; reported growth is flattered by currency.
- APAC: 12% / 15%; currency is a headwind here.
Why view hours matter
Netflix monetizes through subscriptions and advertising, so engagement (“quantity, quality and variety of viewing”) underpins both retention and pricing power. Management openly says investors are concerned about view-hours growth and that it aims to accelerate it. It says the response to 2026 price increases was in line with expectations.
Bright spots
- India: view hours +24%, revenue about +18% F/X neutral, record paid net additions, helped by a Flipkart loyalty bundle.
- Local-language hits: non-English viewing has grown from under 10% to more than a third of total viewing over a decade.
- Partnerships: TF1 in France is reported to generate incremental viewing.
Advertising
Full-year ad revenue is now about $2.7B versus roughly $3B, blamed on a slightly slower rollout of some ad product capabilities. The ad tier is planned for 15 new countries in 2027, starting in March.
Takeaway
No market forecast is offered. Watch Q4 revenue growth versus 11.5%, ad product rollout, and any disclosure on view-hours growth.
質疑で深める:通期利益率と人員削減
Capital allocation and cash flow: the facts behind the Q&A
Netflix’s stated priorities are unchanged: reinvest in the business (organically and through selective M&A), keep a healthy balance sheet and ample liquidity, then return excess cash through buybacks.
Cash generation
- Operating cash flow: $3.16B (vs $2.83B a year ago)
- Free cash flow (operating cash flow minus purchases of property and equipment): $2.88B (vs $2.66B); nine-month FCF $9.50B
- 2026 FCF forecast trimmed to about $12.0B from $12.5B, mainly due to the expected closing of a real estate transaction in Q4.
Buybacks and leverage
- Q3 repurchases: 63.9 million shares for $4.8B, the largest quarter on record; $22.3B of authorization remains.
- Gross debt $15.3B, cash $8.2B, non-GAAP net debt $7.1B.
- A $1B bond was issued in Q3 to fund a $1B maturity in Q4; short-term debt rose to $2.47B from $1.0B at year-end.
- Streaming content obligations: $25.2B vs $24.0B at end-2025.
Headcount reductions
The Q4 margin guide absorbs about 120 bps of cost from headcount reductions (about 30 bps for the full year). The letter does not say whether these costs are non-recurring; management frames the changes as freeing resources to invest in high-impact areas.
Balanced read
Solid cash generation and record buybacks coexist with a lower cash balance and a lower FCF forecast. We make no market forecast; the next earnings date is not given in the letter.
Disclaimer: This article is for informational purposes only. All investment decisions are made solely at your own risk.