📺 Watch the Full Video Analysis
This article was automatically generated by the NFC Market Live AI analysis system. (Updated: 2026-10-15 21:11 JST)
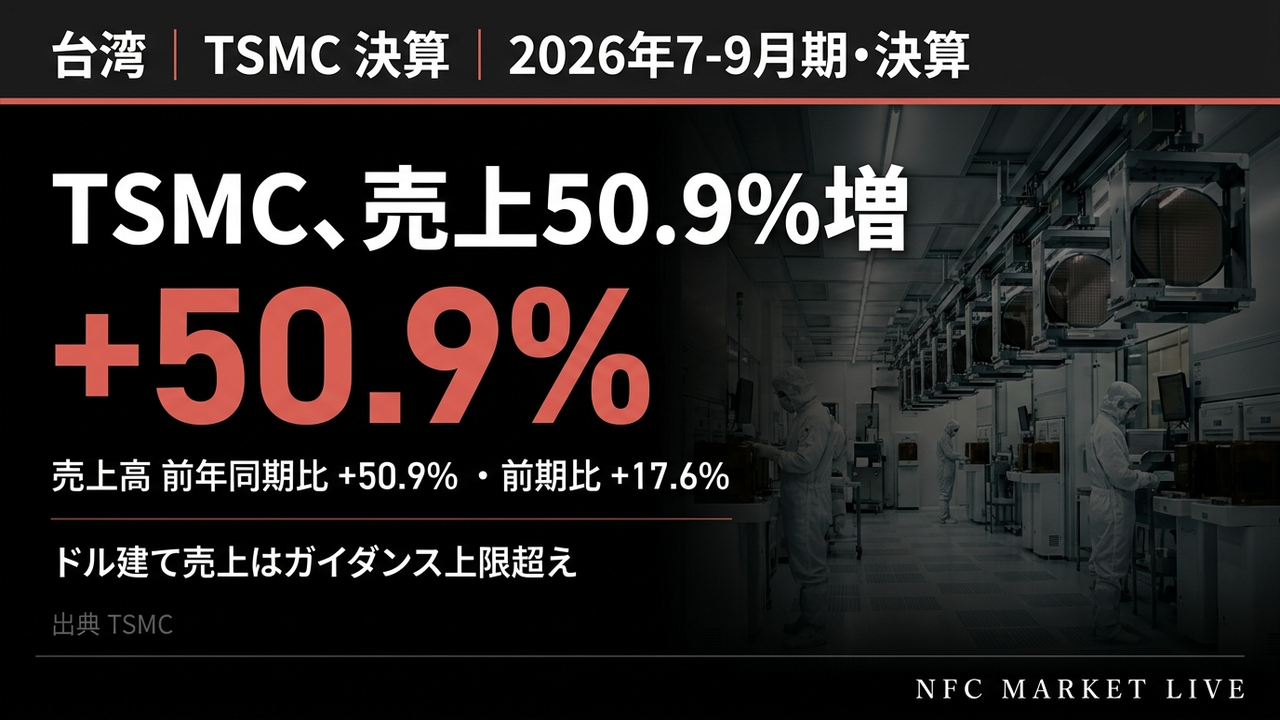
📊 TSMC reported 3Q26 results: revenue of NT$1,494.24 billion (+50.9% YoY) and EPS of NT$29.43 (US$4.60 per ADR unit).
💡 US$ revenue of $46.72 billion topped the upper end of company guidance, and the 58.7% operating margin also exceeded the top of its range.
⚠️ Gross margin slipped from 67.7% to 66.4% and net margin from 55.6% to 51.1%, with non-operating items down sharply from the prior quarter.
📈 4Q26 revenue guidance: $52.3-54.3 billion. 2nm was 8% of wafer revenue; advanced nodes 79%.
🔍 A balanced, data-driven deep dive into both the strengths and the watch points.
TSMC 2026年7〜9月期:強い成長と利益率の小幅低下
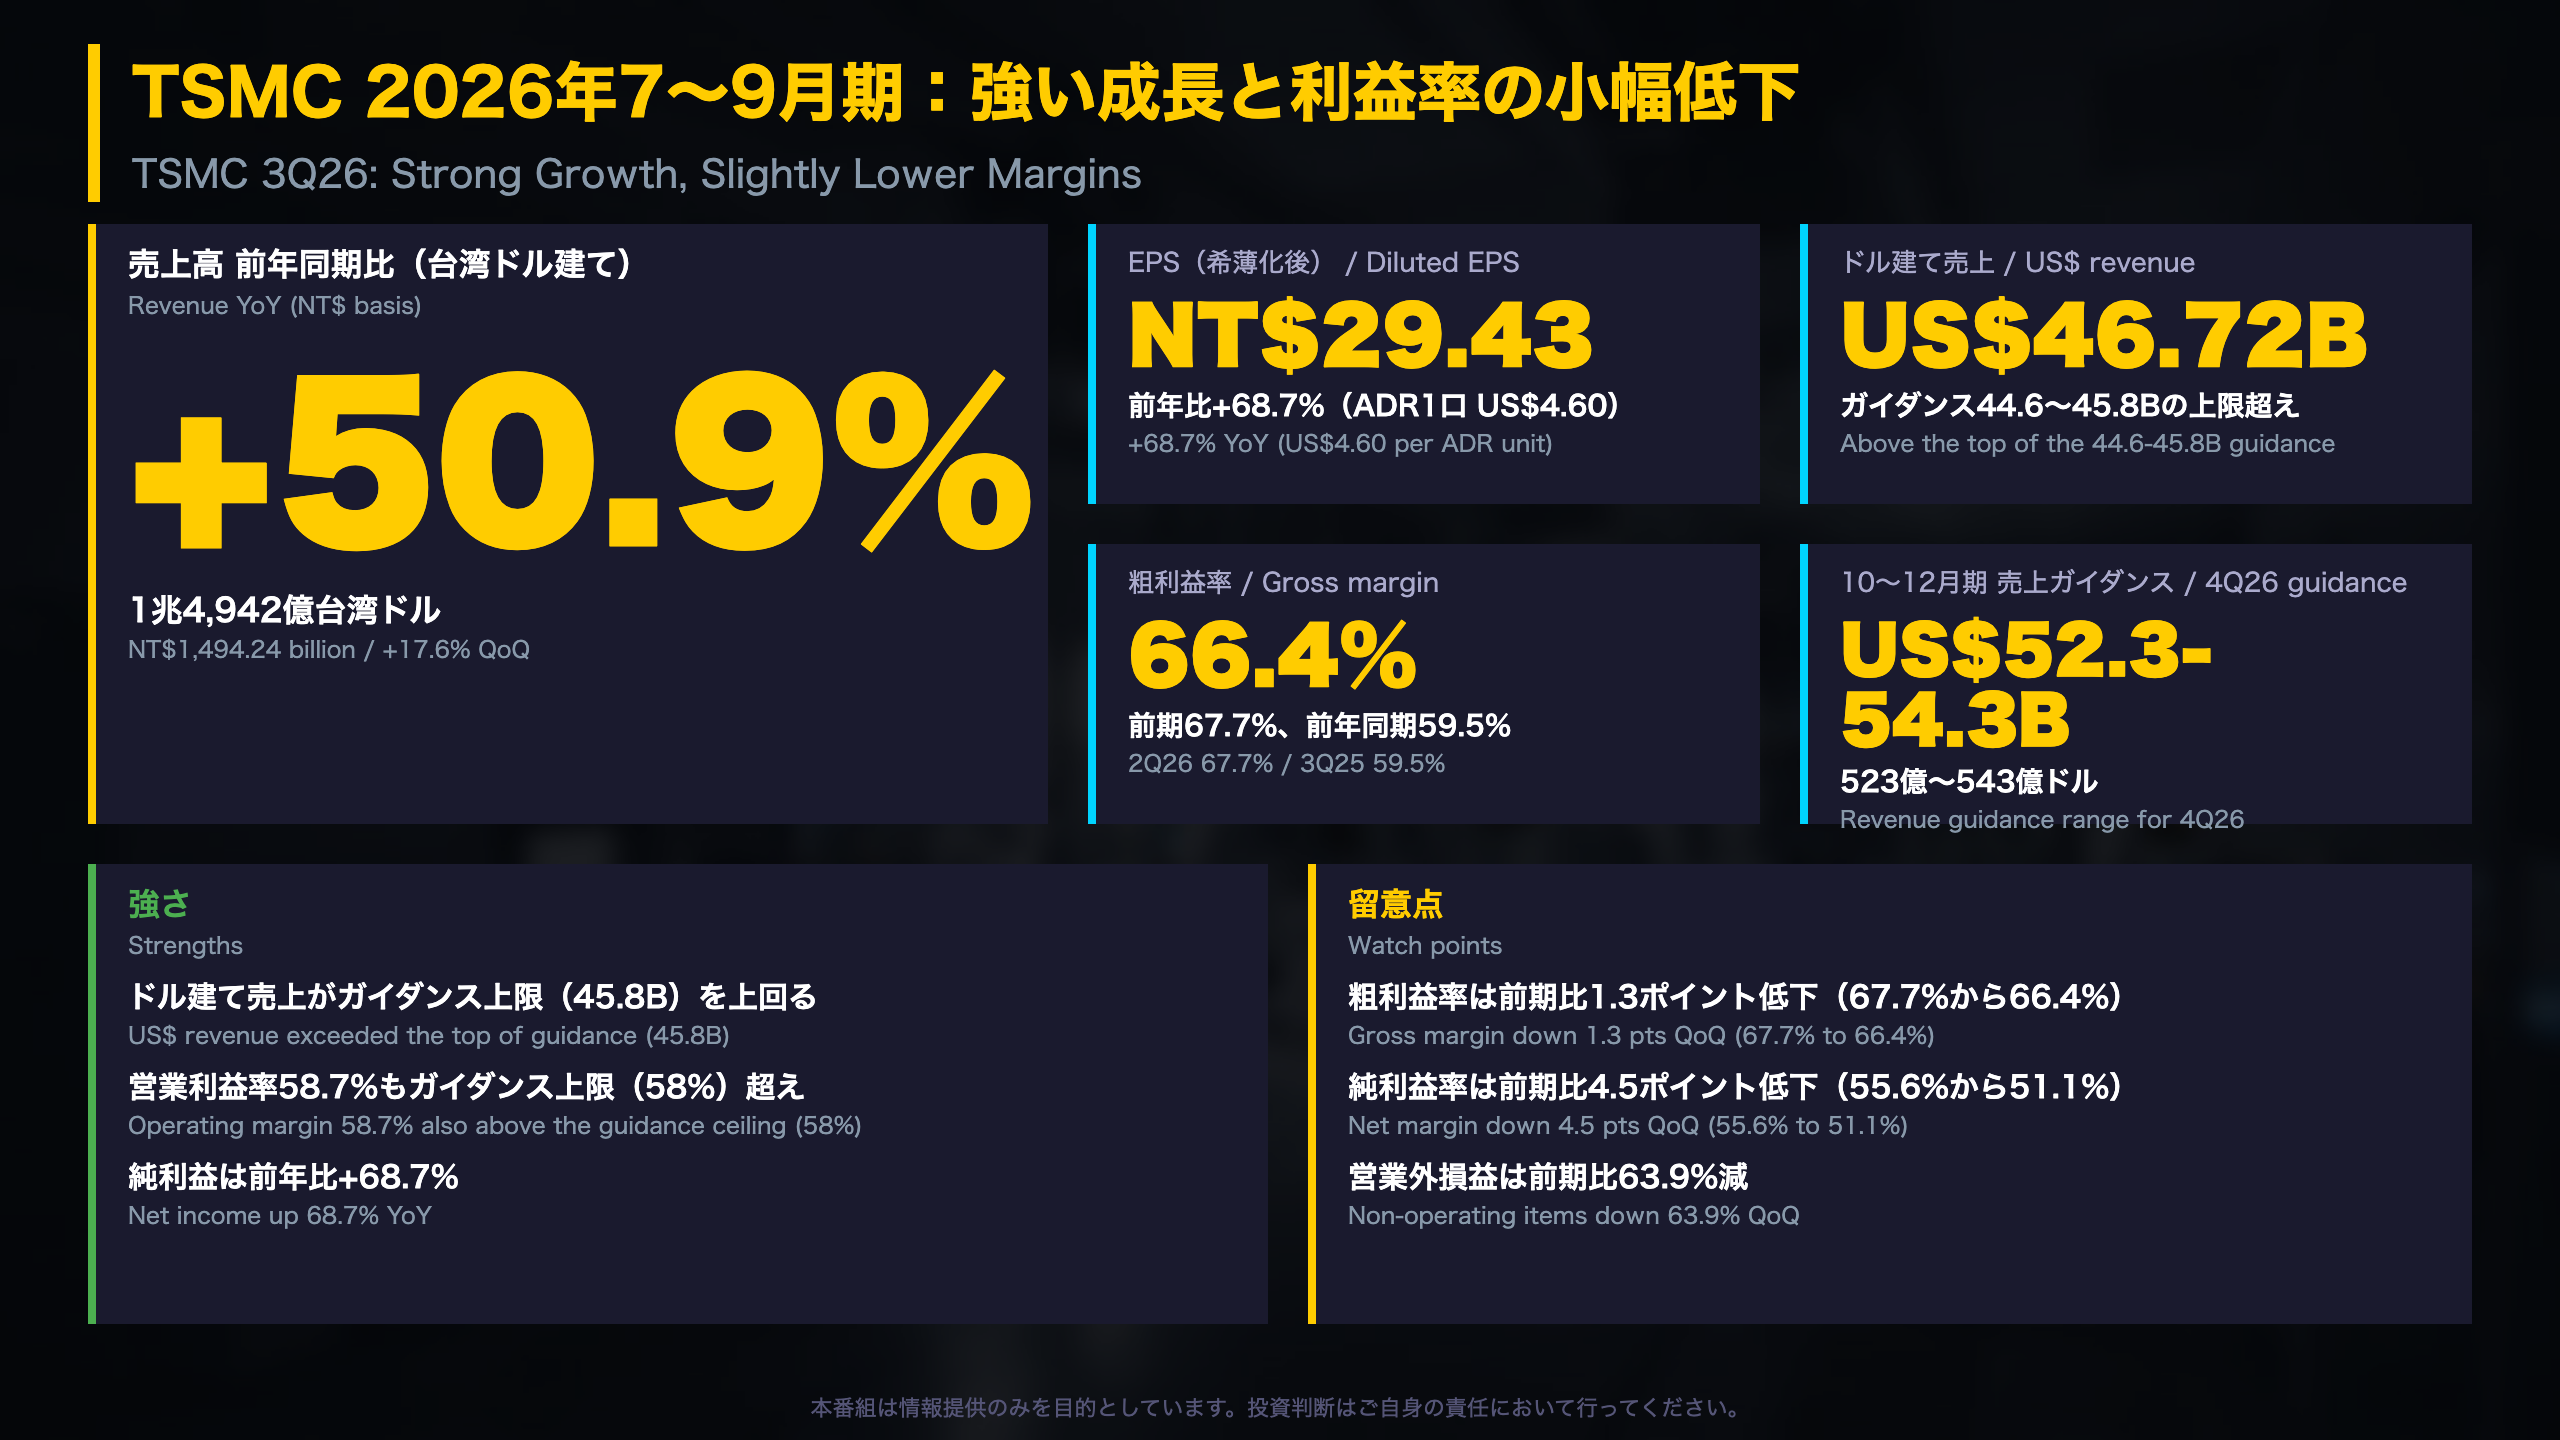
Reading TSMC’s Third-Quarter Report: Context for Non-Specialists
Who reports what. TSMC is Taiwan’s largest listed company (TWSE: 2330) and also trades in New York as an ADR (NYSE: TSM). As a foreign private issuer, it furnishes results to the SEC on Form 6-K and files an annual report on Form 20-F, rather than the 10-Q and 10-K used by US domestic companies. Figures follow TIFRS (Taiwan-adopted IFRS), and the third-quarter numbers had not yet been approved by the board at release.
Why two currencies matter
Headline results are in New Taiwan dollars (NT$), while guidance is issued in US dollars. Revenue grew 50.9% in NT$ terms but 41.2% in US$ terms. The average exchange rate was 31.98 versus 29.91 a year earlier, so currency translation likely accounts for part of the gap.
The profit ladder
- Gross profit: +68.6% year over year
- Operating income: +75.0%
- Net income: +68.7%
Every profit line grew faster than the 50.9% revenue gain.
Comparing with US peers
US companies are usually judged on non-GAAP EPS against analyst consensus. This release contains only TIFRS figures and the company’s own guidance; no consensus comparison appears in the source documents, so this analysis benchmarks against guidance instead: US$ revenue of $46.72 billion versus a $44.6 billion to $45.8 billion range.
What to watch
Fourth-quarter revenue guidance of $52.3 billion to $54.3 billion and a gross-margin range of 65% to 67%. The sequential dip in margins is modest, but it is the main counterweight to an otherwise strong print.
売上の伸びは出荷数量を上回る
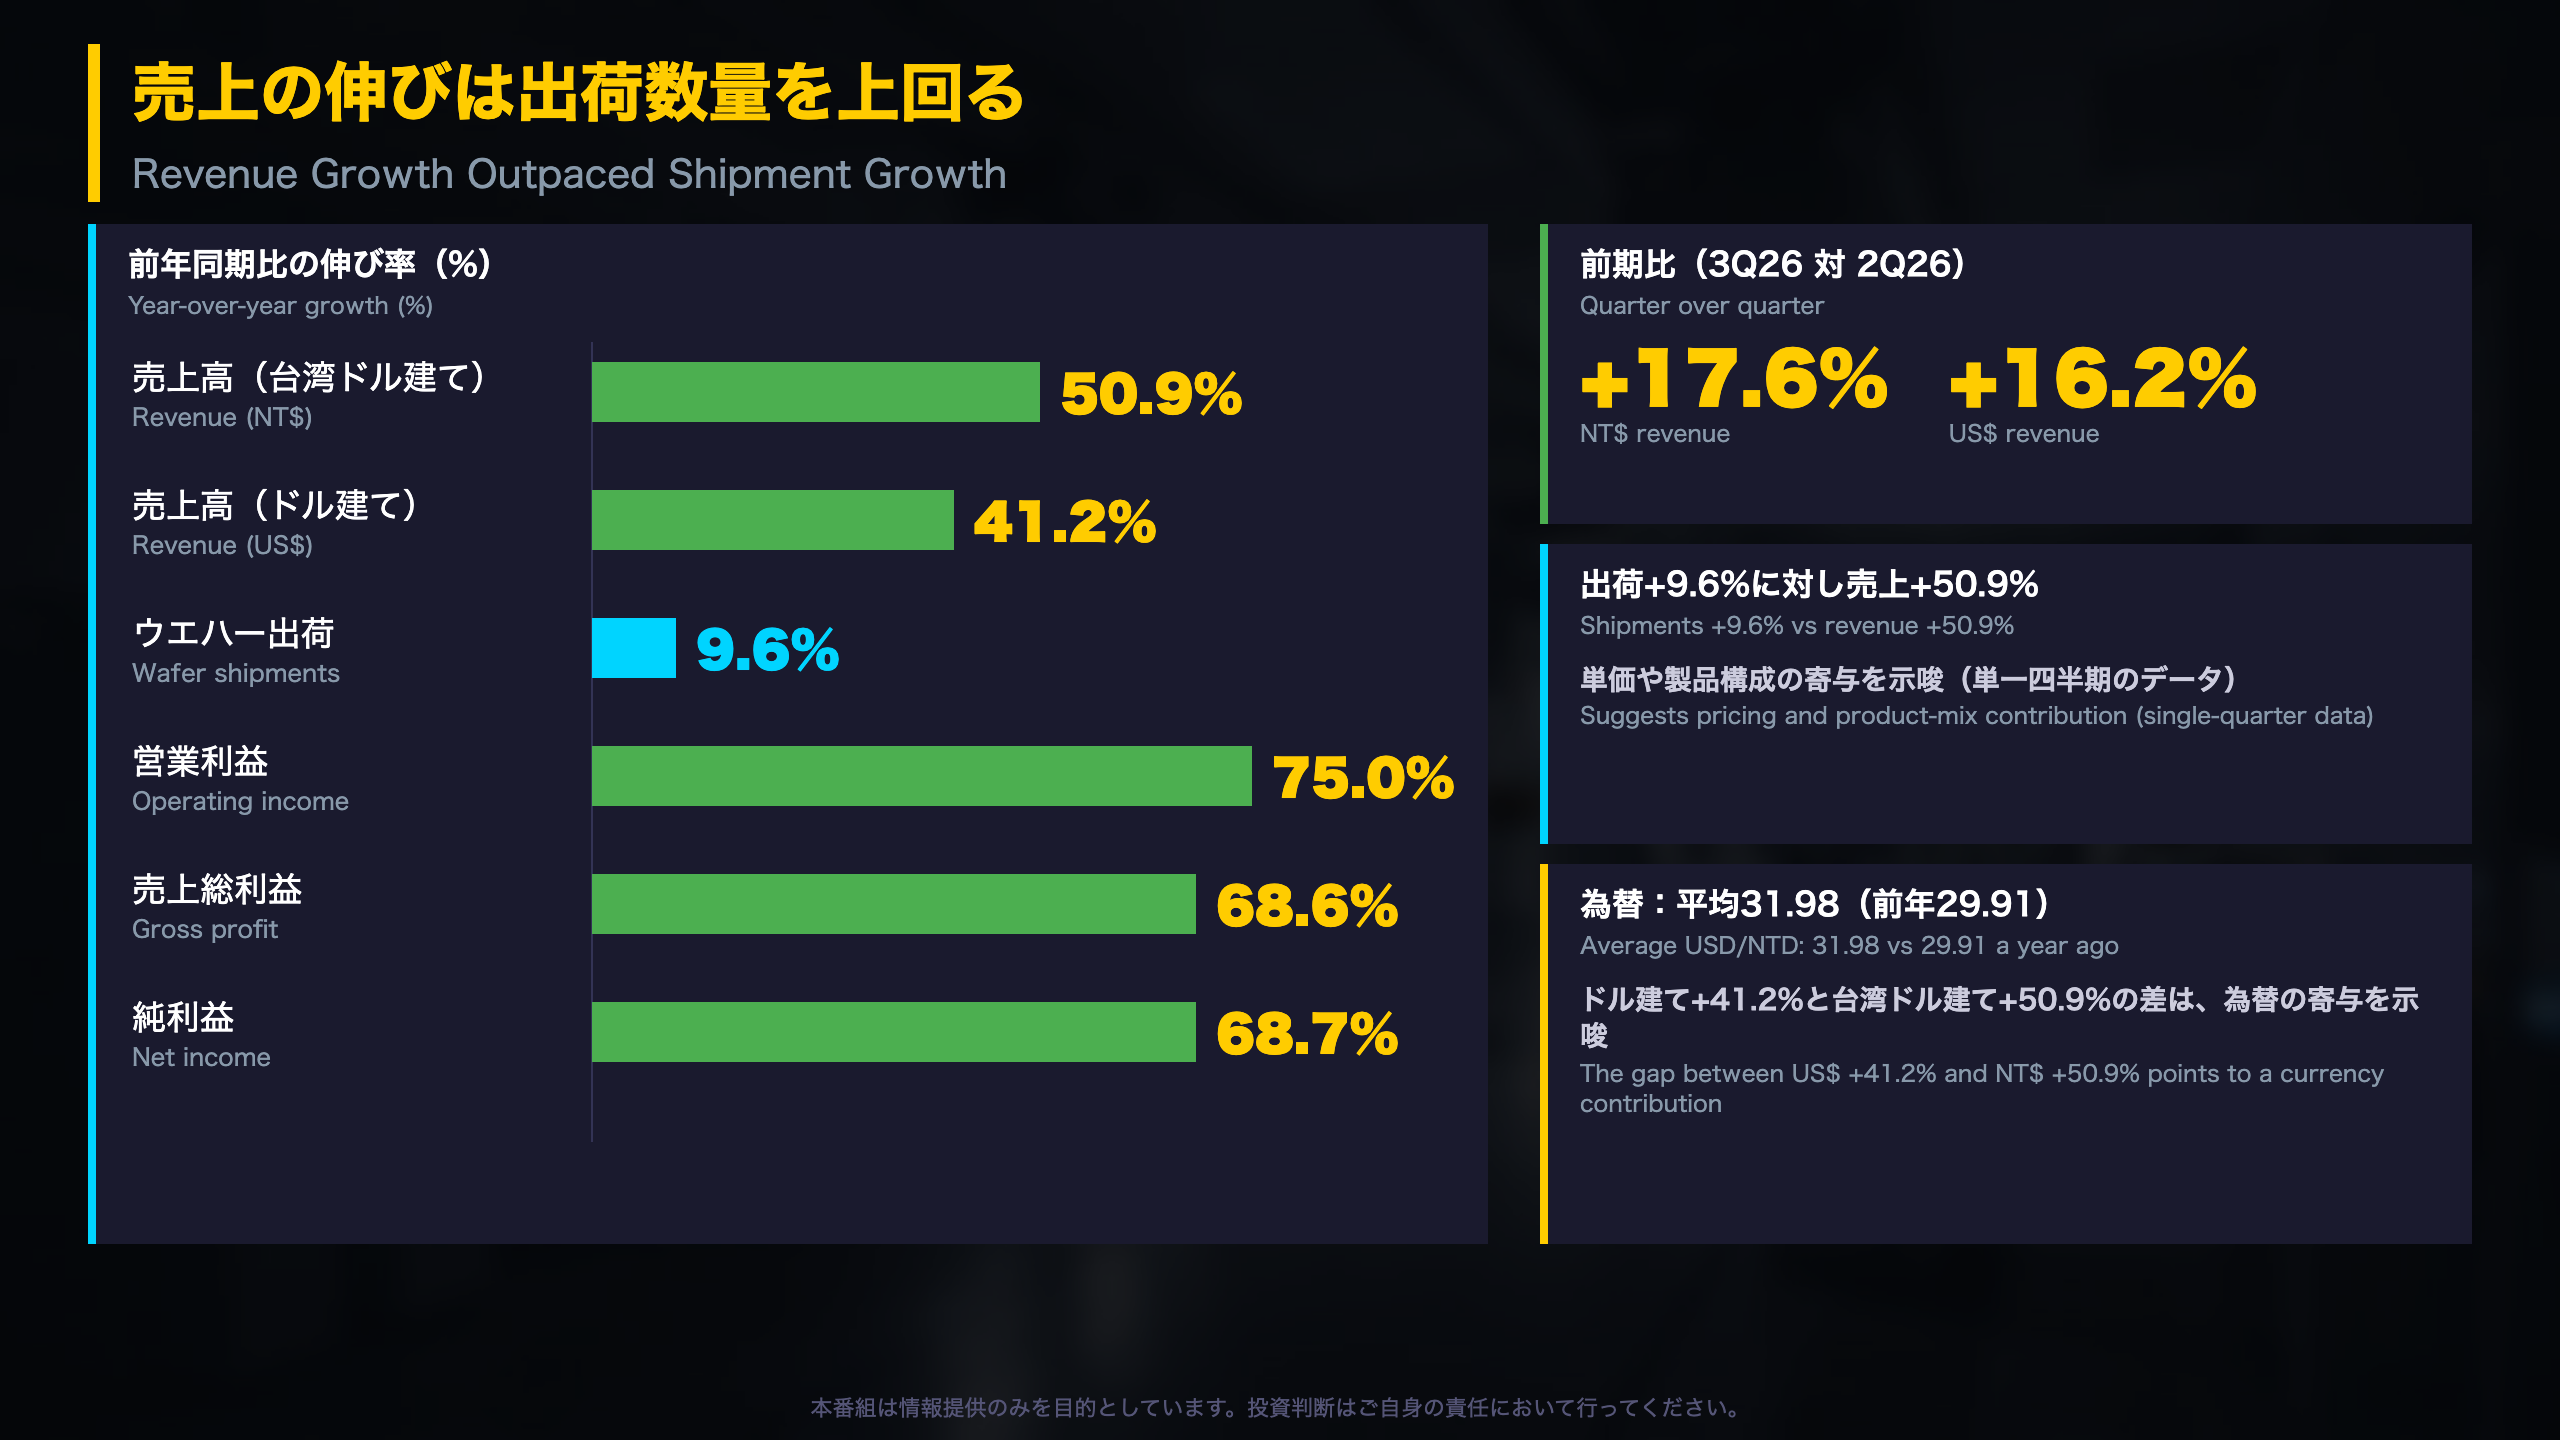
How TSMC Guides, and How Q3 Scored
A guidance-based scorecard. TSMC does not rely on analyst consensus in its release; it publishes quarterly ranges for revenue, gross margin and operating margin, each tied to an explicit exchange-rate assumption. Against the third-quarter ranges, results were:
| Metric | Guidance | Actual |
|---|---|---|
| Revenue (US$) | $44.6-45.8B | $46.72B |
| Gross margin | 65.0%-67.0% | 66.4% |
| Operating margin | 56.0%-58.0% | 58.7% |
| USD/NTD | 32.0 | 31.98 |
Because the actual exchange rate was almost identical to the assumption, the revenue upside is hard to attribute to currency alone.
Volume versus value
Shipments are reported in thousands of 12-inch-equivalent wafers: 4,476K, up 9.6% year over year and 3.2% quarter over quarter. Revenue rose 50.9% (NT$) over the same year-over-year period. That gap suggests higher revenue per wafer, consistent with a richer technology mix, though the release gives no price or per-node detail, so this is an inference from a single quarter.
Currency lens
The NT$ weakened from 29.91 to 31.98 per US dollar year over year, which helps explain why NT$ growth (50.9%) exceeds US$ growth (41.2%).
Full-year marker
Management expects 2026 revenue to grow around 44% in US dollar terms, a figure to track as each quarterly print arrives.
利益率:前期比で小幅低下、前年比では大幅改善
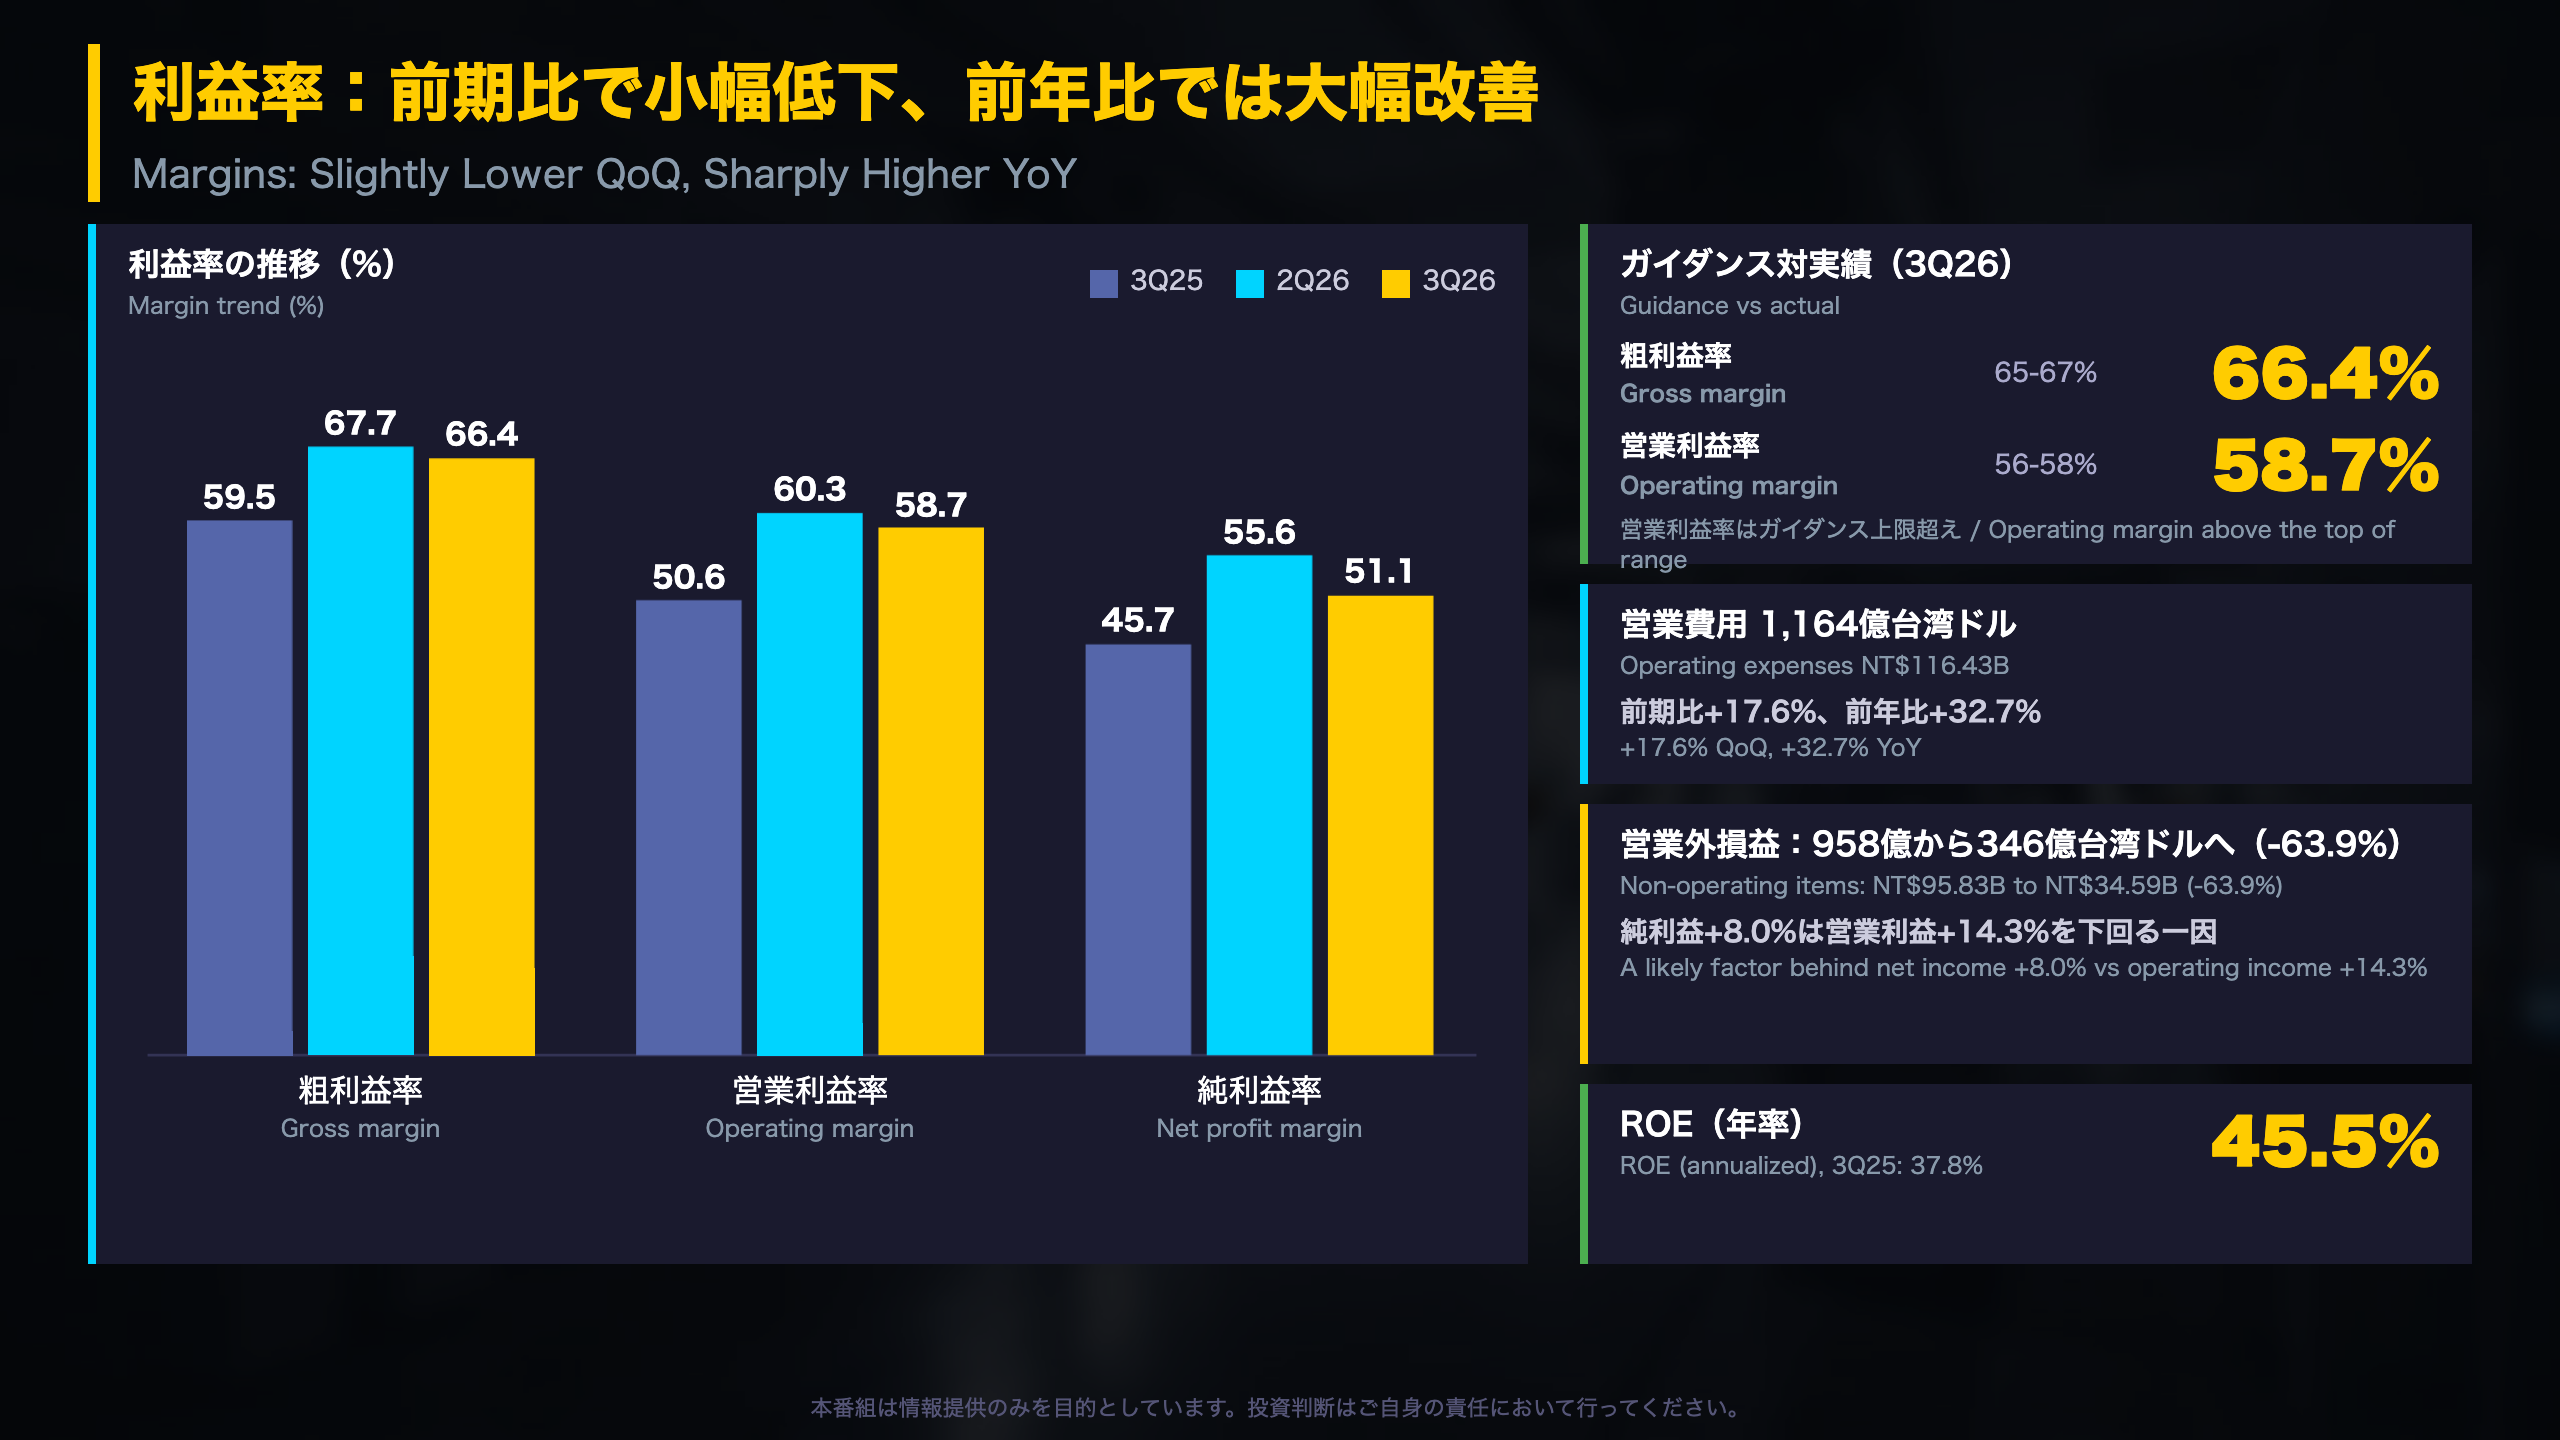
Margin Anatomy: What Moved and What Did Not
Three layers of margin. Gross margin measures revenue less cost of sales; operating margin also deducts operating expenses; net profit margin is after non-operating items and taxes. Looking at all three shows where the quarter-on-quarter change came from.
| Metric | 3Q25 | 2Q26 | 3Q26 |
|---|---|---|---|
| Gross margin | 59.5% | 67.7% | 66.4% |
| Operating margin | 50.6% | 60.3% | 58.7% |
| Net profit margin | 45.7% | 55.6% | 51.1% |
| ROE (annualized) | 37.8% | 45.9% | 45.5% |
Sequential versus annual
Sequentially, gross margin fell 1.3 points and operating margin 1.6 points, while net margin fell 4.5 points. The extra decline in net margin lines up with non-operating items shrinking from NT$95.83 billion to NT$34.59 billion. The release does not break these items out, so the cause cannot be identified from the documents alone. Year over year, gross margin is up 6.9 points and operating margin 8.1 points.
Against guidance
Gross margin (66.4%) landed inside the 65%-67% range, and operating margin (58.7%) cleared the top of the 56%-58% range. For the fourth quarter, management guides gross margin to 65%-67% and operating margin to 56.5%-58.5% at 31.8 NT dollars per US dollar.
Balanced read
The sequential dip is real but small relative to the level, and the annual gains are large. The metric to watch is whether the fourth-quarter operating margin stays near the top of its 56.5%-58.5% range.
キャッシュ創出力の拡大と、積み上がる在庫
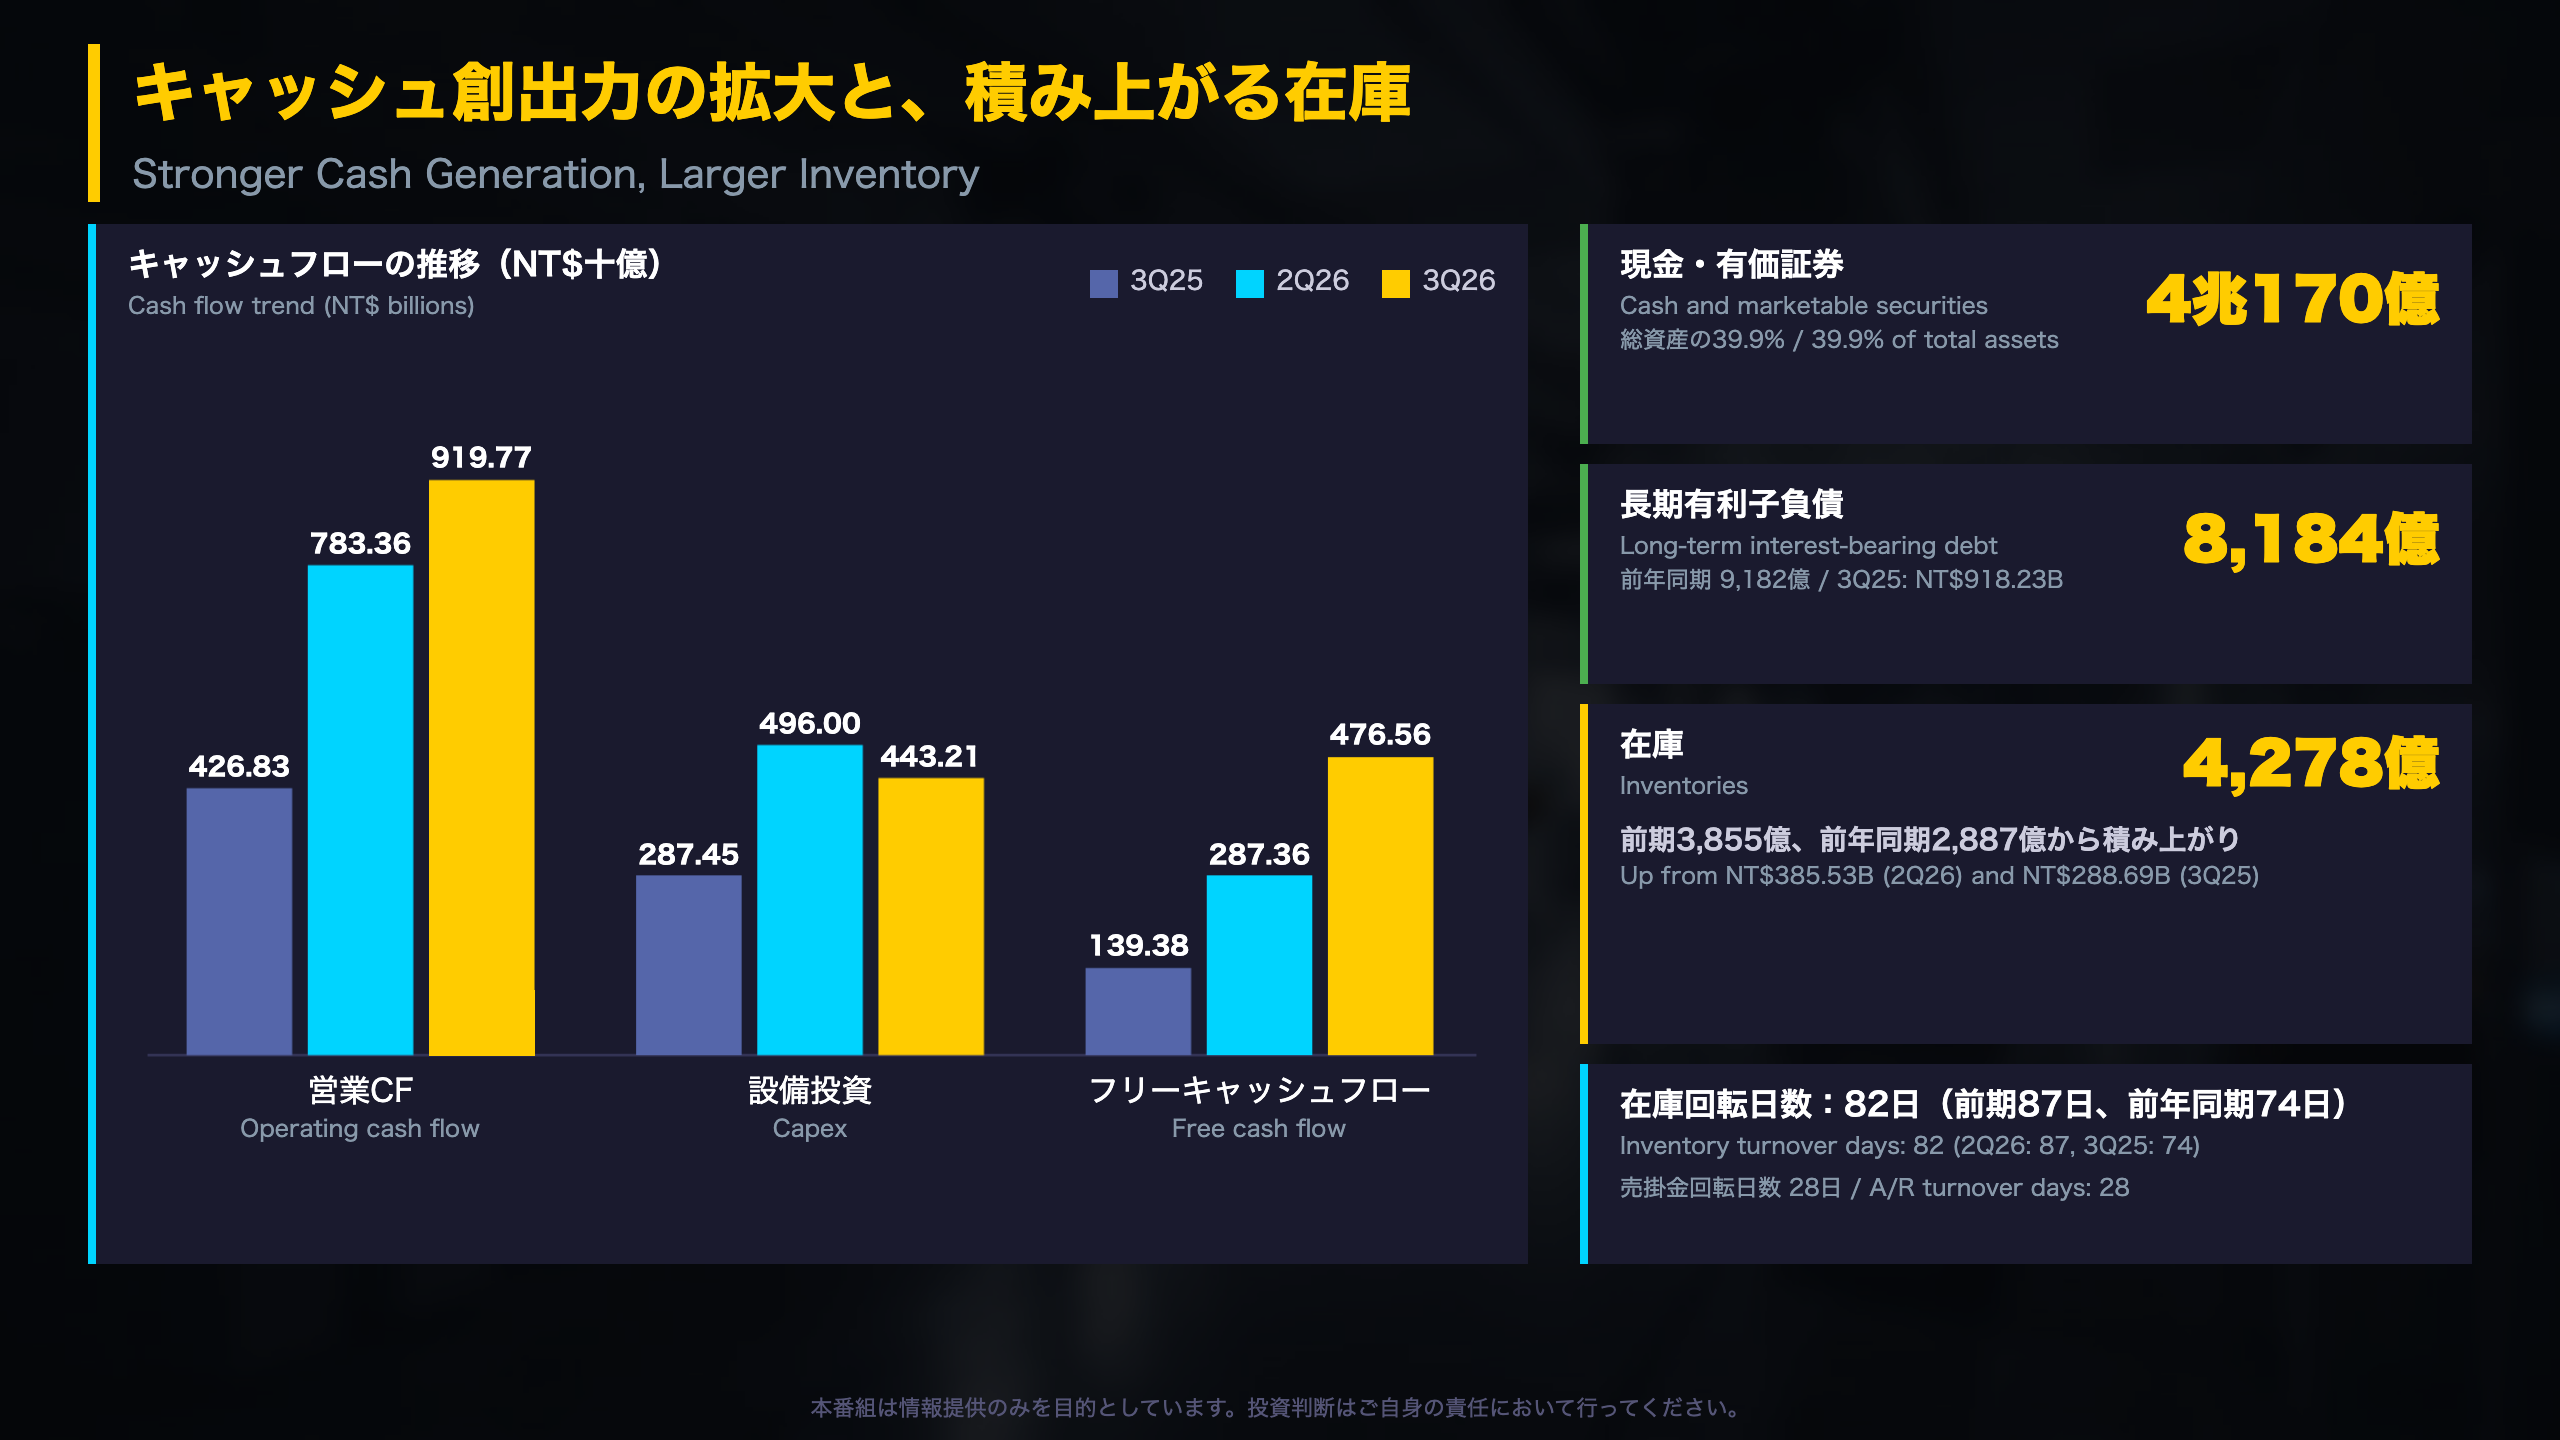
Cash Flow and Balance Sheet: A Closer Look
How to read the numbers. The deck defines free cash flow as cash from operating activities minus capital expenditures. On that definition, third-quarter free cash flow was NT$476.56 billion against NT$287.36 billion in the second quarter and NT$139.38 billion a year earlier.
| NT$ billions | 3Q26 | 2Q26 | 3Q25 |
|---|---|---|---|
| Operating cash flow | 919.77 | 783.36 | 426.83 |
| Capex | 443.21 | 496.00 | 287.45 |
| Free cash flow | 476.56 | 287.36 | 139.38 |
| Cash dividends paid | 155.59 | 155.59 | 116.70 |
Capital intensity
Capex remains large in absolute terms, at NT$443.21 billion versus NT$287.45 billion a year ago, even though it dipped from the prior quarter. Operating cash flow covered capex roughly twice in the quarter, which is why free cash flow expanded.
Balance-sheet quality
Total assets were NT$10,052.89 billion with shareholders’ equity at 70.1% of the total. The current ratio was 2.6x and long-term interest-bearing debt fell to NT$818.38 billion from NT$918.23 billion a year earlier.
Two definitions of cash
The cash-flow statement shows an ending balance of NT$3,621.89 billion, while the balance sheet shows NT$4,016.98 billion of cash and marketable securities; the latter includes securities outside the cash-flow definition.
Inventory watch
Inventory rose to NT$427.75 billion, but turnover days improved to 82 from 87. The documents do not explain the build, so it is best treated as an item to monitor rather than a conclusion.
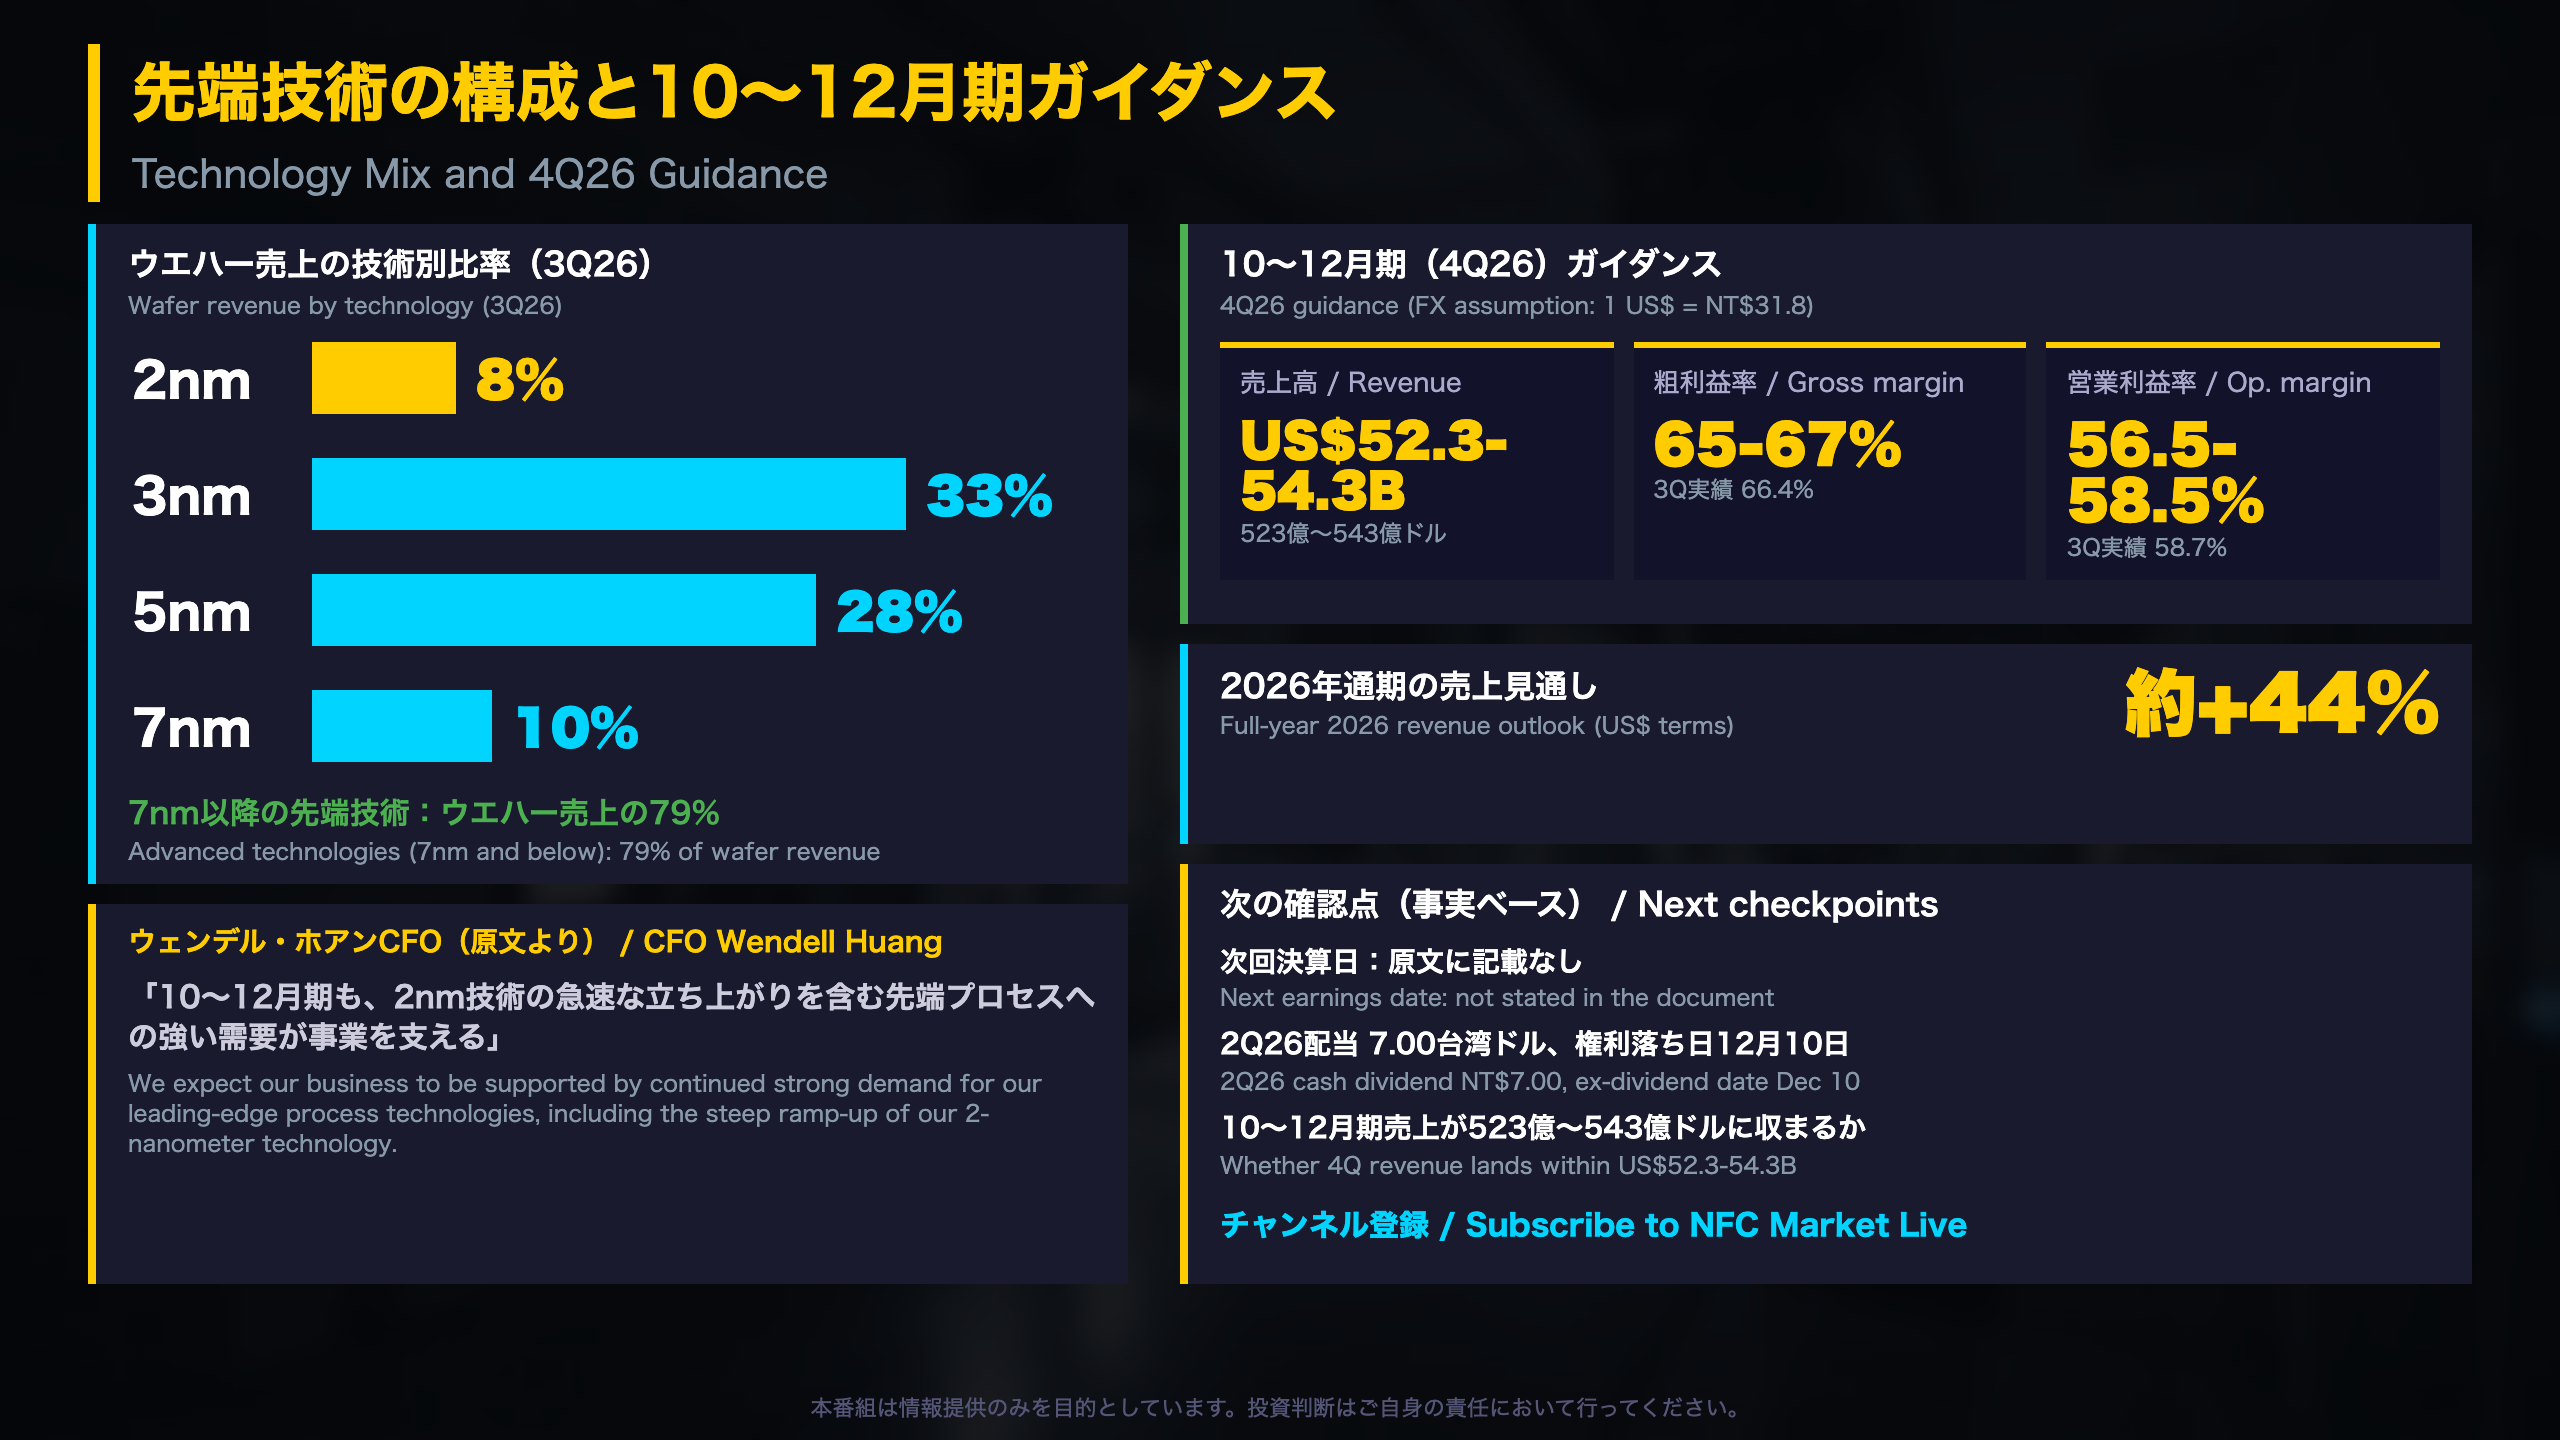
先端技術の構成と10〜12月期ガイダンス
The Fourth-Quarter Outlook and Recent Corporate Events
What the guidance says. For 4Q26, TSMC guides revenue to $52.3-$54.3 billion, gross margin to 65%-67% and operating margin to 56.5%-58.5%, assuming 31.8 NT dollars per US dollar. Management also expects 2026 revenue to grow around 44% in US dollar terms.
| 4Q26 guidance | 3Q26 actual | |
|---|---|---|
| Revenue | $52.3-54.3B | $46.72B |
| Gross margin | 65%-67% | 66.4% |
| Operating margin | 56.5%-58.5% | 58.7% |
Technology mix
7-nanometer and more advanced nodes accounted for 79% of wafer revenue (2nm 8%, 3nm 33%, 5nm 28%, 7nm 10%). The release does not give prior-period mix, so the pace of the 2-nanometer ramp can only be tracked in future reports. The CFO referred to the “steep ramp-up” of 2-nanometer technology in the outlook.
Recent events cited
- Sept. 8: ASML and TSMC announced an initiative on large-format photomasks for High NA EUV
- Aug. 11: Sony Semiconductor Solutions and TSMC agreed to form a joint venture for next-generation image sensors
- Aug. 11: Board approved a NT$7.00 cash dividend for 2Q26; ex-dividend Dec. 10, payment Jan. 7, 2027
Balanced read
The guided revenue range sits above the 3Q result, while the guided margin ranges bracket 3Q levels rather than extending them. The next earnings date is not stated in the filing; the practical checkpoint is whether fourth-quarter revenue lands within the guided range.
Disclaimer: This article is for informational purposes only. All investment decisions are made solely at your own risk.