📺 Watch the Full Video Analysis
This article was automatically generated by the NFC Market Live AI analysis system. (Updated: 2026-10-30 05:28 JST)
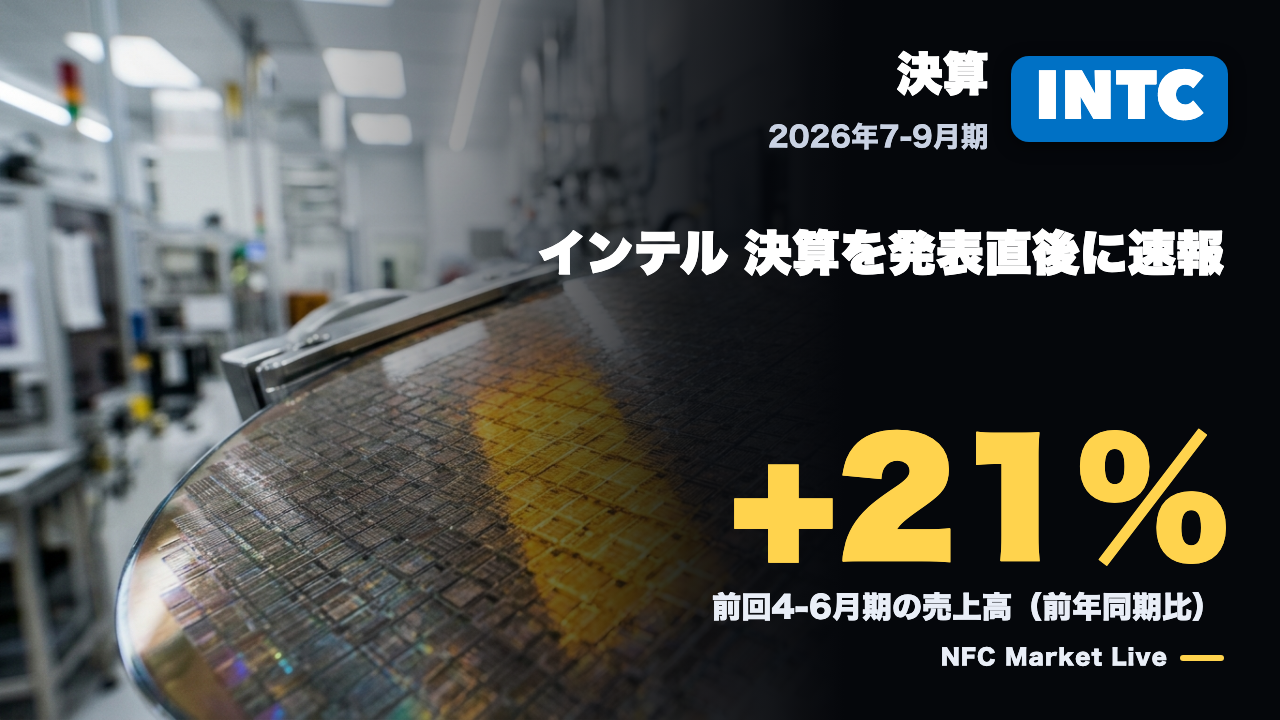
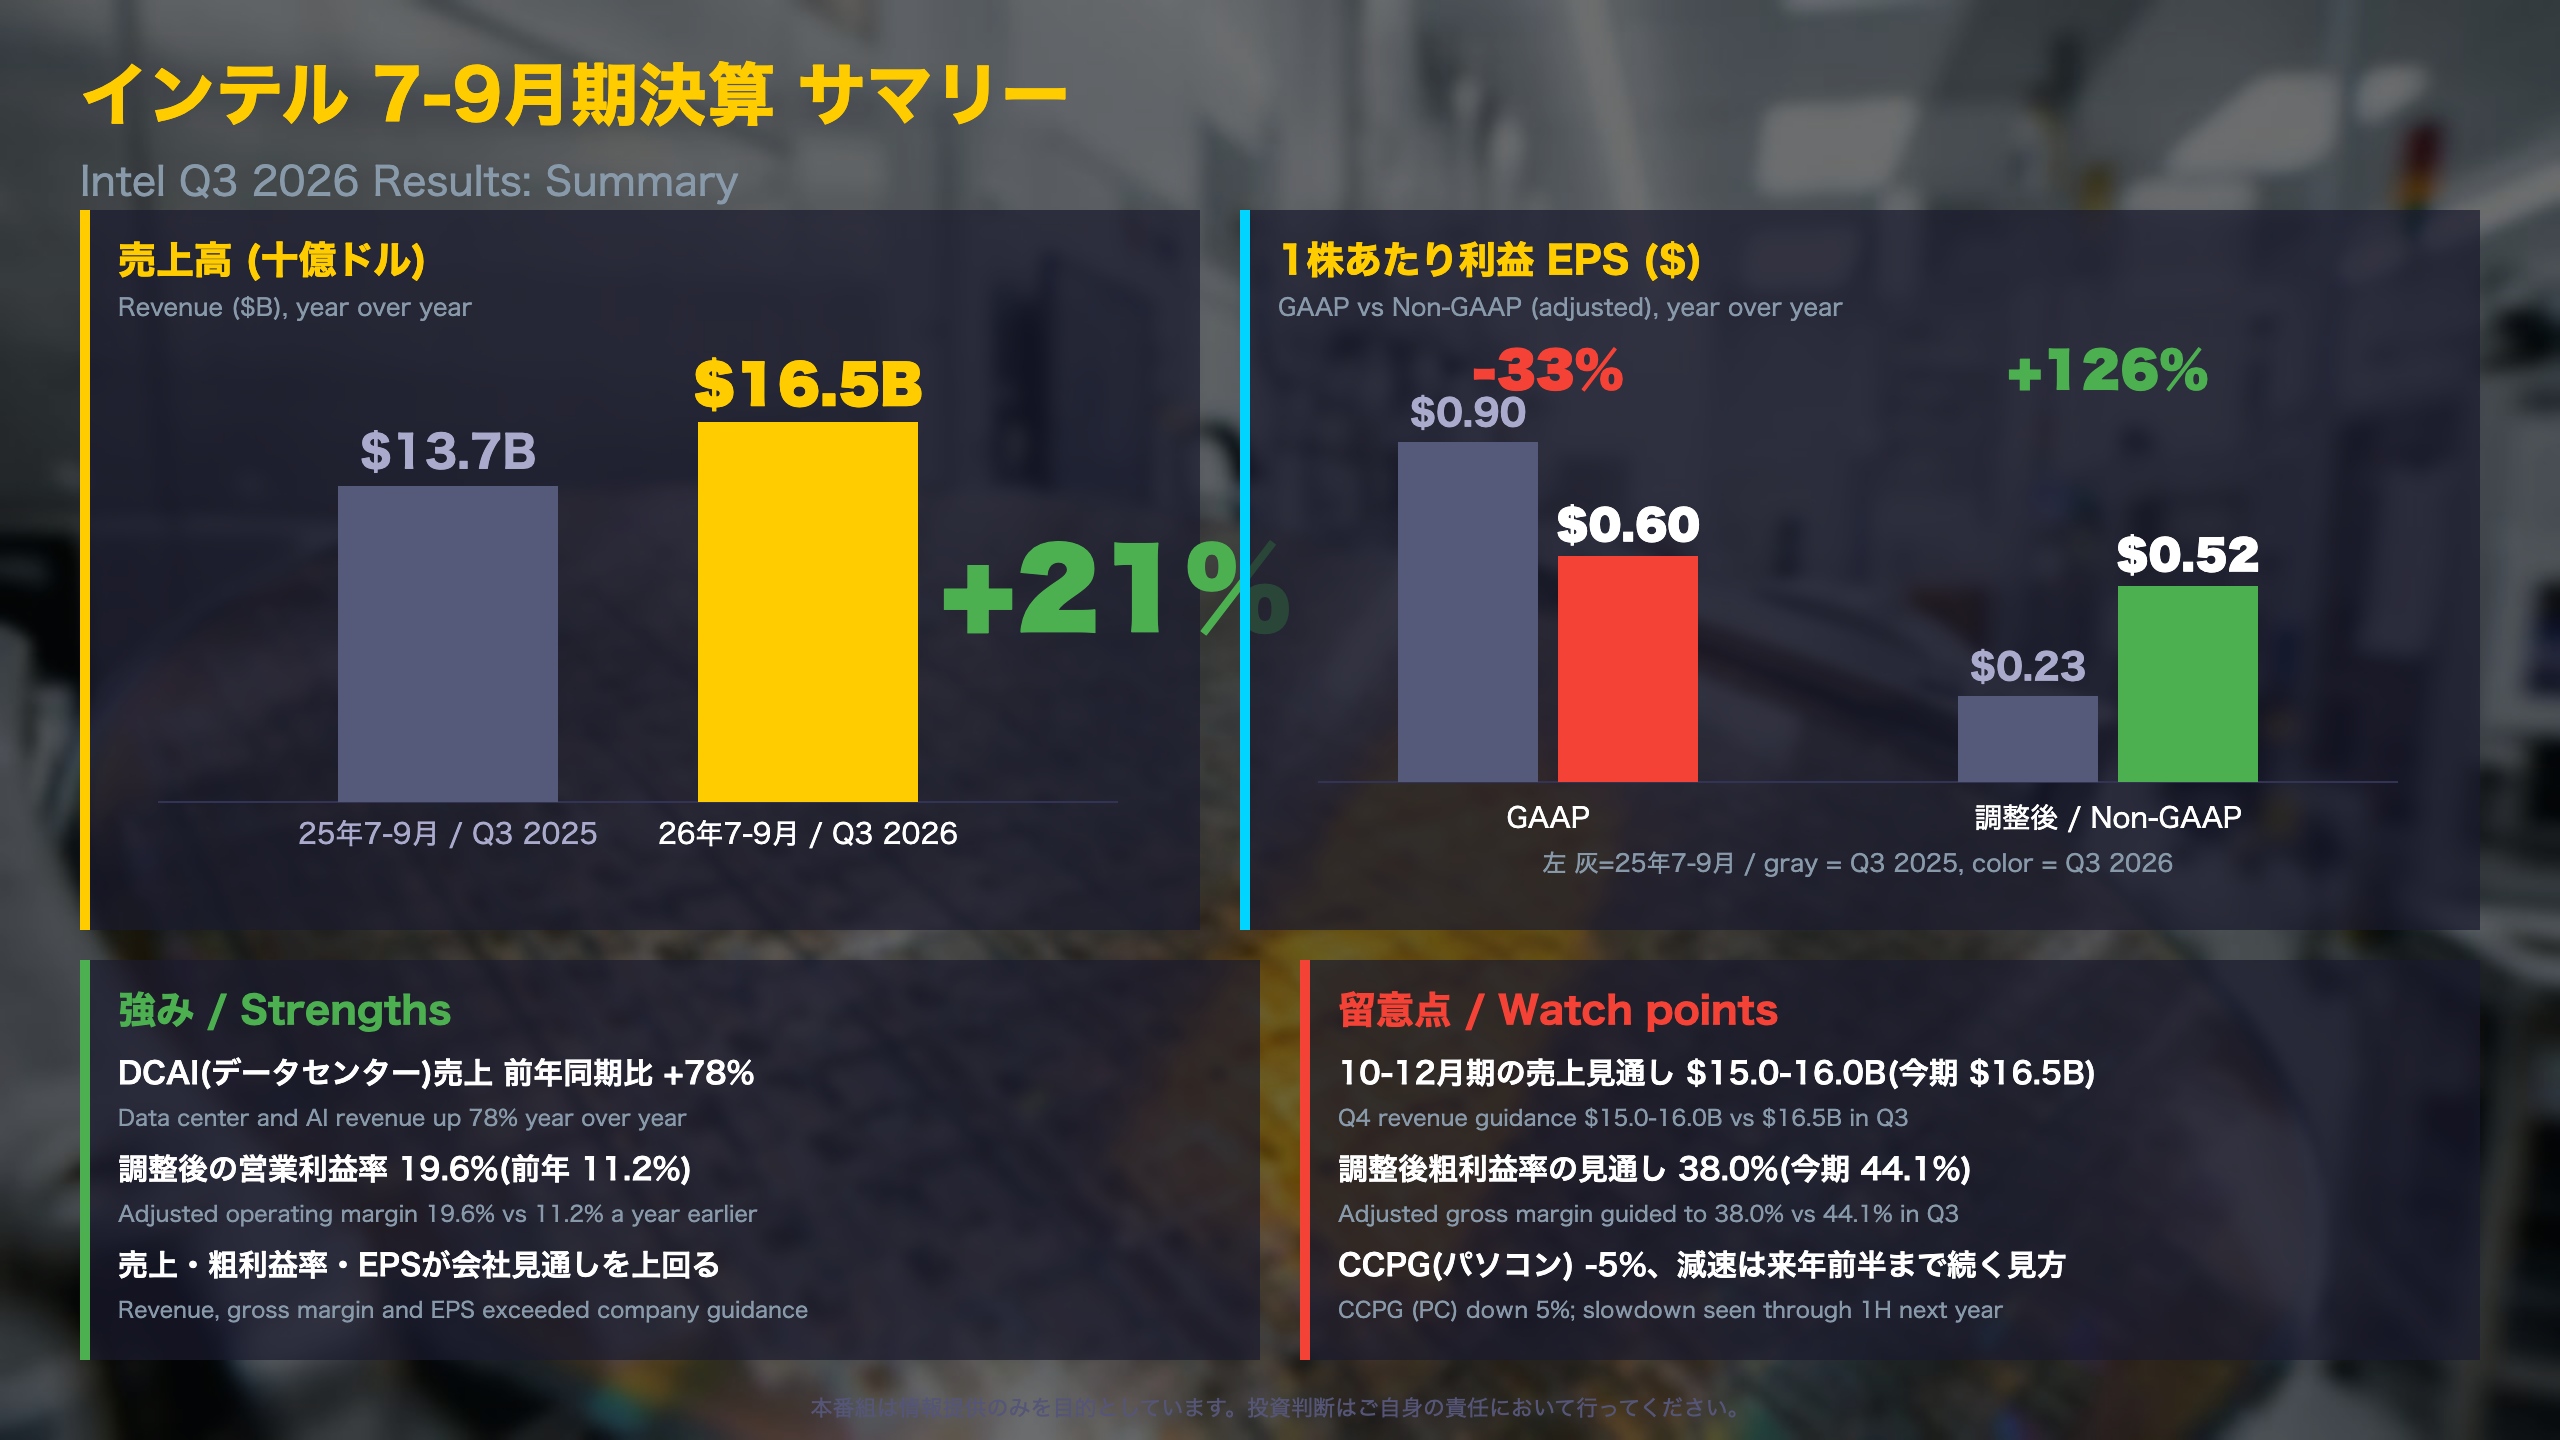
📊 Intel reported Q3 2026 results: revenue of $16.5B, up 21% YoY, with data center (DCAI) up 78% to $7.3B.
📈 Adjusted EPS was $0.52 vs $0.23 a year earlier, and adjusted operating margin rose to 19.6% from 11.2%.
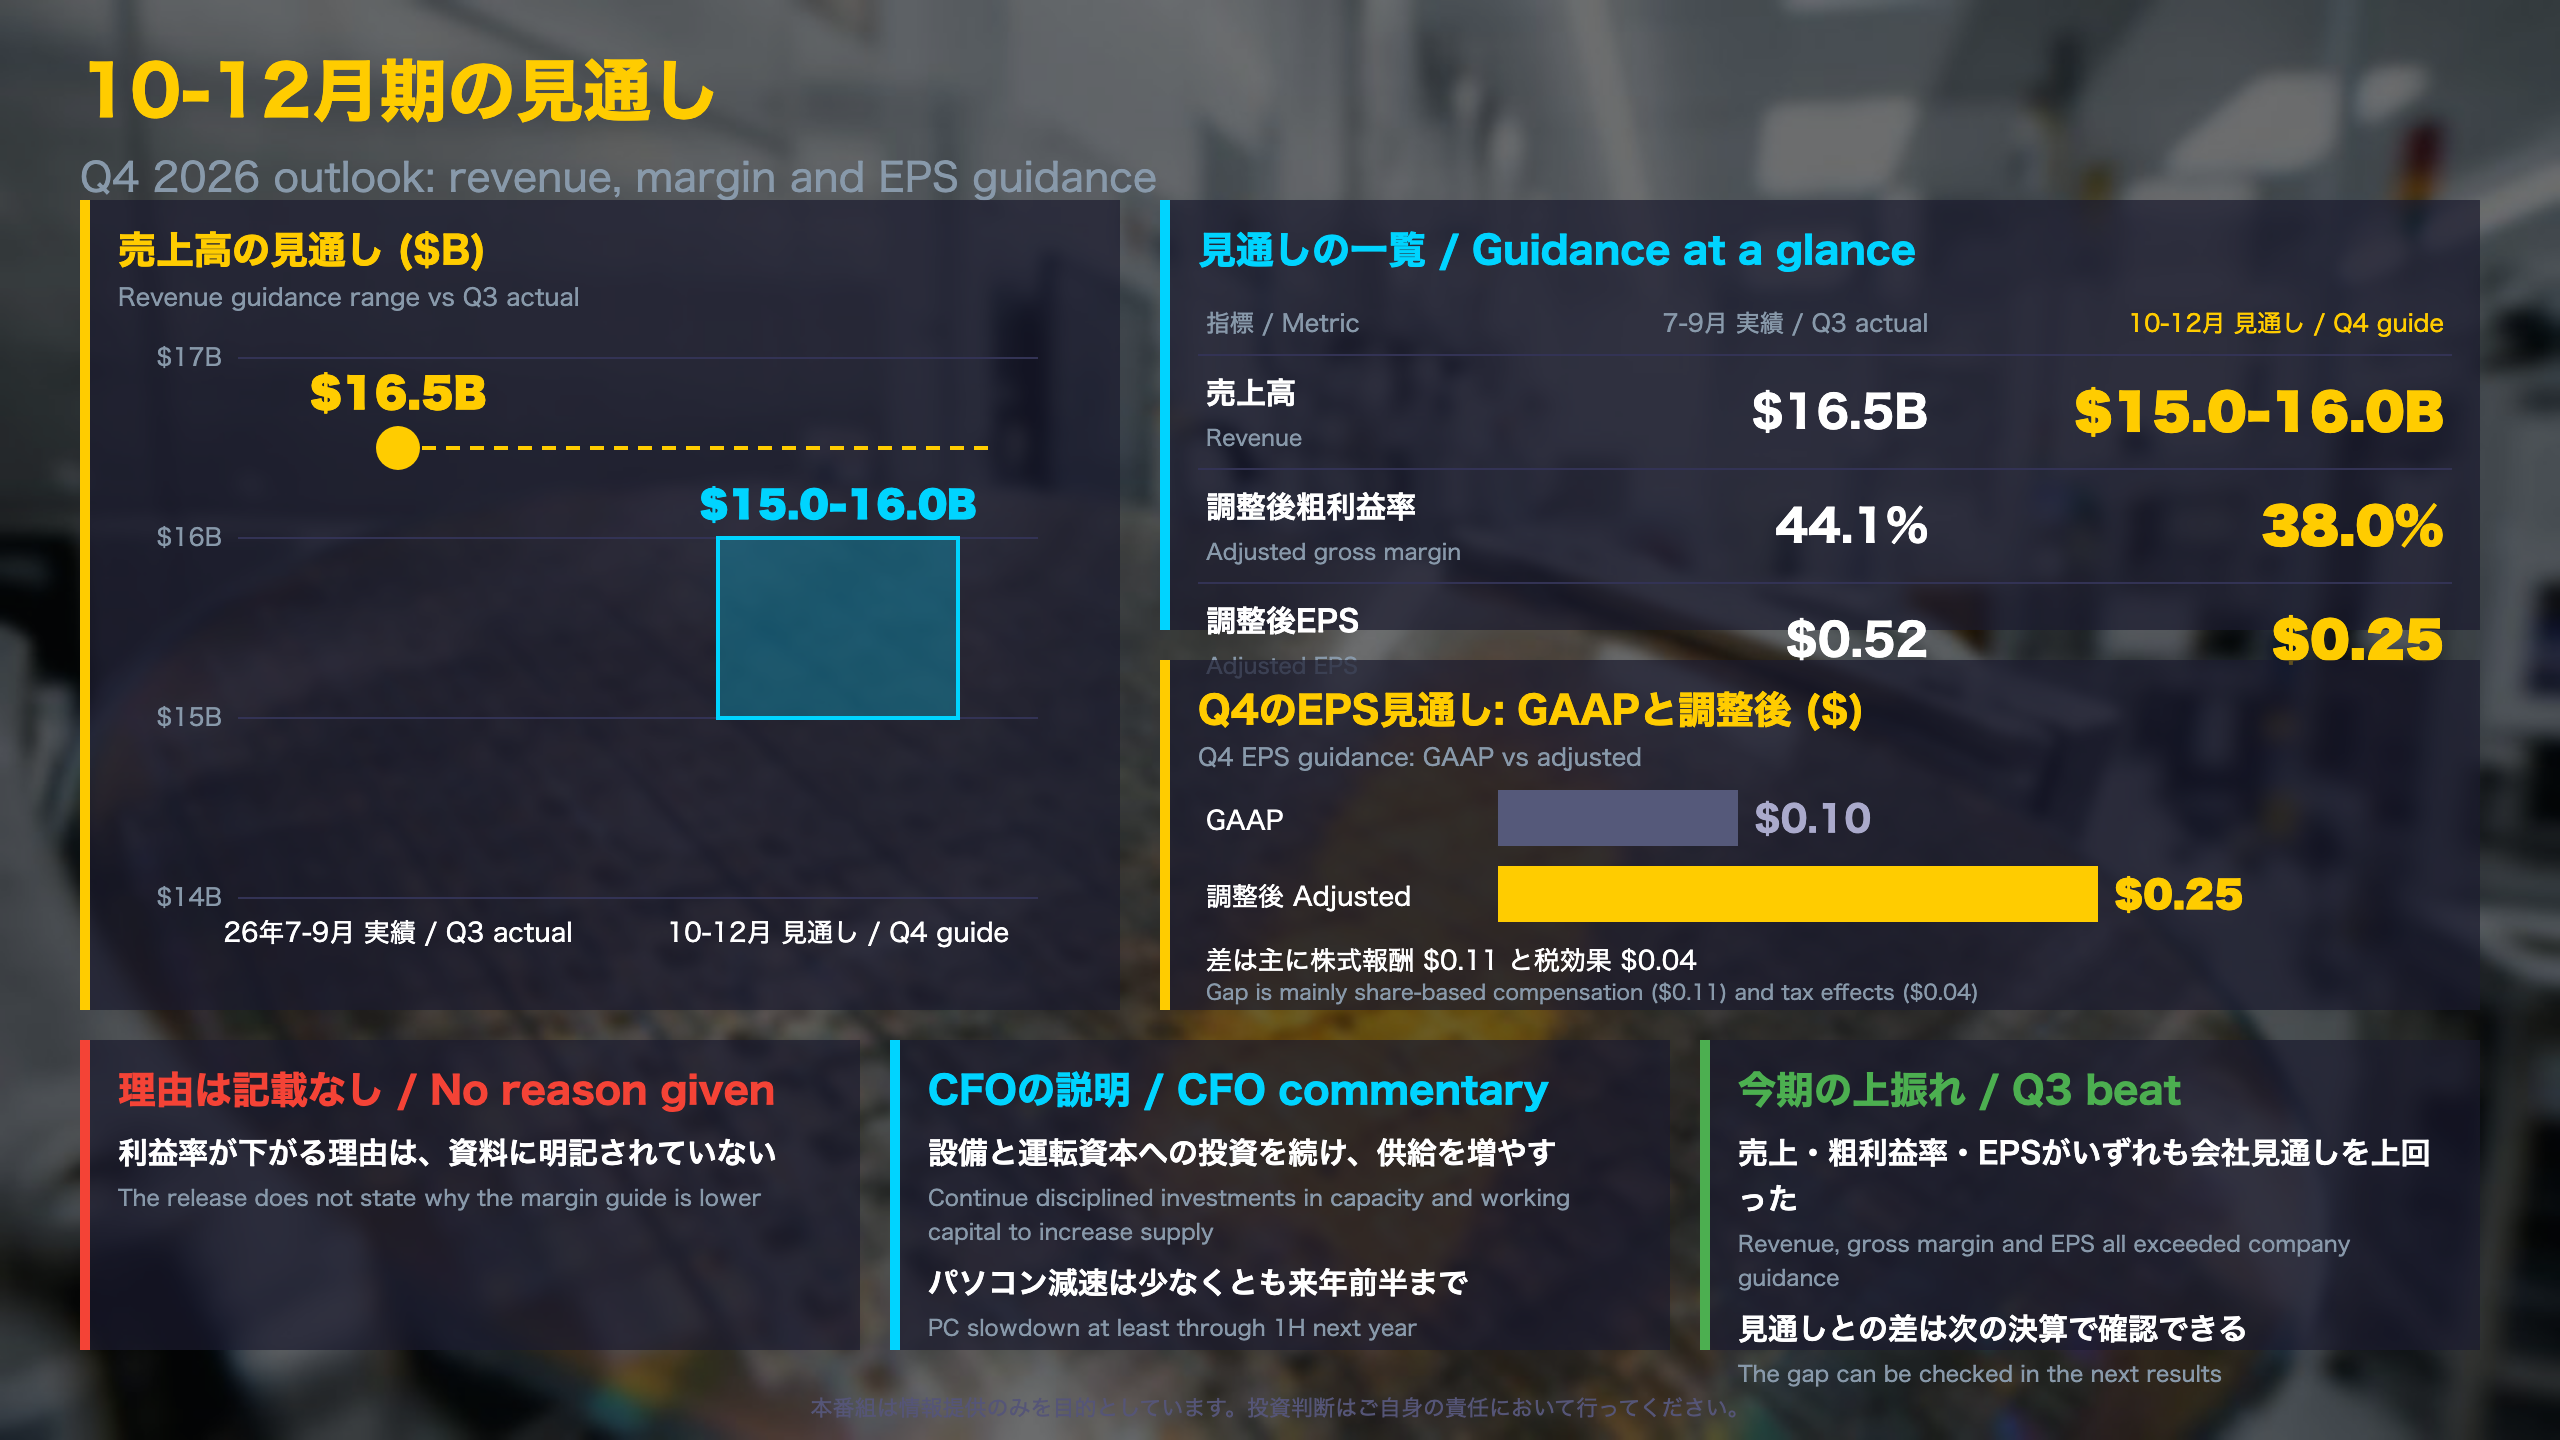
⚠️ Q4 guidance: revenue of $15.0-16.0B, below Q3, and adjusted gross margin of 38.0%. The CFO expects the PC slowdown to last at least through 1H next year.
💡 Why GAAP and adjusted EPS diverge, and how to read both the strengths and the caution, explained with the filing’s data.
サマリー: インテル7-9月期決算
What Intel reported
Intel (Nasdaq: INTC) designs x86 processors and also runs a contract chip-manufacturing arm, Intel Foundry. Q3 2026 revenue was $16.5 billion, up 21% year over year, and non-GAAP gross margin was 44.1% versus 40.0% a year earlier.
GAAP versus non-GAAP
U.S. companies report GAAP figures under accounting rules, plus an adjusted set that strips out items management views as non-core. Intel’s non-GAAP EPS was $0.52 versus $0.23, while GAAP EPS was $0.60 versus $0.90. The gap reflects a valuation gain of roughly $1.0 billion on escrowed shares tied to the U.S. government’s CHIPS Act agreement this year, and a large divestiture gain in the year-earlier quarter.
Cash and balance sheet
Operating cash flow was $5.1 billion and adjusted free cash flow was $1.64 billion (vs $0.90 billion). Intel completed a $23 billion public equity offering, and diluted shares rose to 5,307 million from 4,531 million.
Two readings
- Constructive: revenue, gross margin and EPS exceeded guidance, and the CFO called data center growth the strongest in 15 years.
- Cautious: Q4 guidance of $15.0-16.0 billion revenue, 38.0% non-GAAP gross margin and $0.25 non-GAAP EPS is below this quarter on each measure, and the CFO sees the PC slowdown lasting at least through 1H next year.
Context for global readers
Unlike many Japanese companies, whose fiscal years often end in March, Intel reports on a calendar year and issues guidance one quarter ahead, which is why the Q4 ranges matter. This note is not a forecast; the next check is Q4 results versus the guided ranges.
深掘り1: データセンターが牽引
Segment economics
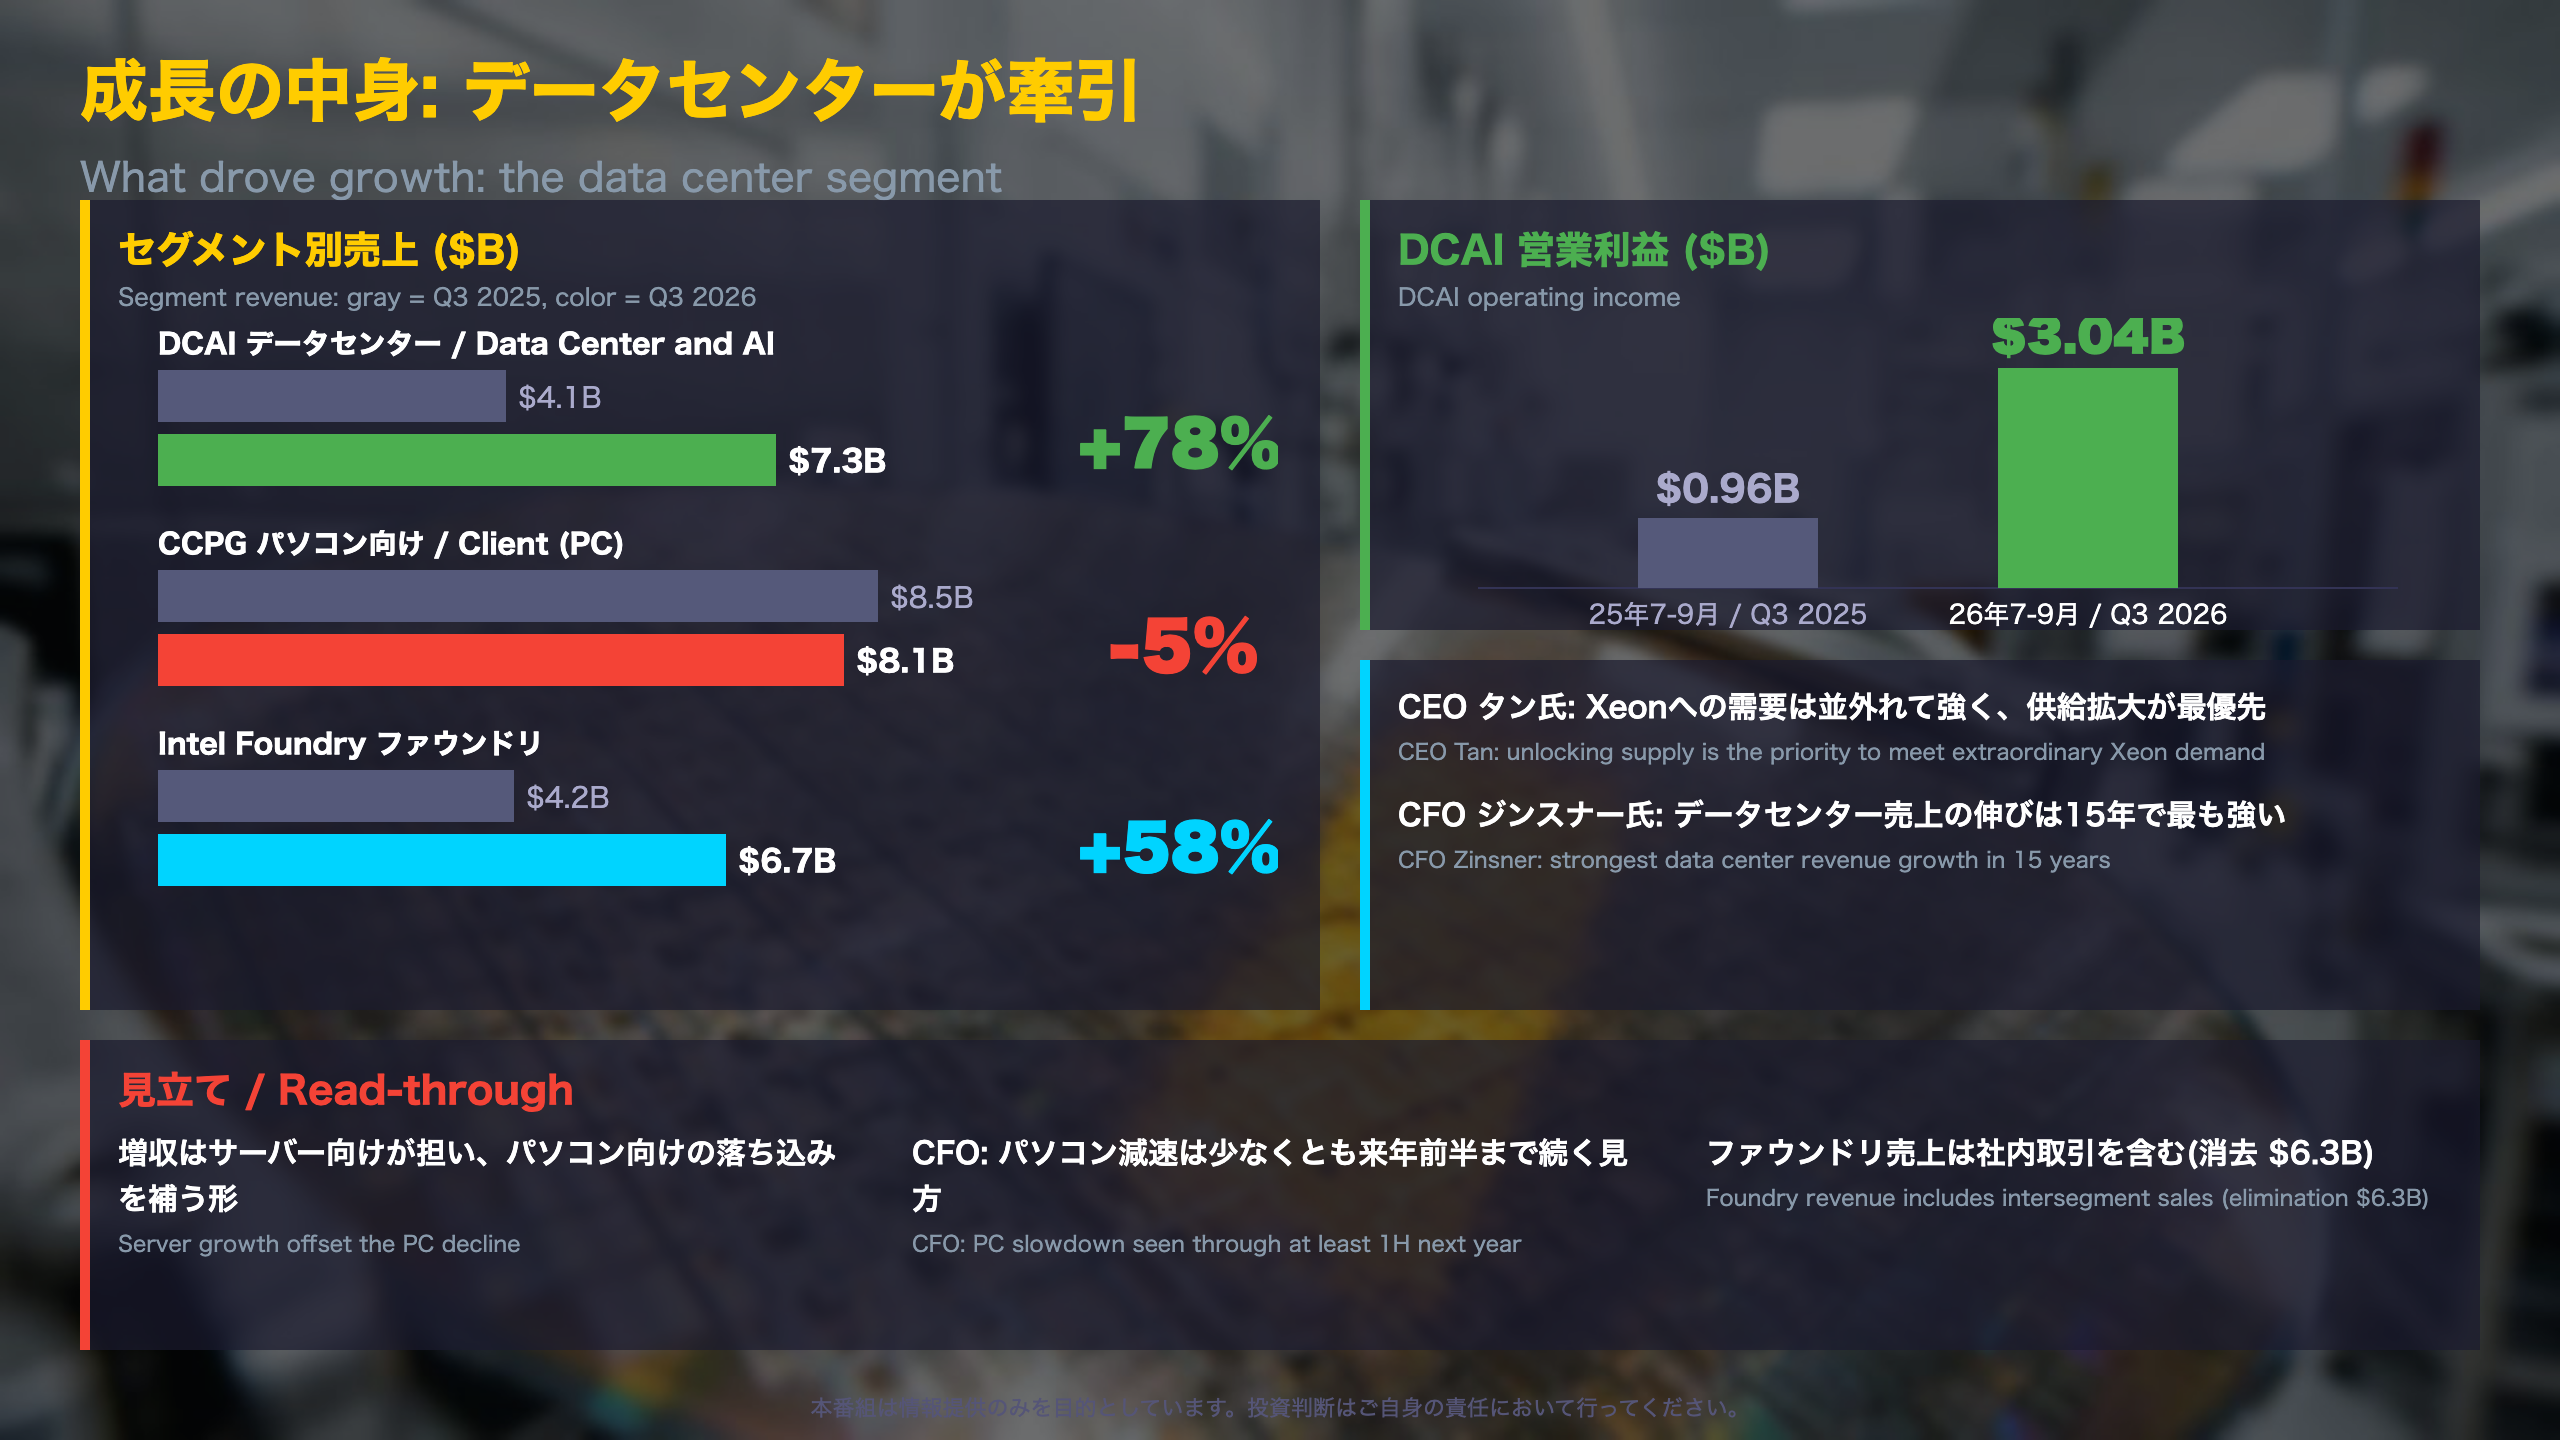
| Segment | Q3 2026 revenue | Q3 2025 | Q3 2026 operating income | Q3 2025 |
|---|---|---|---|---|
| CCPG (client/PC) | $8.1B | $8.5B | $2.29B | $2.69B |
| DCAI (data center & AI) | $7.3B | $4.1B | $3.04B | $0.96B |
| Intel Foundry | $6.7B | $4.2B | -$1.85B | -$2.32B |
What stands out
DCAI operating income now exceeds CCPG’s, a reversal from a year ago when CCPG earned $2.69B against DCAI’s $0.96B. Foundry still loses money, but its operating loss narrowed.
A structural note for global readers
Intel combines chip design (Intel Products: CCPG and DCAI) with manufacturing (Intel Foundry) under one roof, unlike fabless designers that outsource production to foundries such as TSMC. Foundry revenue of $6.7B includes sales to Intel’s own product groups; intersegment eliminations were about $6.3B, so it is not a clean measure of outside customer demand.
Management commentary
CEO Lip-Bu Tan: “Our immediate priority is to unlock additional supply to meet extraordinary demand for our Xeon family.” CFO David Zinsner cited the strongest data center revenue growth in 15 years, while expecting the PC slowdown to continue at least through 1H next year.
Two readings
A constructive reading stresses that data center strength more than offset the PC decline. A cautious reading notes that management itself frames supply as the bottleneck, so near-term growth may depend on how fast capacity expands. Both come from the release, and this note offers no forecast.
深掘り2: 10-12月期の見通し
Q4 2026 guidance in detail
| Item | GAAP | Non-GAAP |
|---|---|---|
| Revenue | $15.0-16.0B | same |
| Gross margin | 37.1% | 38.0% |
| Tax rate | 31% | 11% |
| EPS | $0.10 | $0.25 |
Margin and EPS outlooks assume the midpoint of the revenue range. The $0.15 gap between GAAP and non-GAAP EPS is mostly share-based compensation ($0.11) and tax effects ($0.04).
Why guidance matters for U.S. companies
Unlike the annual forecasts common among Japanese companies, U.S. firms such as Intel typically guide only one quarter ahead and are judged against that range at the next report. Intel’s own CFO said Q3 revenue, gross margin and EPS exceeded the guidance given earlier, so the Q4 ranges are a clear yardstick for the next release.
Costs and balance sheet
Q4 non-GAAP operating expenses are guided to about $4.4B (GAAP about $4.9B). Full-year 2026 GAAP operating expenses are about $22.6B, including $4.3B of restructuring and other charges. Cash and equivalents were $21.8B and short-term investments $32.2B at quarter end, after a $23B equity offering; long-term debt was $46.3B and short-term debt $3.8B.
What the release does not say
The filing gives no explanation for the lower margin guide. The CFO says Intel will keep making disciplined investments in capacity and working capital to increase supply, and the risk-factor section cites industry-wide substrate and memory shortages. The release does not link these items to the margin outlook, so we do not either.
Two readings
A constructive view points to the Q3 beat; a cautious view points to lower guided revenue, margin and EPS. This note offers no forecast. Next check: Q4 actuals versus $15.0-16.0B, 38.0% and $0.25.
質疑で深める: GAAPと調整後のずれ、見通しの読み方
Why GAAP and adjusted EPS diverge
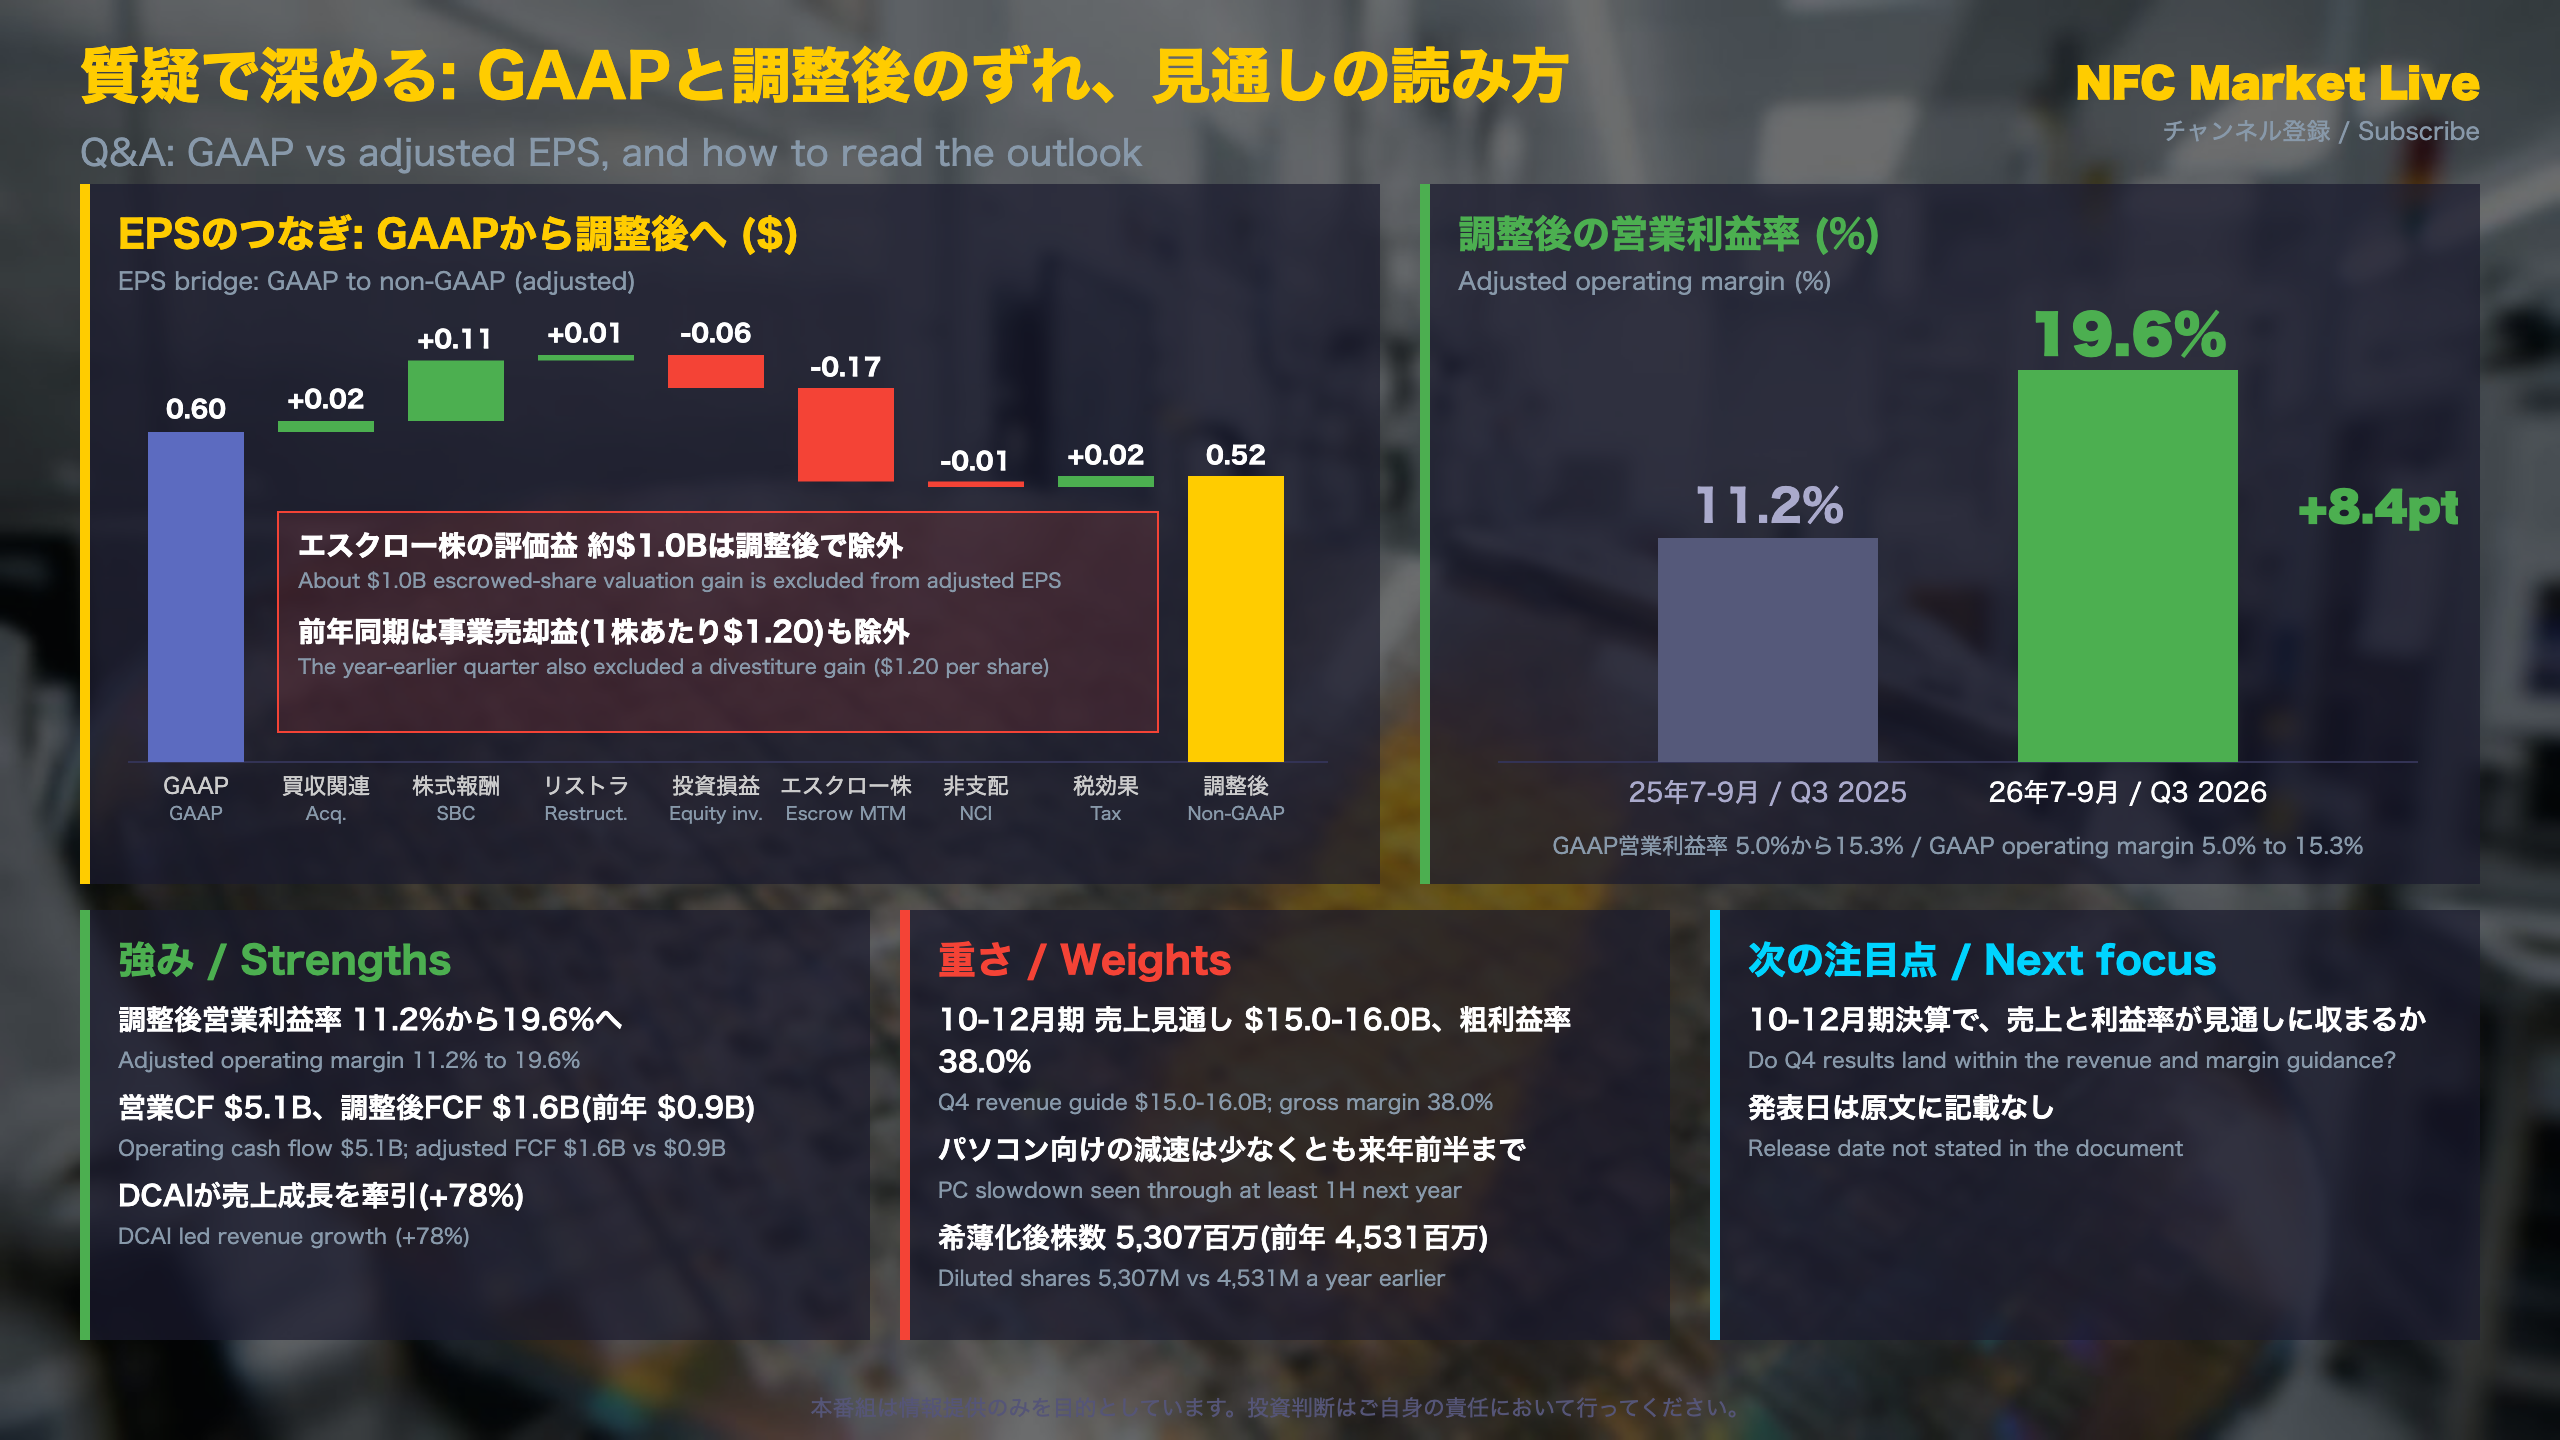
The EPS bridge (per share, USD): GAAP $0.60, plus acquisition-related +0.02, share-based compensation +0.11, restructuring +0.01, equity investment gains -0.06, escrowed-share valuation gain -0.17, non-controlling interest -0.01 and tax effects +0.02, giving adjusted EPS of $0.52. The largest adjustment is the escrowed-share valuation gain. Escrowed shares are Intel shares held for release to the U.S. Department of Commerce as Intel performs under its CHIPS Act Secure Enclave agreement.
Versus a year earlier
In Q3 2025, adjustments removed a divestiture gain (-$1.20 per share) and added back an escrowed-share loss (+$0.37), so GAAP EPS of $0.90 sat far above adjusted EPS of $0.23. This year the relationship flipped: adjusted EPS is below GAAP.
Items worth watching
- Share count: diluted weighted shares were 5,307 million versus 4,531 million a year earlier, after the $23 billion equity offering, which matters when comparing per-share figures.
- Nine-month view: GAAP net loss was $11.6 billion, driven by a $12.6 billion escrowed-share valuation loss and about $4.0 billion of restructuring charges. Operating cash flow was $13.2 billion versus $5.4 billion.
- Headcount: 81.1 thousand versus 88.4 thousand a year earlier.
Two readings
A constructive view emphasizes adjusted operating margin of 19.6% versus 11.2%. A cautious view emphasizes the 38.0% adjusted gross margin guide for Q4. Both are facts from the release, and this note offers no forecast.
Next
The next check is whether Q4 revenue and margin land within guidance. The release does not state the date of that report.
Disclaimer: This article is for informational purposes only. All investment decisions are made solely at your own risk.