📺 Watch the Full Video Analysis
This article was automatically generated by the NFC Market Live AI analysis system. (Updated: 2026-11-04 06:49 JST)
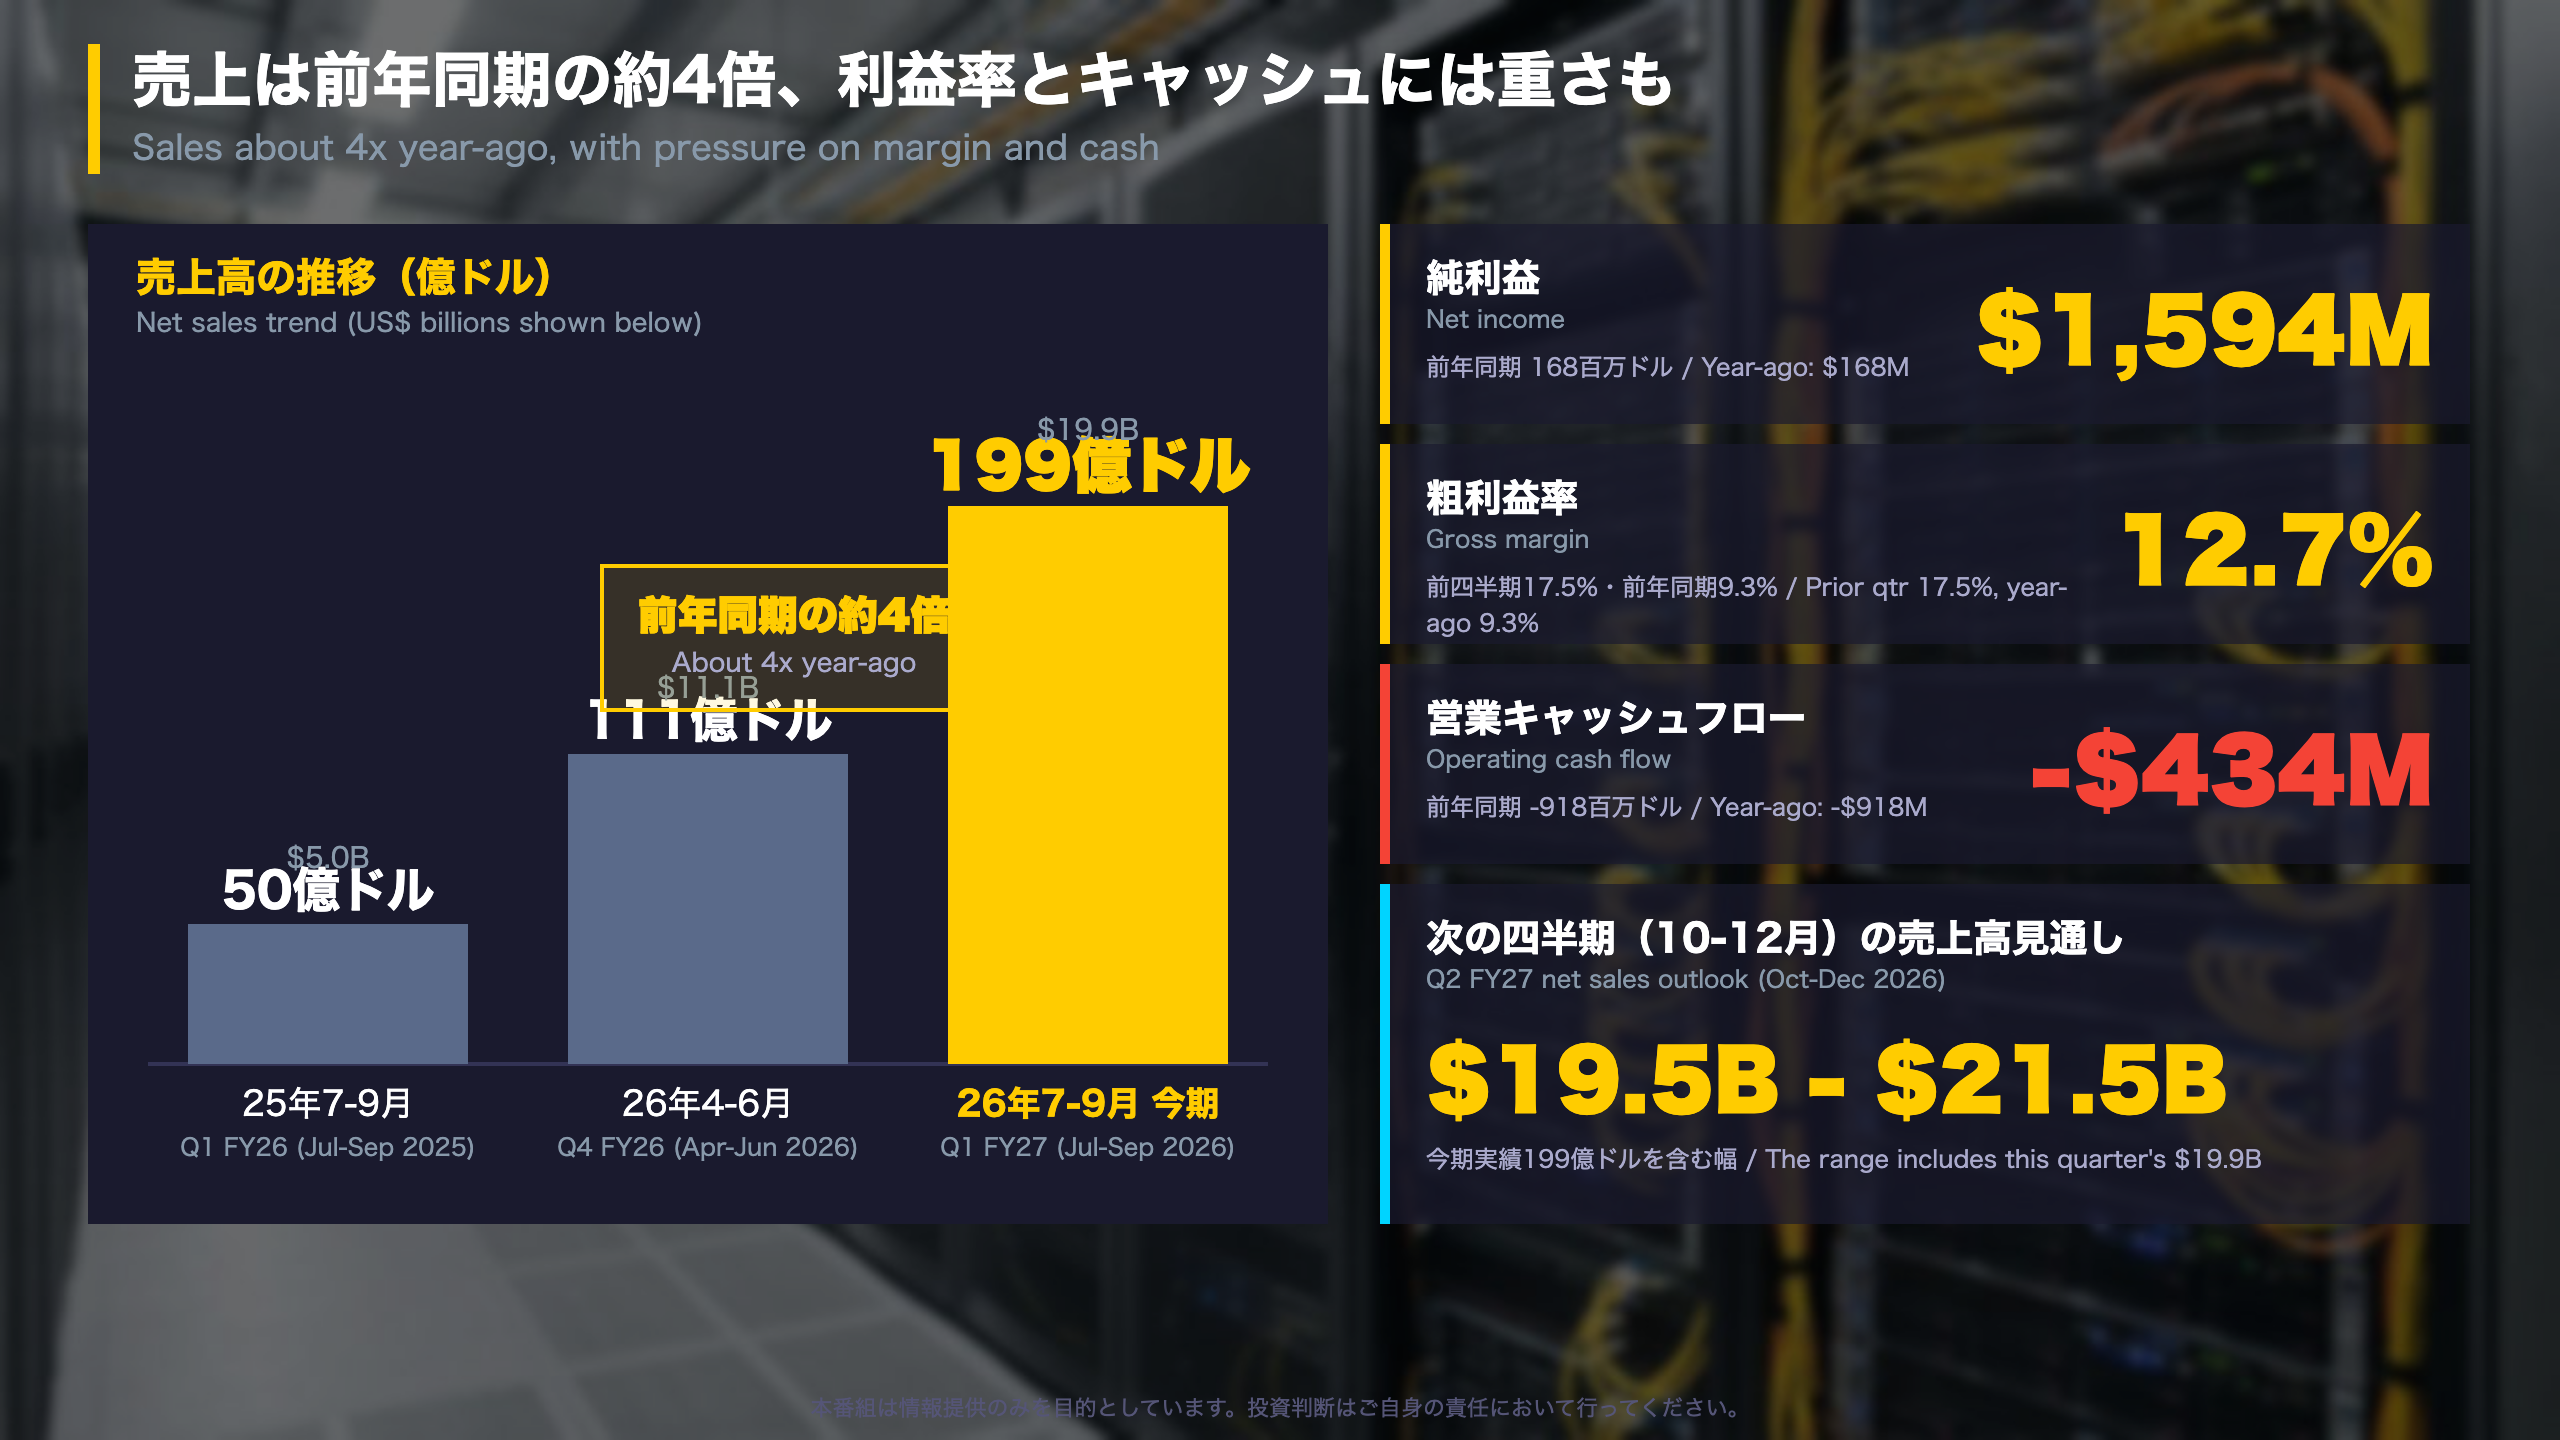
📊 Super Micro Computer (SMCI) reported fiscal Q1 2027 (Jul-Sep 2026) results: net sales of $19.9B, about 4x a year earlier and described by the company as a record.
📉 Gross margin was 12.7% vs 17.5% last quarter, and operating cash flow was negative $434M as receivables and inventory absorbed cash.
💡 Deferred revenue rose about $3.1B. Q2 outlook: net sales of $19.5B-$21.5B and GAAP EPS of $1.59-$1.83.
⚠️ Figures are preliminary and unaudited. Key items to watch: the gross margin level and the direction of operating cash flow.
決算サマリー:売上は約4倍、利益率とキャッシュには重さも
Supermicro at a glance
Who they are: Super Micro Computer (NASDAQ: SMCI), based in San Jose, designs and builds servers, storage and networking systems for AI, cloud and enterprise customers. Its approach is modular building blocks that let customers configure systems for a specific workload. Management now describes the company as a Total AI and IT Datacenter Solution provider, built around its Data Center Building Block Solutions (DCBBS).
The headline numbers
- Net sales: $19.9B vs $11.1B last quarter and $5.0B a year ago
- GAAP net income: $1,594M vs $1,178M and $168M
- GAAP diluted EPS: $1.75; non-GAAP: $1.81 (year-ago $0.35)
How to read it
The release is a preliminary, unaudited 8-K exhibit, so figures may change once the closing process is complete. Unlike coverage of a Fed or BOJ release, no consensus comparison is used here; this note compares only against prior periods and the company’s own outlook.
Context for global readers
For scale, the history table attached to the source material starts in 2015, when quarterly revenue was roughly $0.5B-$0.7B. Server makers assemble systems around components such as processors and GPUs, which the release lists among the building blocks it integrates.
What to watch
Gross margin (12.7% vs 17.5% last quarter) and operating cash flow (negative $434M) are the two lines that diverge from the growth story. Both are reported facts; neither is a forecast.
深掘り1:売上急拡大と粗利益率の低下
Margin anatomy: where the growth shows up
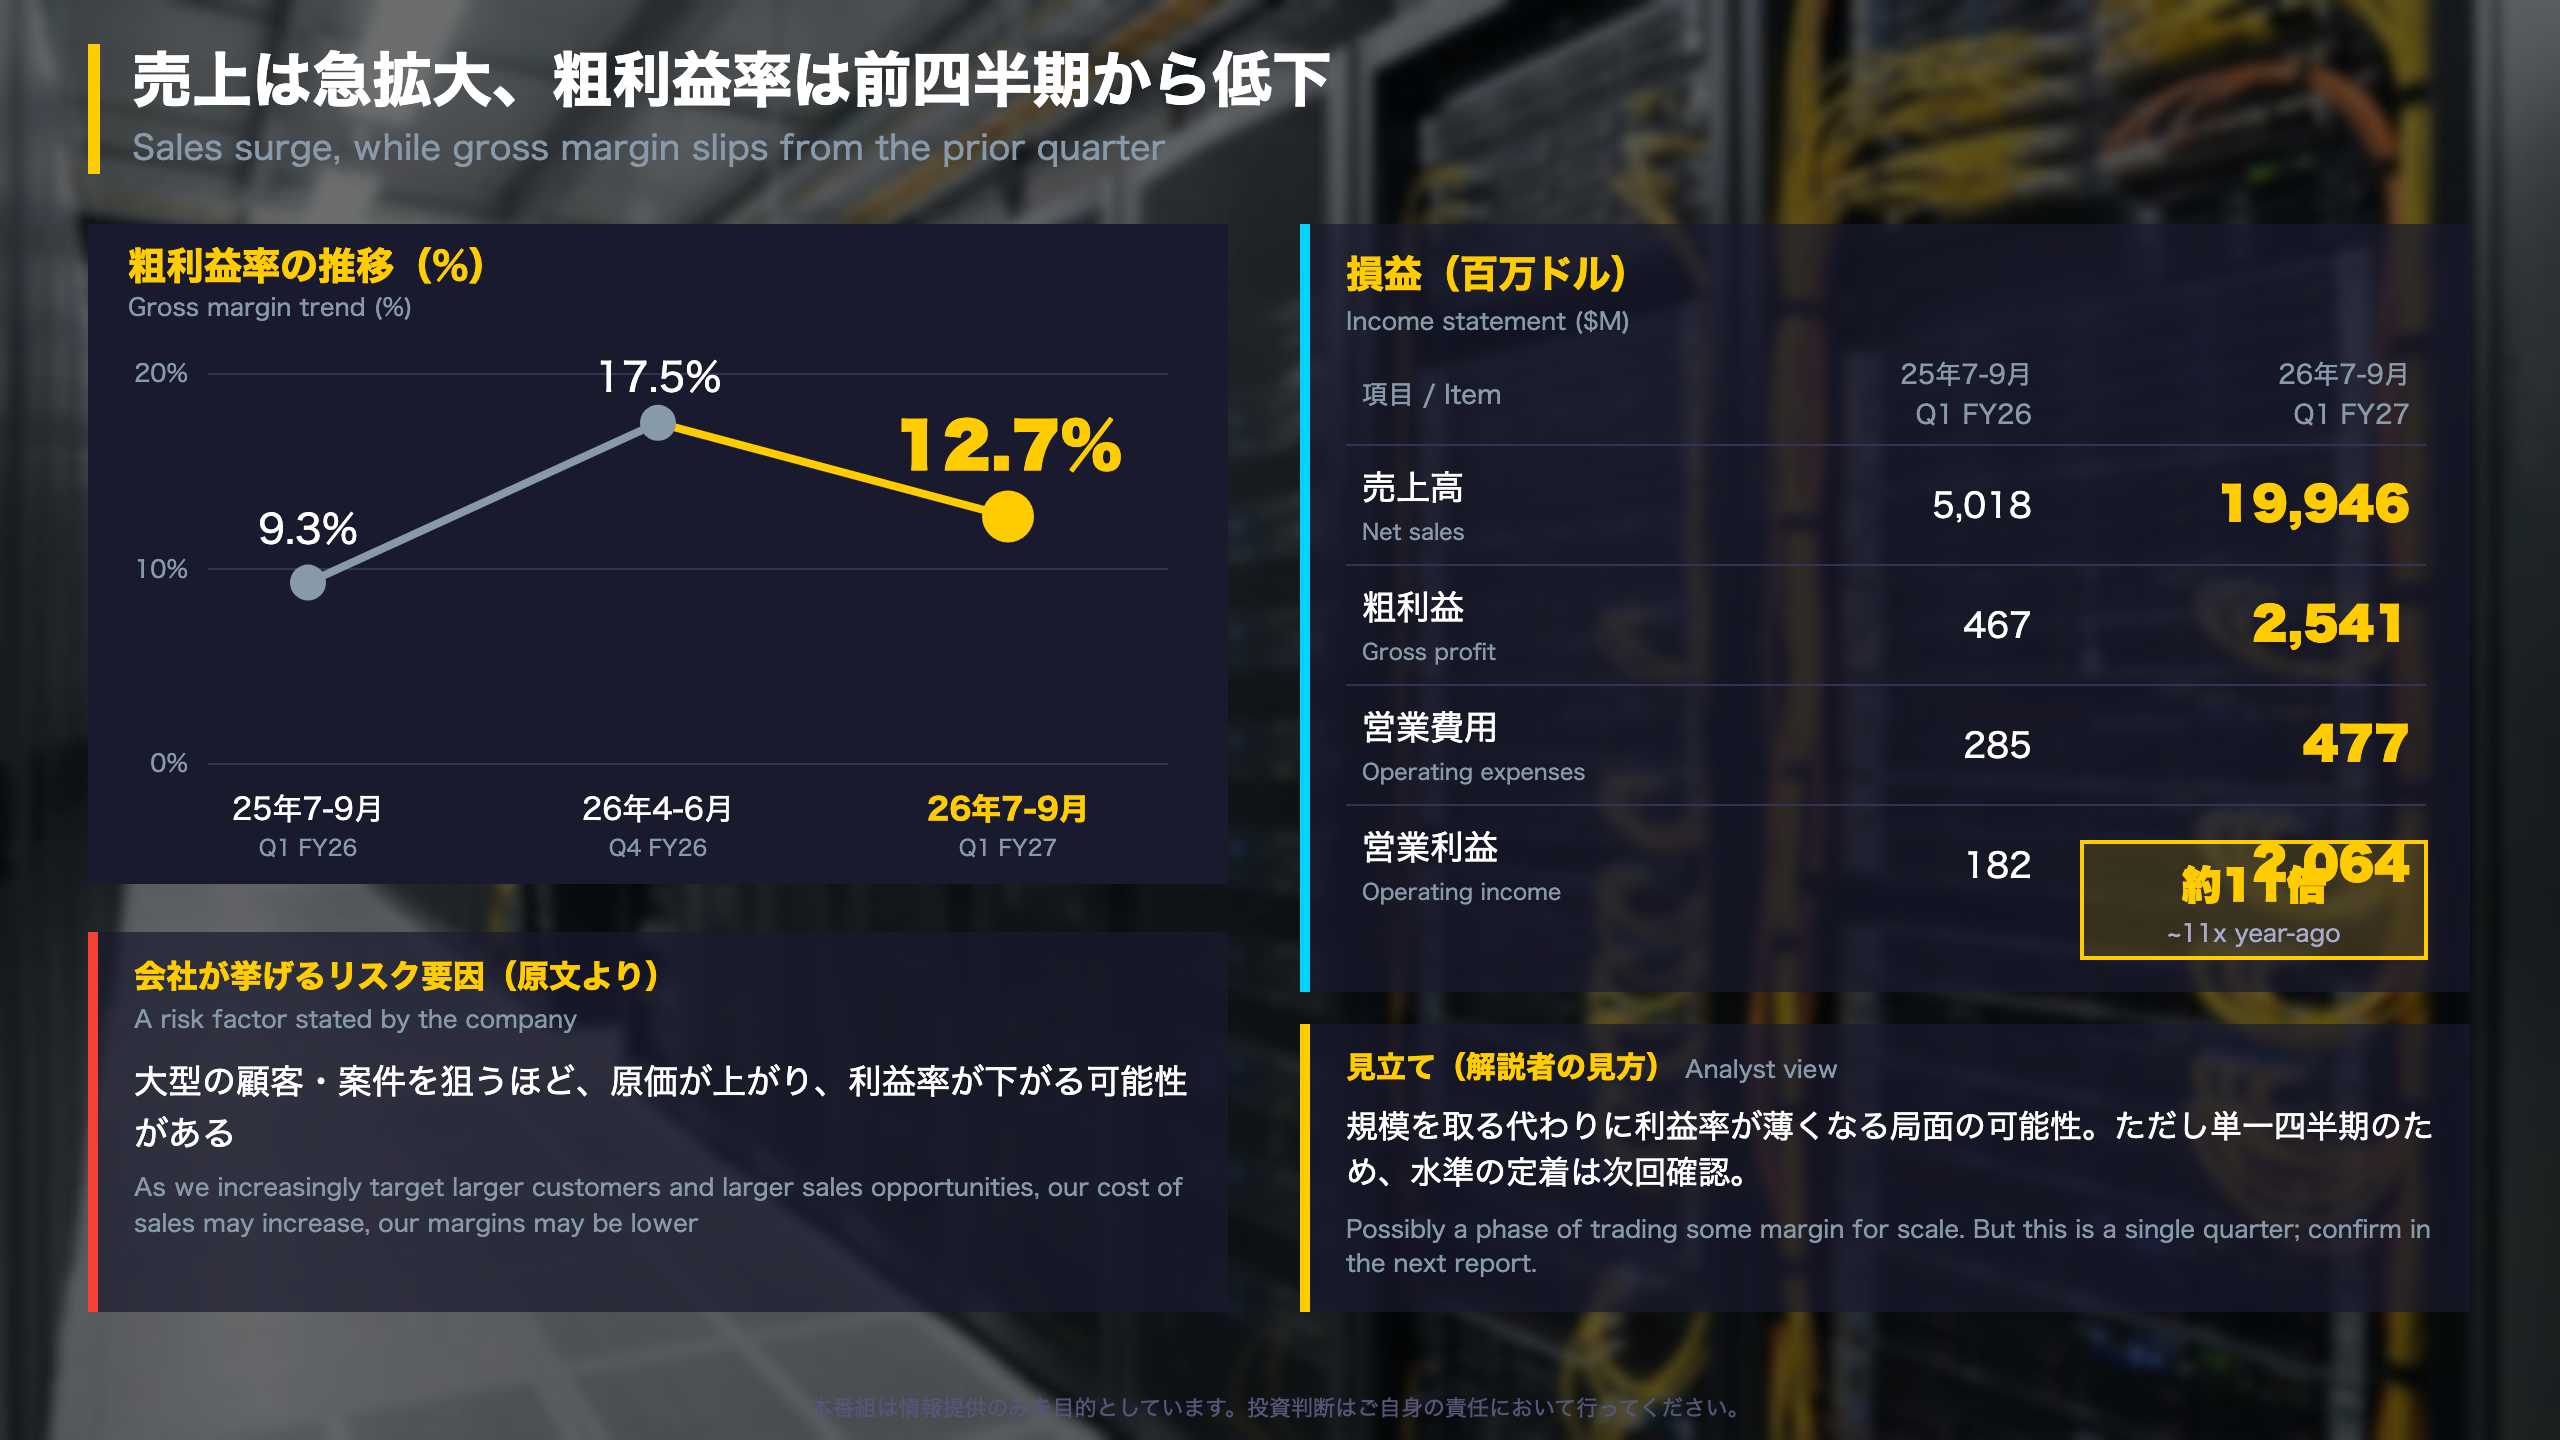
Gross margin on a GAAP basis was 12.7%, versus 17.5% last quarter and 9.3% a year ago. Excluding stock-based compensation, non-GAAP gross margin was 12.8% (year-ago 9.5%), so the adjustment is only about 0.1 point. In other words, the move is not an accounting artifact.
Operating expense lines ($M)
- R&D: 227 (year-ago 173)
- Sales and marketing: 133 (48)
- G&A: 117 (64)
- Total opex: 477 (285)
- Operating income: 2,064 (182)
Sales and marketing grew fastest in percentage terms, yet total opex grew far more slowly than sales. Adjusted EBITDA was $2,227M, or 11.2% of sales versus 6.7% a year earlier.
What the company itself flags
As we increasingly target larger customers and larger sales opportunities, our customer base may become more concentrated, our cost of sales may increase, our margins may be lower…
The release does not tie the margin decline to this risk factor, so linking the two is an interpretation, not a stated cause.
Two readings
- Constructive: gross profit dollars rose from $467M to $2,541M, so absolute profit expanded even at a lower margin percentage.
- Cautious: one quarter cannot show whether 12.7% is a new base or a trough.
Reference point
The next-quarter outlook gives net sales of $19.5B-$21.5B and GAAP EPS of $1.59-$1.83. The release gives no margin guidance, so the gross margin line is something to check in the next report rather than infer.
深掘り2:利益は黒字、営業キャッシュフローは流出
Cash flow and balance sheet: reading the working-capital swing
Why profit and cash diverge
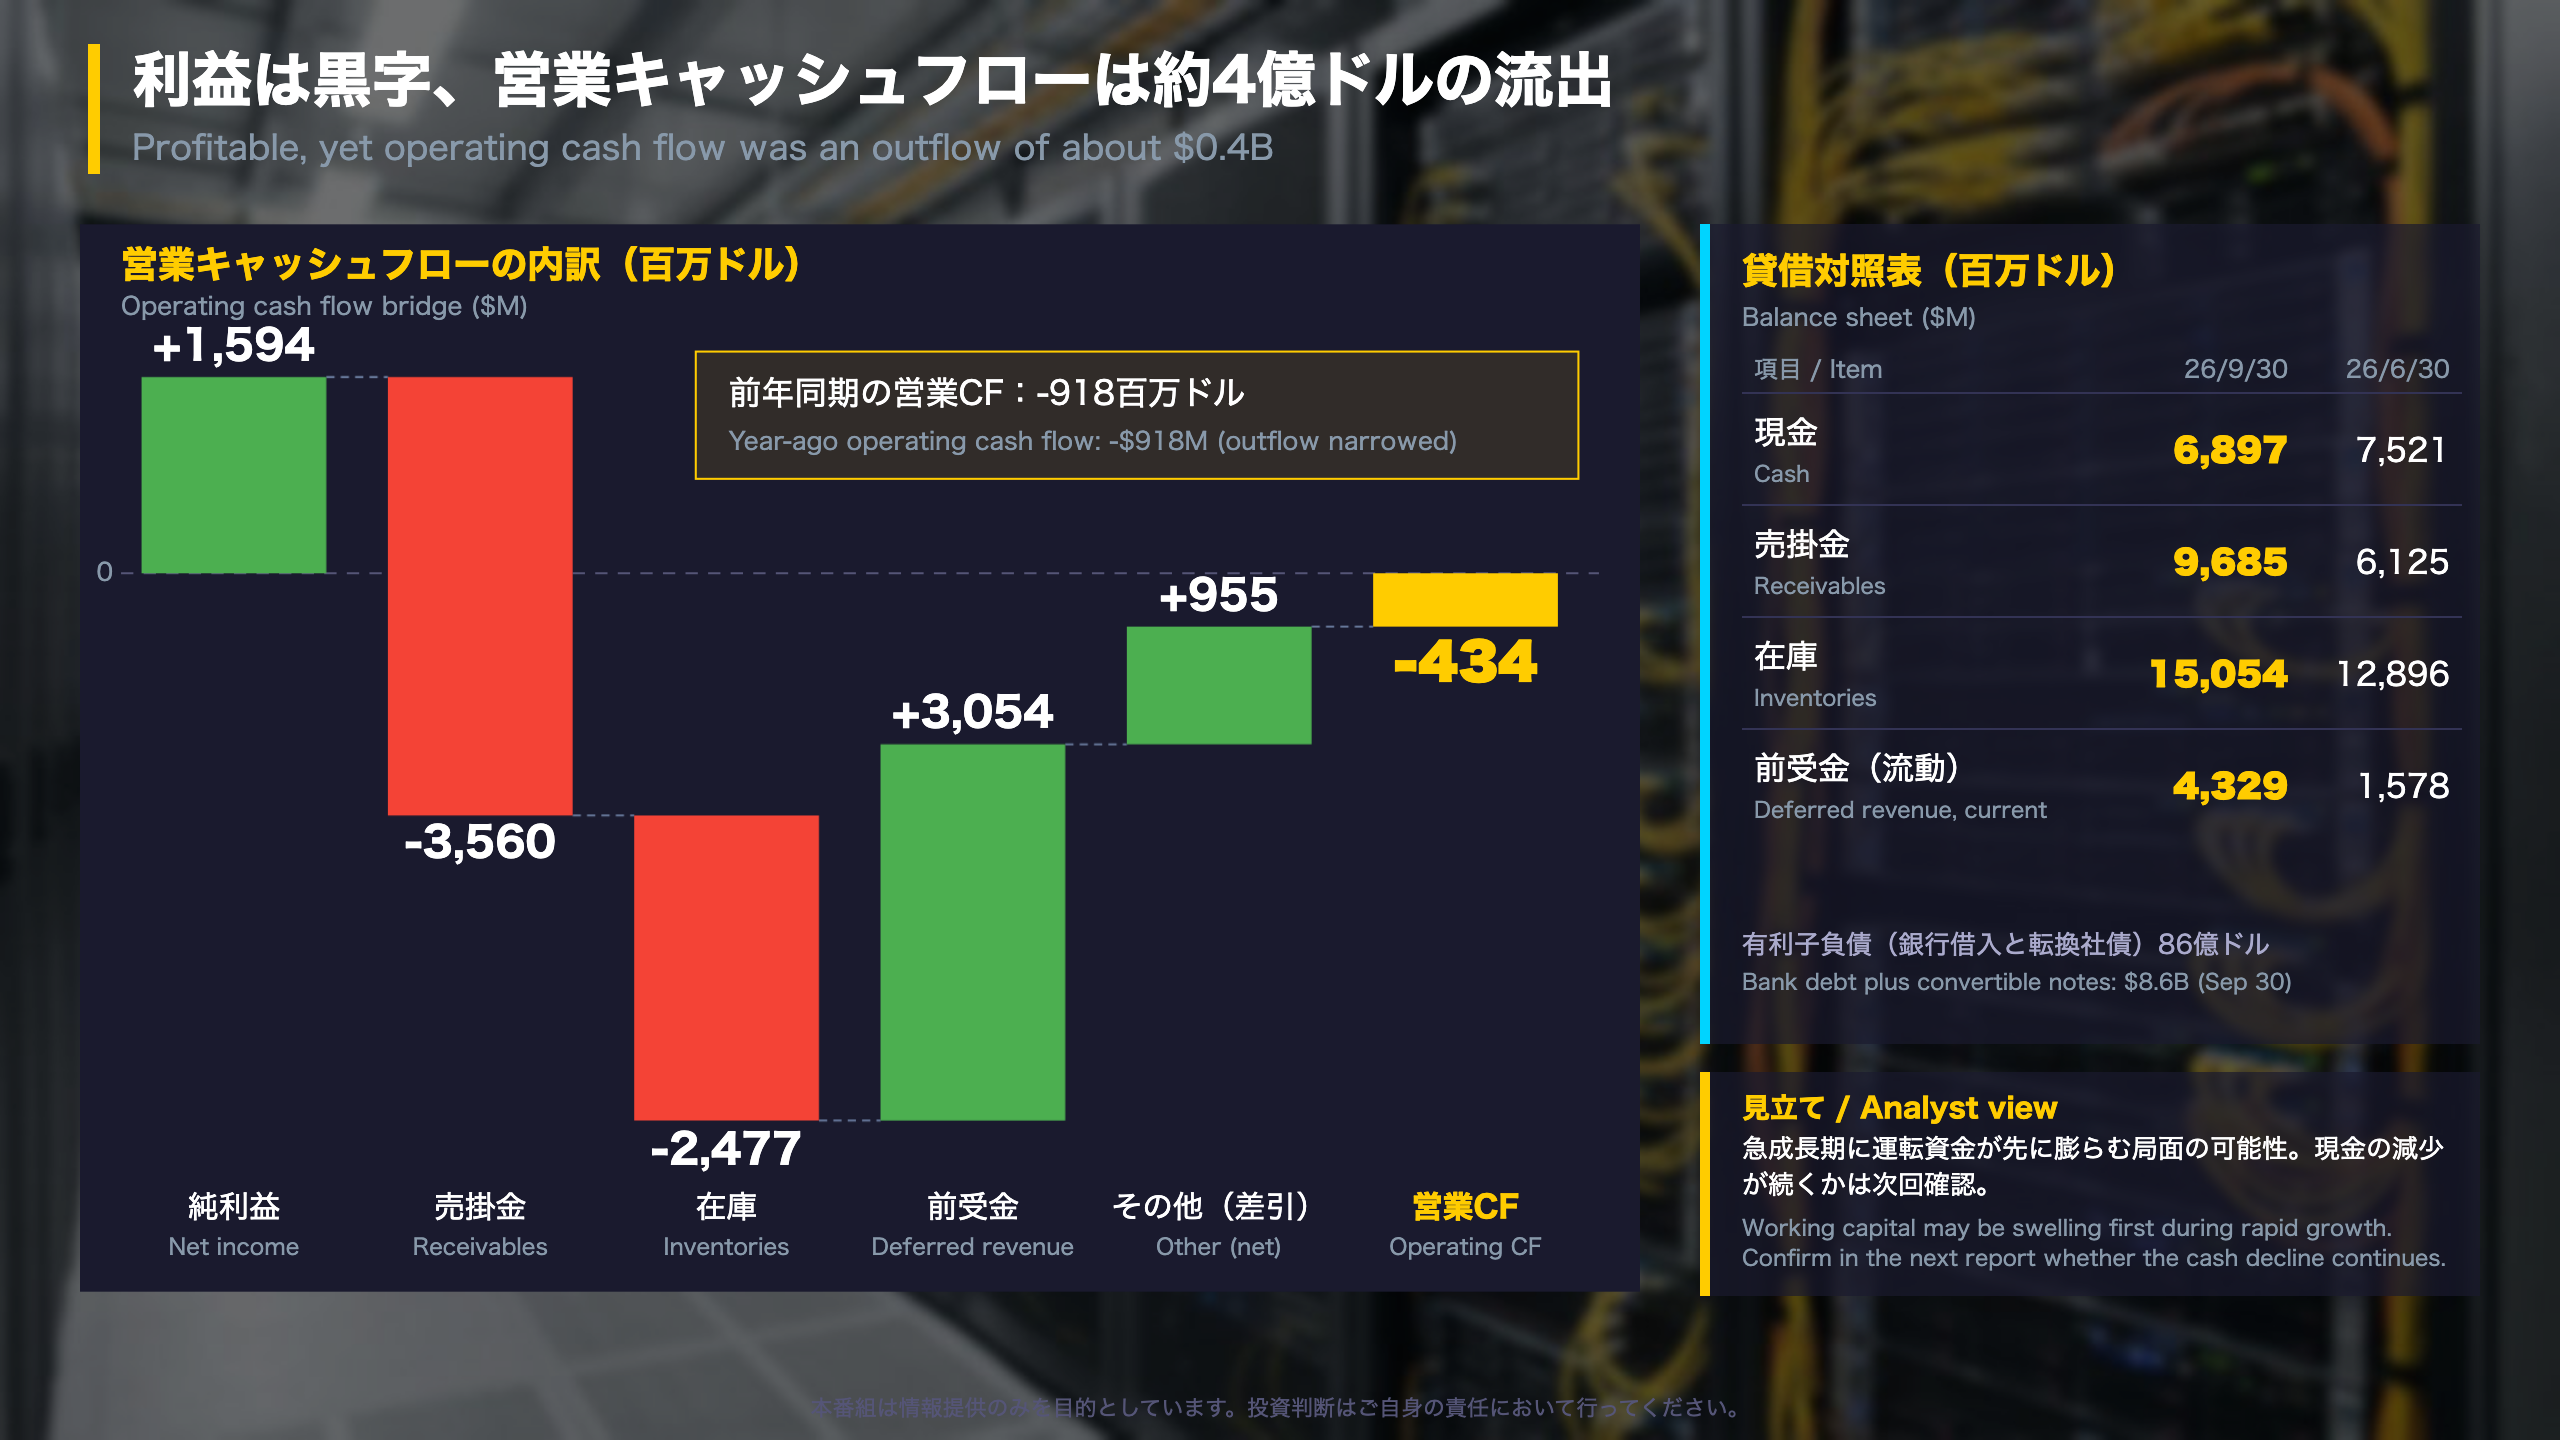
Under US GAAP, cash from operations starts with net income and then adjusts for items such as receivables, inventories and deferred revenue (a contract liability: cash collected before the revenue is recognized). This quarter’s bridge ($M): net income +1,594, receivables -3,560, inventories -2,477, deferred revenue +3,054, other items net +955, giving operating cash flow of -434.
Balance sheet snapshot (Sep 30 vs Jun 30, $M)
- Cash and equivalents: 6,897 vs 7,521
- Accounts receivable: 9,685 vs 6,125
- Inventories: 15,054 vs 12,896
- Deferred revenue, current: 4,329 vs 1,578
- Bank debt plus convertible notes: about $8.6B
Financing costs
Interest expense rose to $82.5M from $24.9M, and cash interest paid reached $110M versus $39M a year earlier. The company also paid $63.7M of preferred dividends in cash.
Perspective
A year earlier, operating cash flow was -$918M on far lower sales, so the outflow is smaller this time. Rapid revenue growth in hardware businesses commonly front-loads inventory and receivables; the customer prepayments here are the offsetting entry. One quarter is not enough to call the pattern structural.
What to watch
Whether operating cash flow turns positive, and whether receivables and inventory growth slows relative to sales. Both are observable in the next filing; the release gives no cash flow guidance.
質疑で深める:1株利益と次の四半期の見通し
From net income to EPS, and the outlook
The EPS bridge, explained
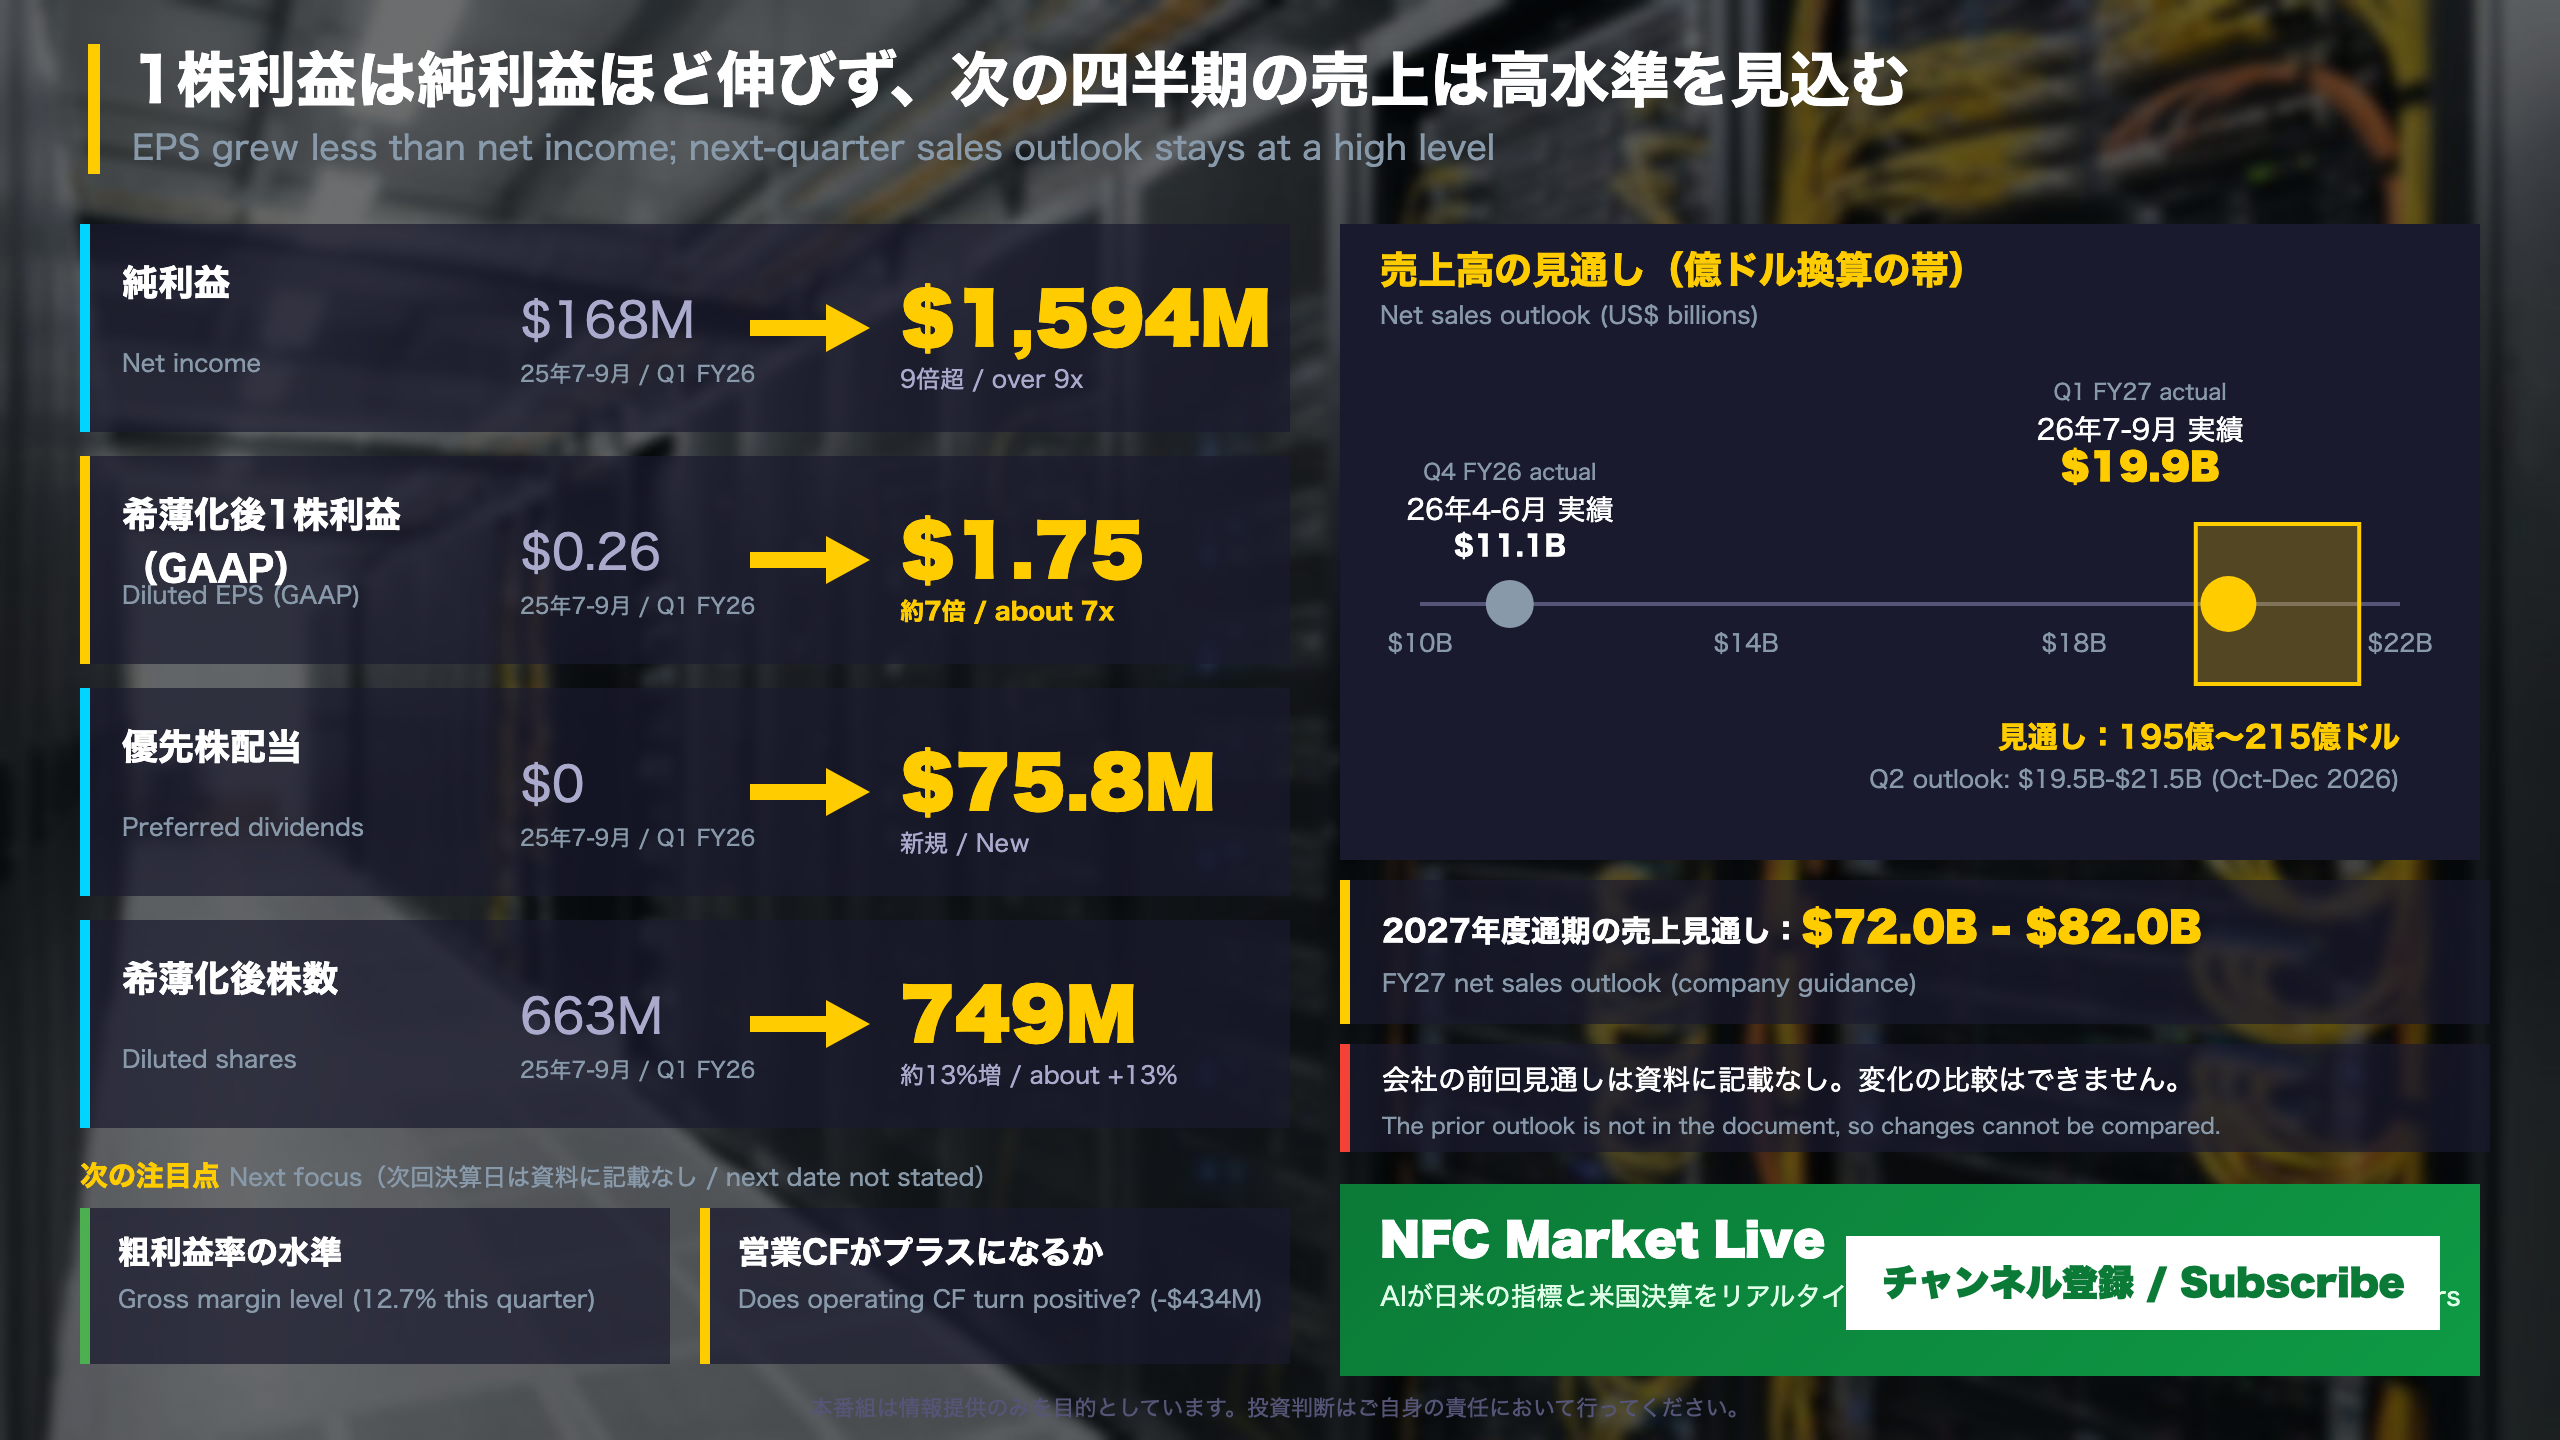
Supermicro now has a mandatory convertible preferred stock outstanding, and it uses the two-class method: part of earnings is allocated to participating securities before arriving at earnings for common holders. The bridge ($M): net income 1,594, less preferred dividends 76 and earnings allocated to participating securities 252, leaves 1,267 for common shareholders on a basic basis. Diluted shares were 749M versus 663M a year ago. That is why diluted GAAP EPS of $1.75 (up from $0.26) grew less than net income did.
GAAP vs non-GAAP
Non-GAAP diluted EPS was $1.81 (year-ago $0.35). The only adjustment is stock-based compensation (+$0.11 per share) net of tax (-$0.05).
The company’s outlook
- Q2 FY27 net sales: $19.5B-$21.5B
- GAAP EPS $1.59-$1.83; non-GAAP EPS $1.66-$1.90
- Assumed tax rate about 21.2% (GAAP) and 21.1% (non-GAAP); diluted shares 753M and 769M
- FY27 net sales: $72.0B-$82.0B
How this compares internationally
Unlike Japanese quarterly reports, which often come with a prior forecast to compare against, this release contains no previous outlook, so the guidance cannot be judged against an earlier figure. We also do not use analyst consensus.
What to watch
The next earnings date is not stated in the release. The report is preliminary and unaudited. Two items stand out: the gross margin level and whether operating cash flow turns positive. Where actual sales land within the $19.5B-$21.5B range is the third.
Disclaimer: This article is for informational purposes only. All investment decisions are made solely at your own risk.