This article was automatically generated by the NFC Market Live AI analysis system. (Updated: 2026-11-13 06:25 JST)
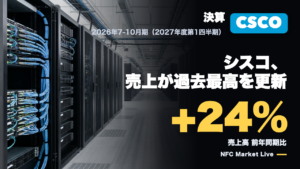
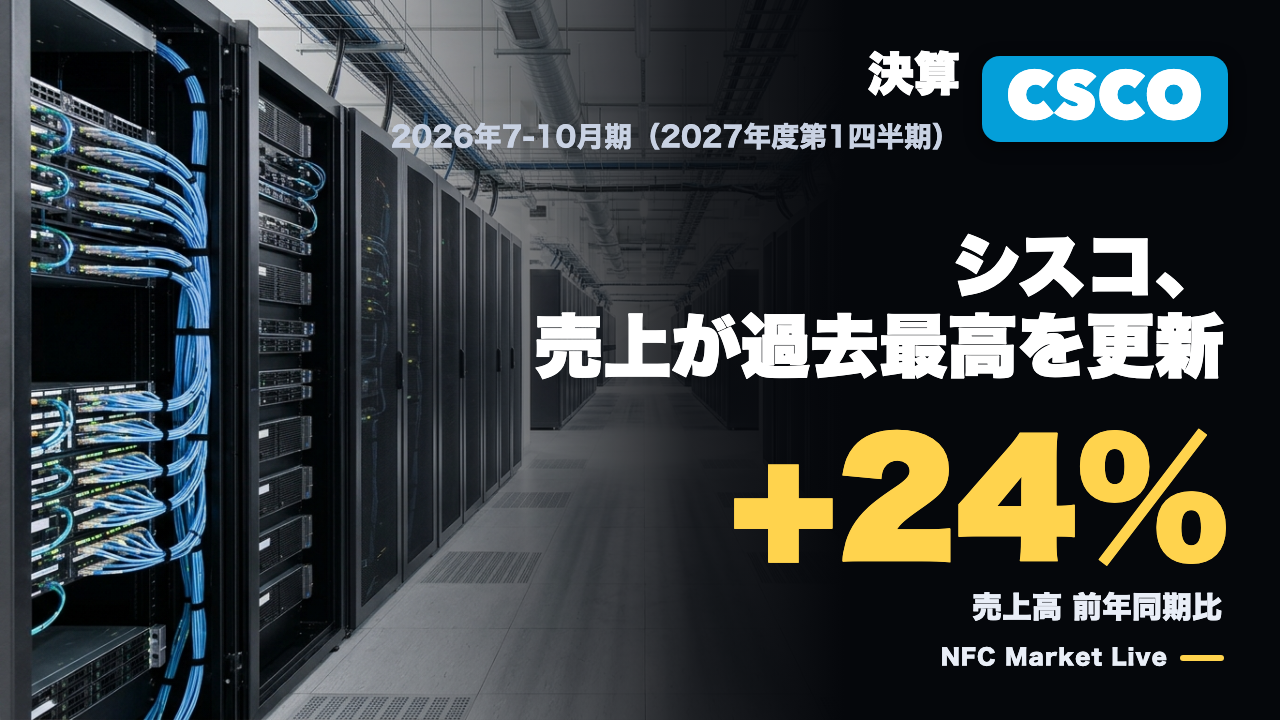
📊 Cisco (CSCO) reported Q1 FY27 results (Jul-Oct 2026) on Nov 12, 2026.
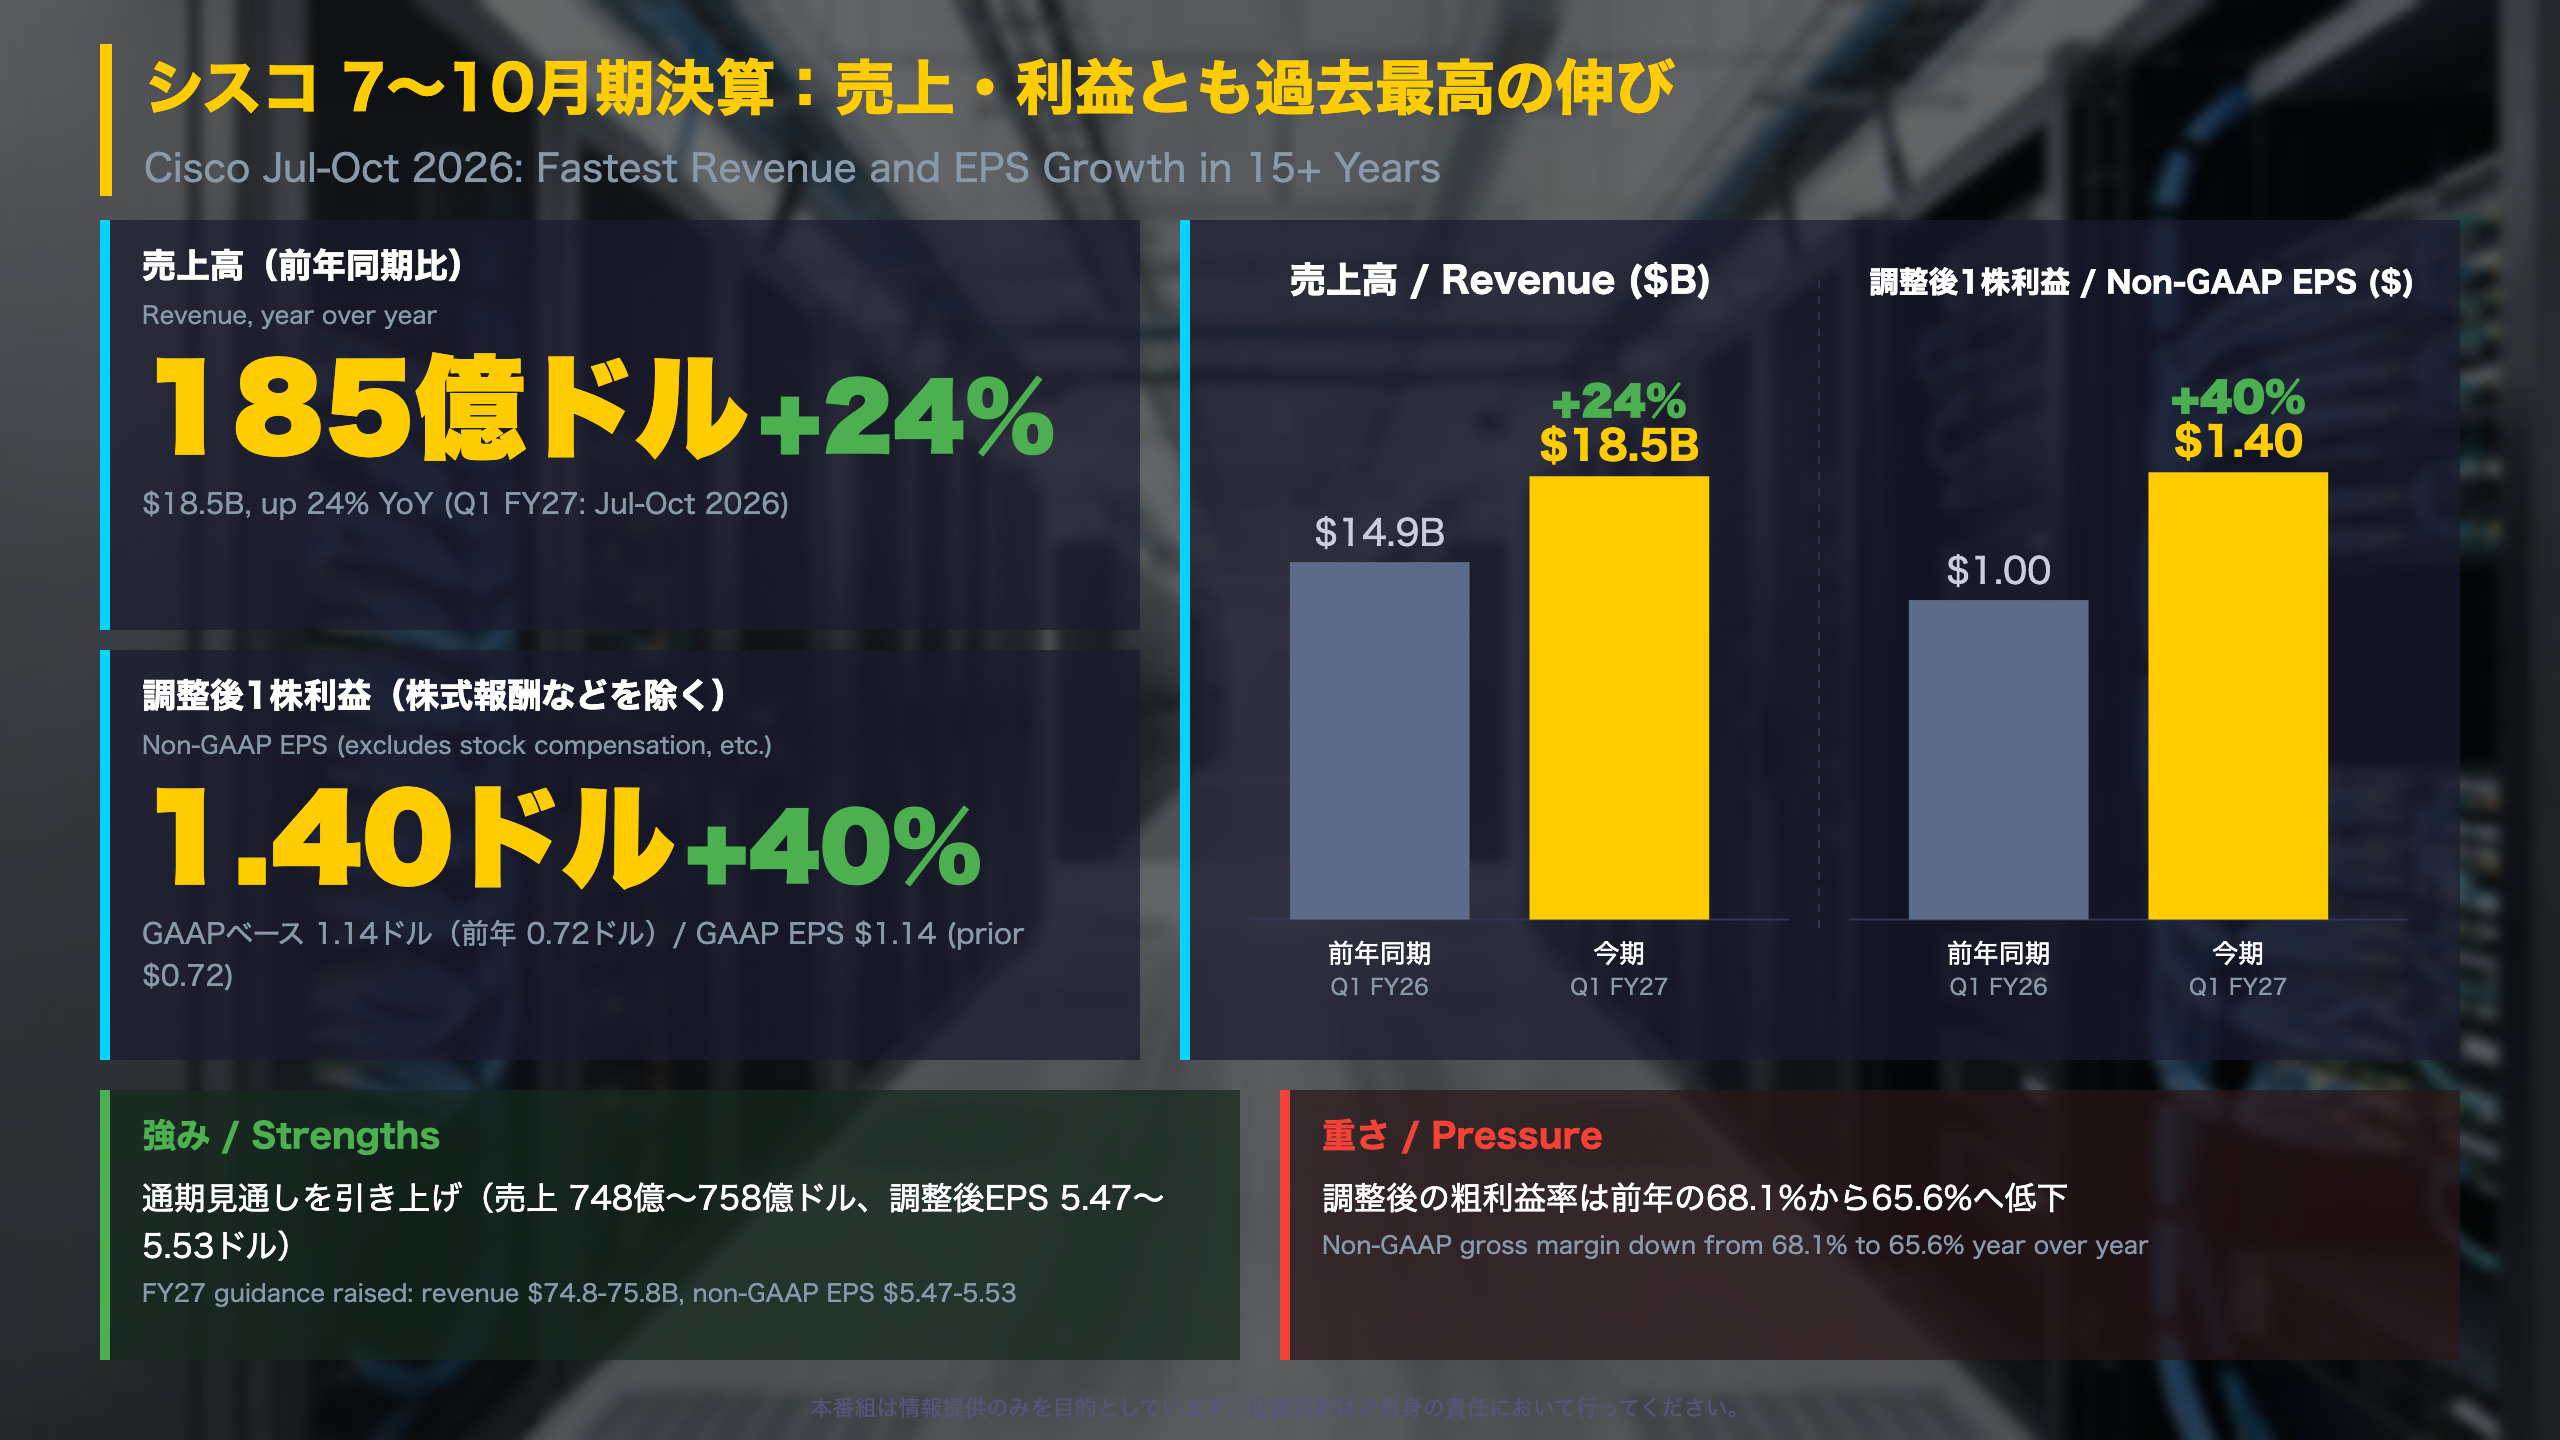
💡 Revenue was $18.5B (+24% YoY) and non-GAAP EPS $1.40 (+40%). Networking revenue reached $11.1B, up 43%.
📈 The company raised FY27 revenue and non-GAAP EPS guidance, and now expects $9B of AI infrastructure revenue from hyperscalers in FY27.
⚠️ Non-GAAP gross margin fell from 68.1% to 65.6%, and Q2 revenue guidance of $18.0-18.2B sits below this quarter’s result.
A balanced look at both the strengths and the pressure points, based on the release.
サマリー:売上・利益とも強い伸び、粗利益率は低下
Cisco Q1 FY27 at a glance
Reporting context. Cisco’s fiscal year ends in late July, so the quarter ended October 24, 2026 is its first quarter of fiscal 2027. The figures come from the press release attached to an SEC Form 8-K (Exhibit 99.1). Unlike Japan’s Tankan or government statistics, this is a company-prepared disclosure, so management’s framing deserves to be separated from the reported numbers.
GAAP vs non-GAAP
- GAAP follows US accounting rules: net income $4.6B, EPS $1.14 (+58%).
- Non-GAAP excludes items such as stock-based compensation, amortization of acquired intangibles and restructuring: net income $5.6B, EPS $1.40 (+40%).
- The gap between the two is $0.26 per share, smaller than a year earlier ($0.28).
Regional picture
Americas revenue rose 28%, EMEA 18% and APJC (Asia-Pacific, Japan and China) 21%. Management says growth was double-digit in every geography and customer market.
Two readings
- Constructive: record revenue, record non-GAAP operating margin, operating cash flow up 36%, and raised FY27 guidance.
- Cautious: non-GAAP gross margin slipped to 65.6% from 68.1%, and Q2 revenue guidance of $18.0-18.2B is below this quarter’s $18.5B. The release offers no seasonal explanation.
Comparison point for global readers
The CEO’s description of a multi-year networking supercycle is a company view. It is not a government or independent forecast, and this note does not rely on it.
What comes next
A $0.42 quarterly dividend is payable on January 20, 2027. The date of the next earnings report is not stated in the release. The XBRL history supplied with the material ends in 2018, so no long-run trend comparison is made here.
解説1:成長の中心はネットワーキング
Where the growth came from
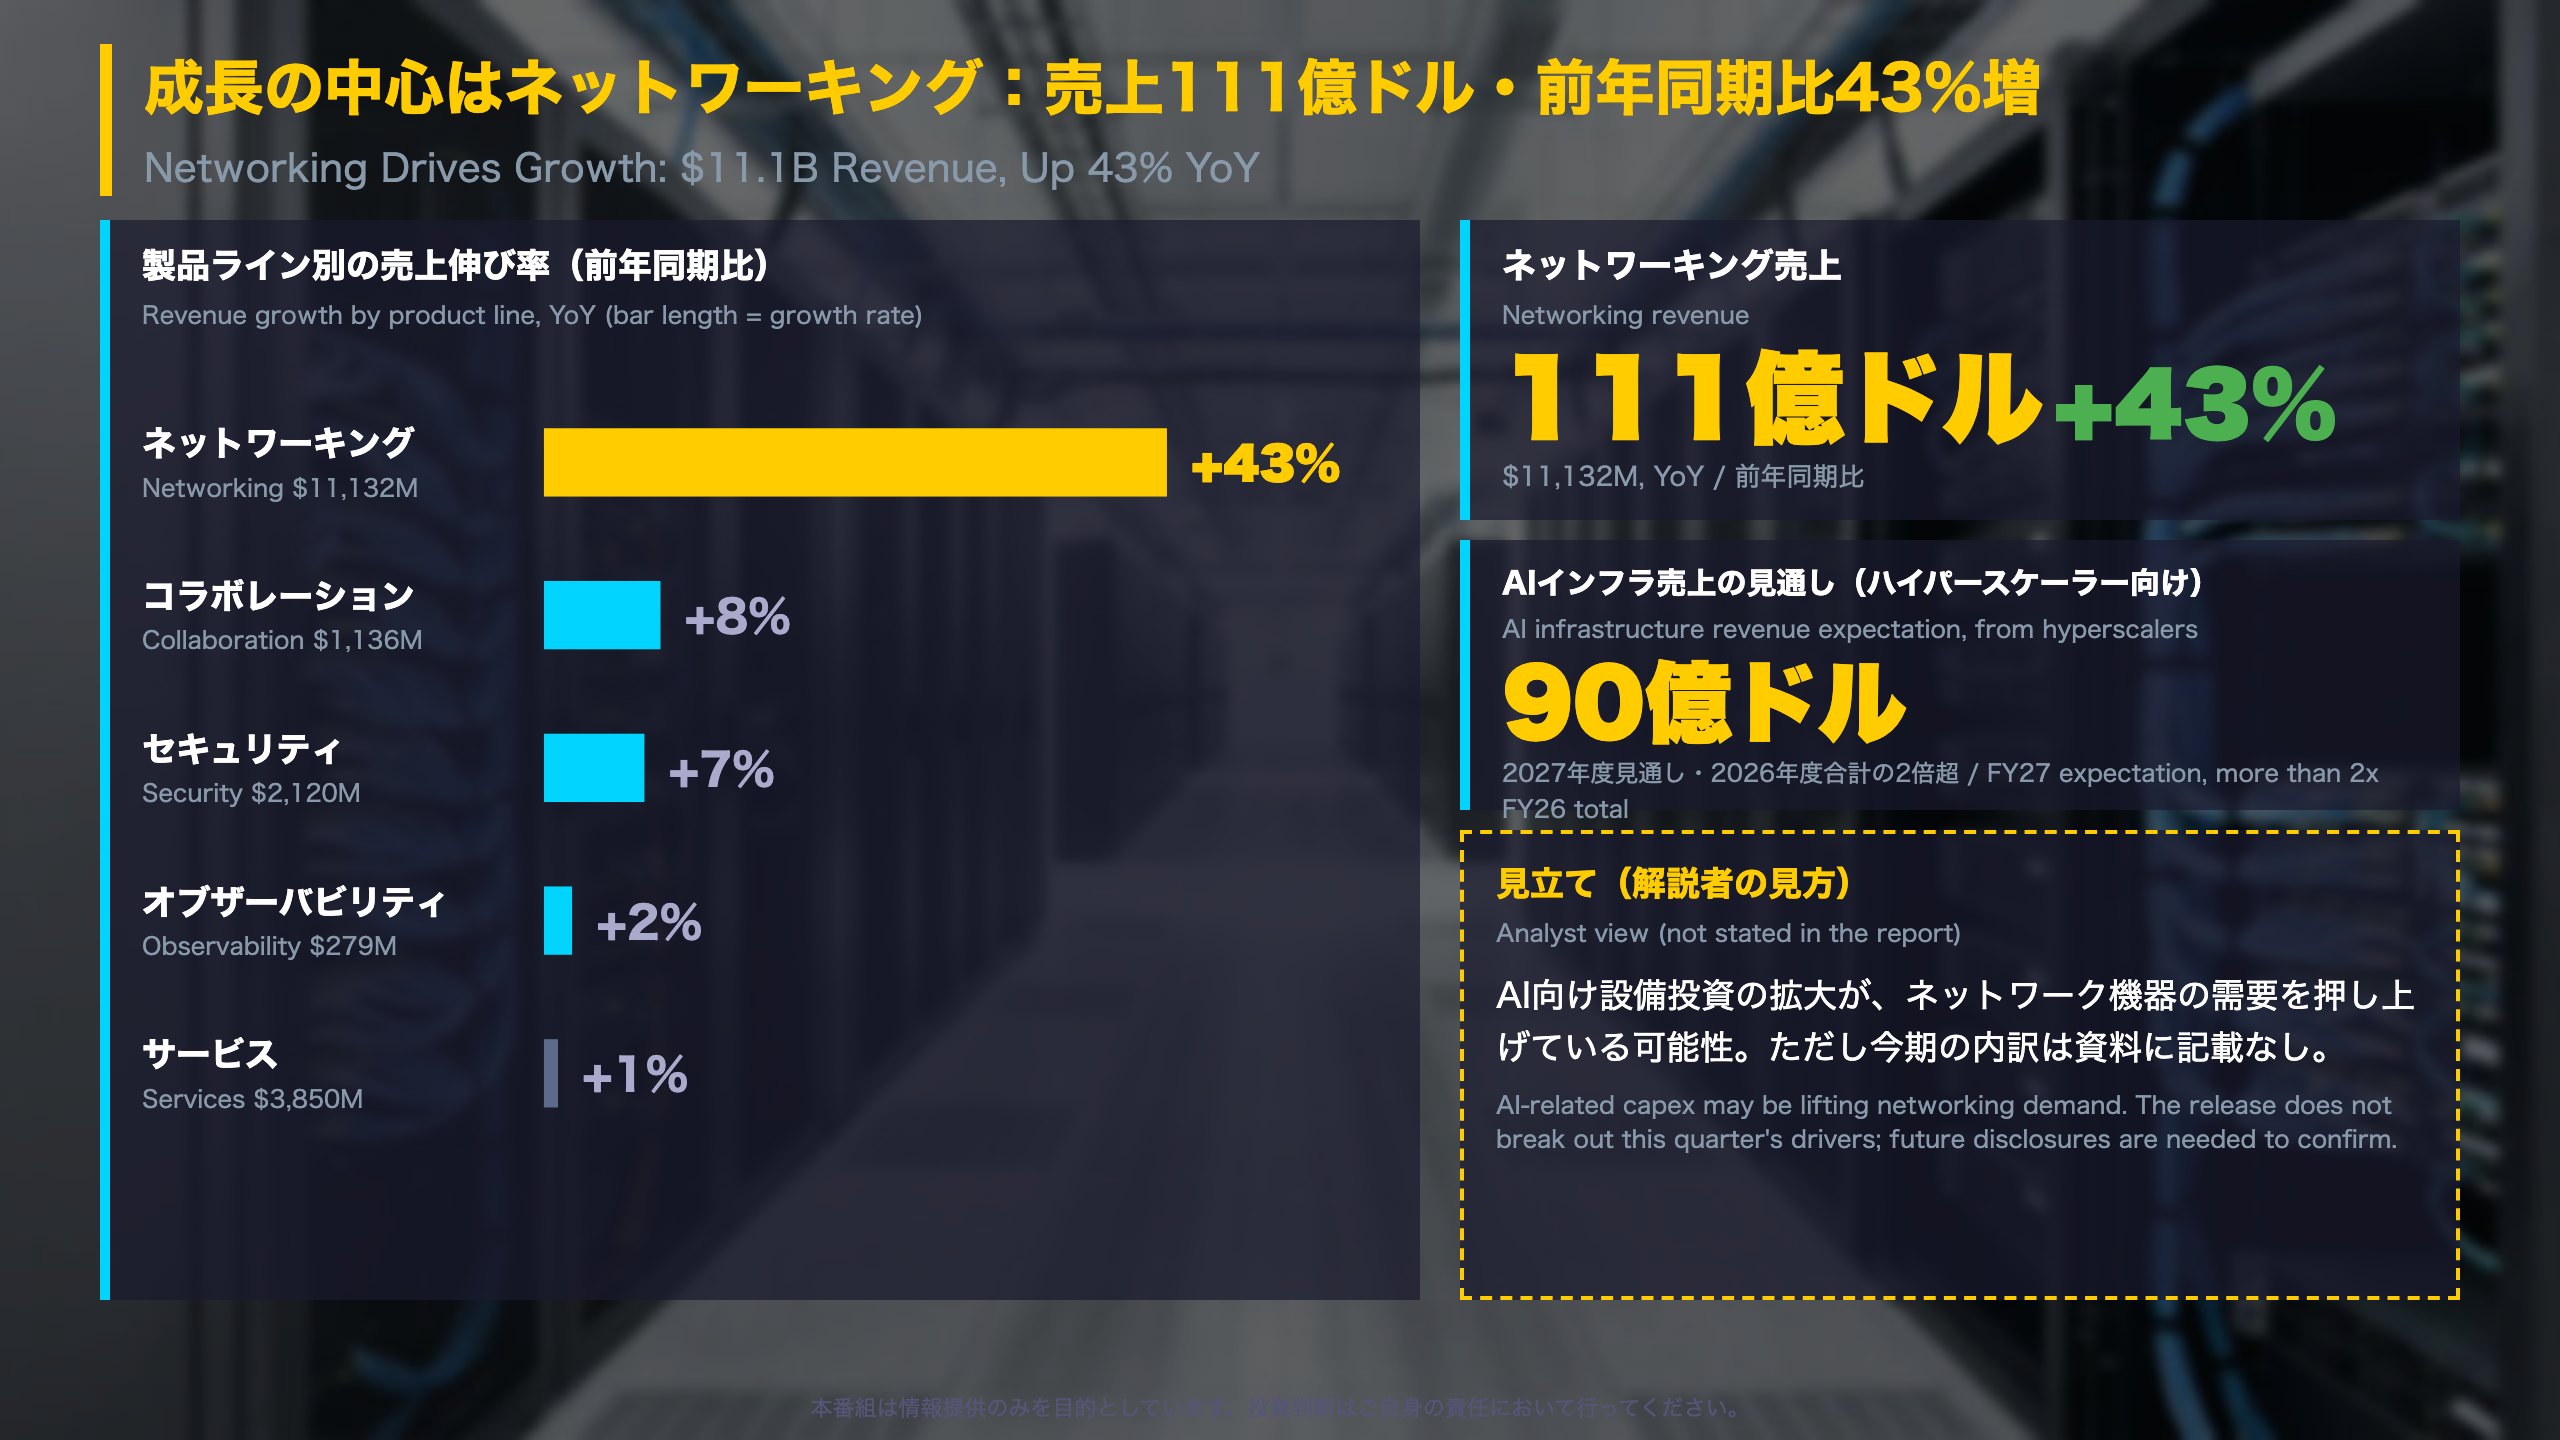
Product lines (Q1 FY27, USD millions, YoY): Networking 11,132 (+43%); Security 2,120 (+7%); Collaboration 1,136 (+8%); Observability 279 (+2%); Services 3,850 (+1%). Product revenue rose from $11.1B to $14.7B, while services were essentially flat at about $3.8B.
Who are the hyperscalers?
Hyperscalers are the very large cloud operators that build giant data centers. Cisco says it now expects $9B of AI infrastructure revenue from them in FY27, more than double the FY26 total. This is a company expectation about the full year, not a figure for the quarter just reported.
Why the distinction matters
The release does not say how much of the 43% networking growth came from AI projects. Our own view, flagged as such, is that AI-related capital spending may be a contributor. Readers should treat it as a hypothesis until later disclosures, such as the earnings call or the Form 10-Q, provide detail.
Two readings
- Constructive: growth appears broad-based by geography (Americas +28%, EMEA +18%, APJC +21%), so it does not rest on one region.
- Cautious: the other three product lines grew in single digits, so total growth leans heavily on networking.
Regional gross margins (GAAP)
Americas 64.1%, EMEA 68.9%, APJC 66.5%. The release gives no prior-year regional figures, so the direction of change cannot be assessed.
Deal activity
Cisco closed the acquisition of WideField Security, a privately held security company. The price is not disclosed in the release.
解説2:利益の出方と粗利益率
Margin anatomy
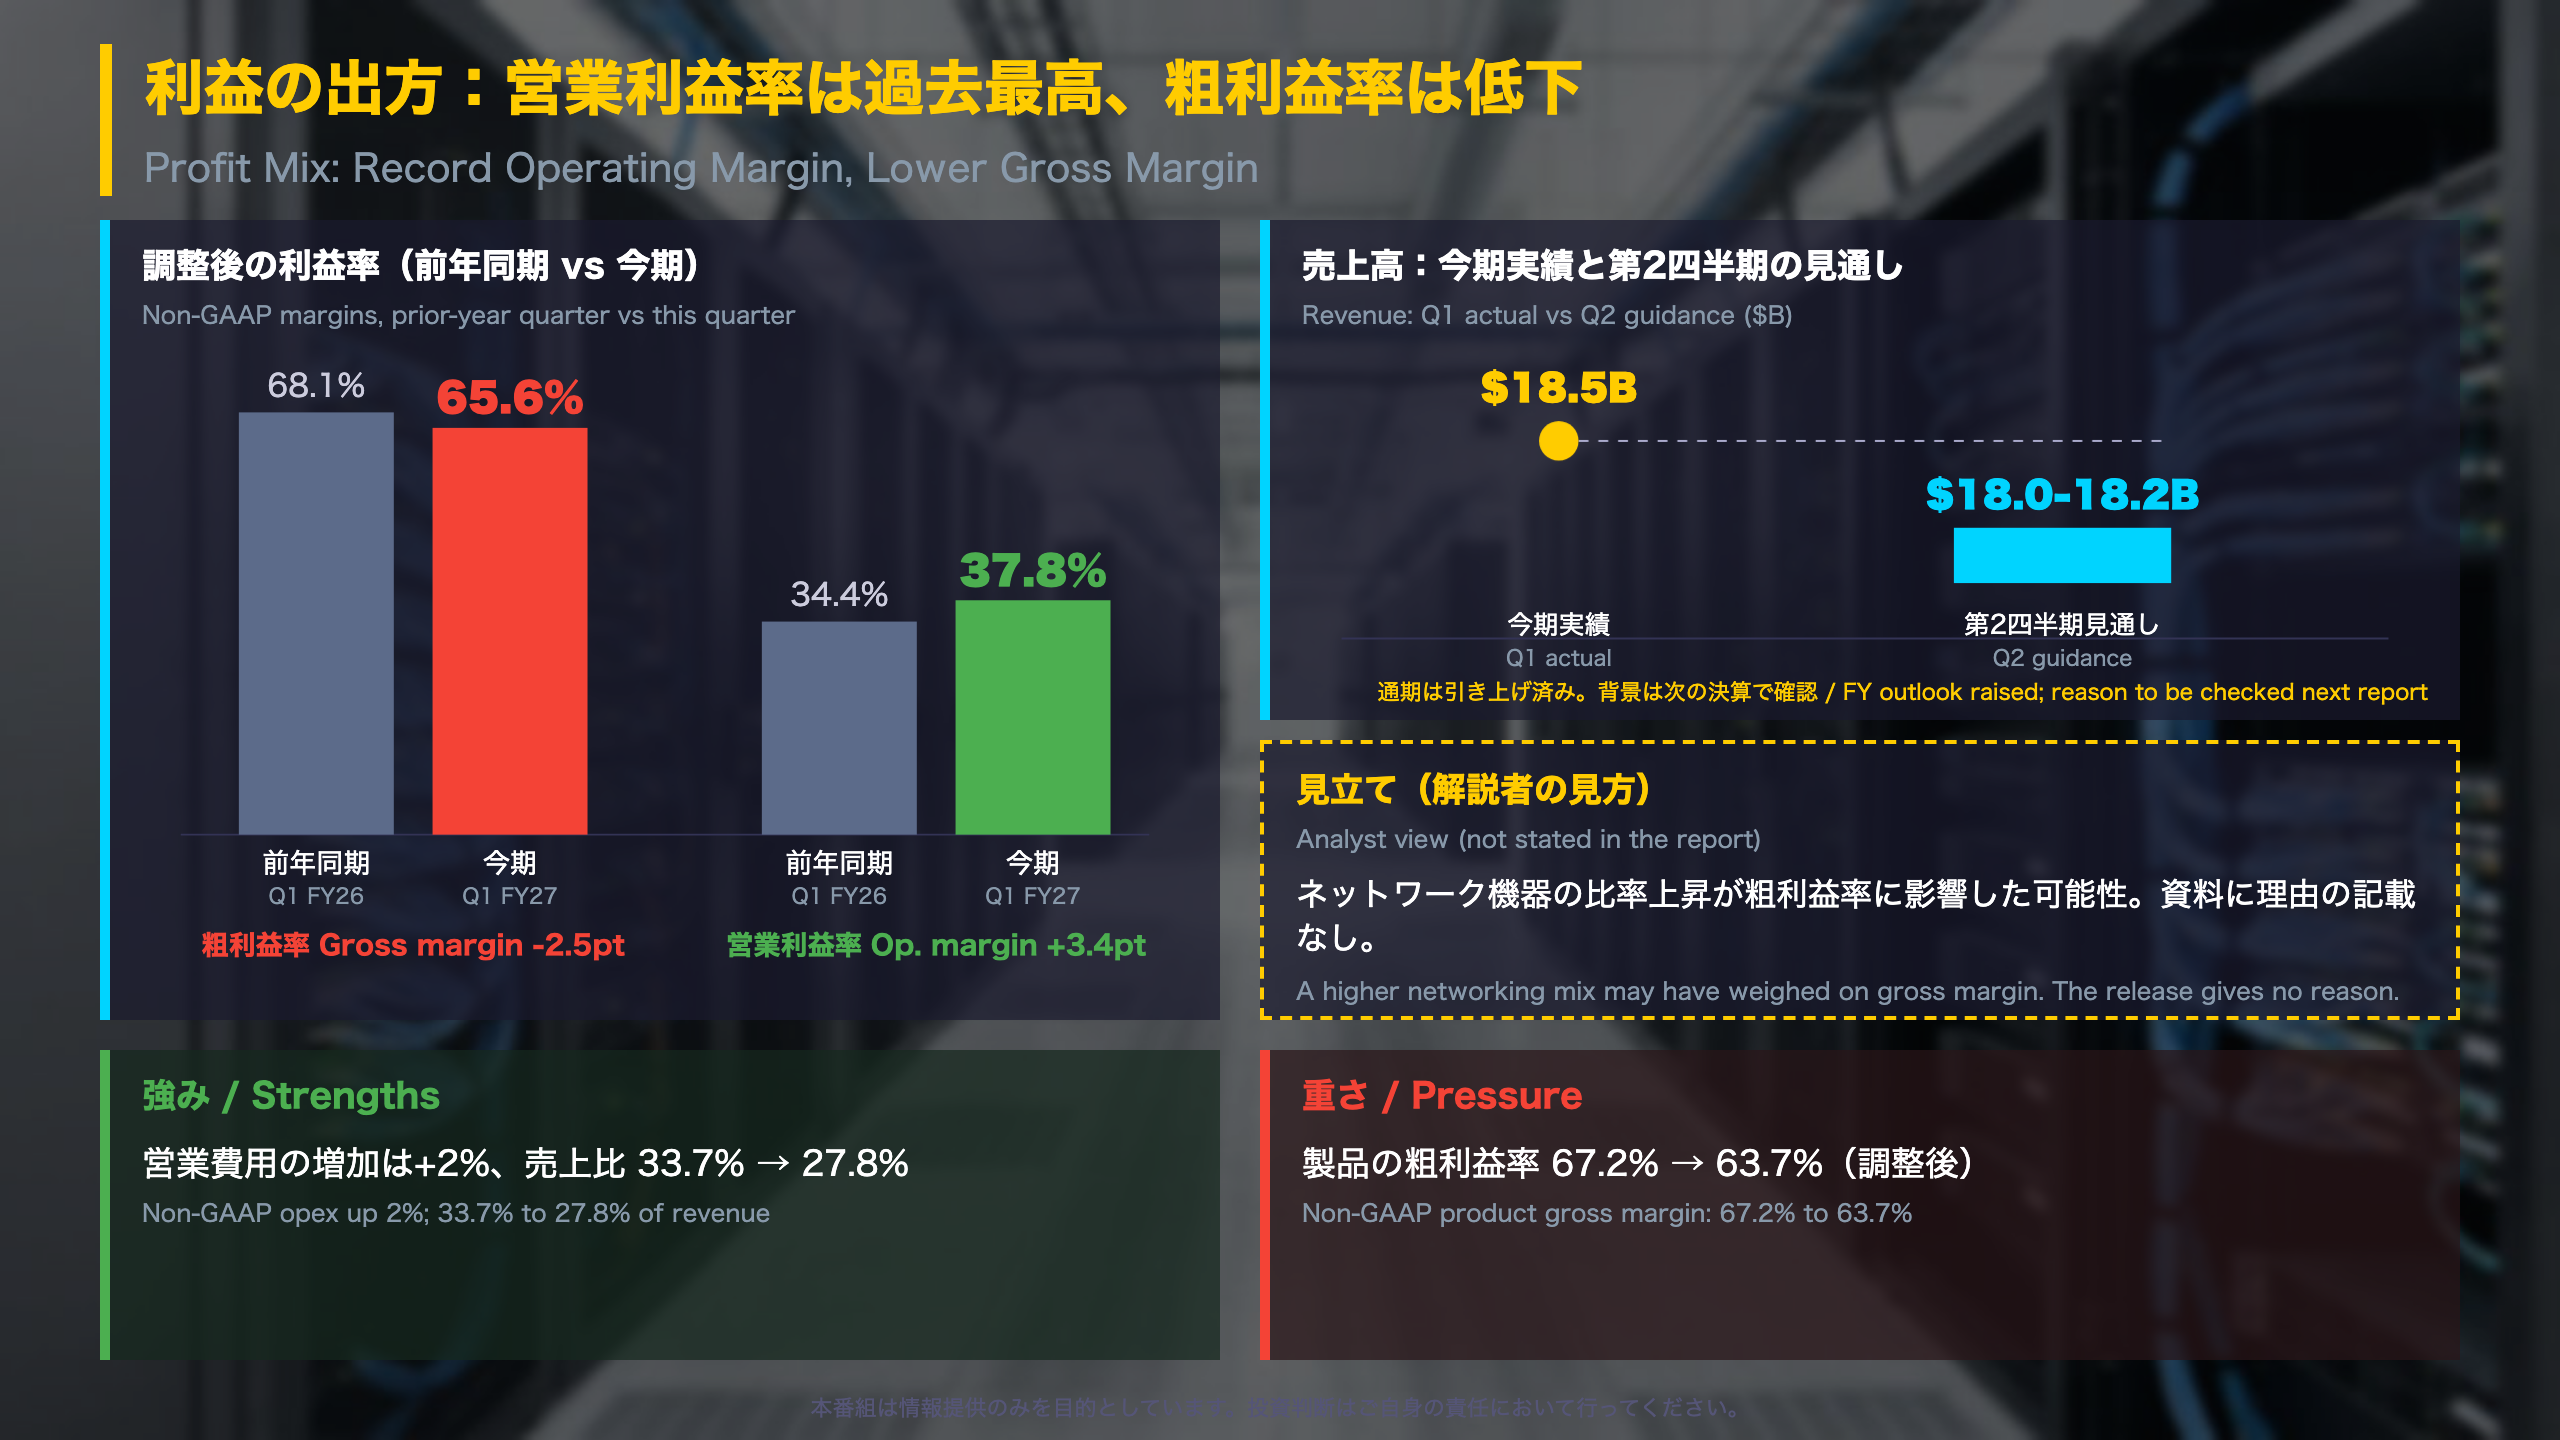
Non-GAAP margins (Q1 FY27 vs Q1 FY26): gross 65.6% vs 68.1%; product gross 63.7% vs 67.2%; services gross 72.9% vs 70.7%; operating expenses 27.8% vs 33.7% of revenue; operating margin 37.8% vs 34.4%.
The arithmetic of the margin gain
Operating margin rose 3.4 points even though gross margin fell 2.5 points, because operating expenses fell 5.9 points as a share of revenue. Non-GAAP operating expenses were $5.1B, up only 2% against 24% revenue growth. The CFO described this as “significant operating leverage.”
Cost items worth noting
GAAP restructuring charges fell to $28M from $147M, and stock-based compensation to $909M from $1,034M. Cisco says the restructuring plan announced on May 13, 2026 should be substantially complete by the end of fiscal 2027.
Guidance and what looks inconsistent
Q2 guidance: revenue $18.0-18.2B, non-GAAP gross margin 65-66%, operating margin 36-37%, EPS $1.34-1.36. All sit below this quarter’s levels, while the full-year outlook was raised to $74.8-75.8B revenue and $5.47-5.53 non-GAAP EPS. The release does not explain seasonality, so the reasons should be checked in the next report.
Why product margin matters
Product gross margin fell 3.5 points while services margin rose 2.2 points. A larger networking share could be one reason, but that is our view only. The release does not give a cause.
International context
US hardware vendors often discuss gross margin and operating expense discipline separately. Here the two moved in opposite directions, which is why both readings, constructive and cautious, are worth holding at once.
質疑で深める:先行きの裏付けと次の注目点
Checking the forward indicators
What is RPO? Remaining performance obligations are contracted amounts not yet recognized as revenue, so they act as a rough forward indicator. They include services contracts and are not directly comparable with quarterly sales.
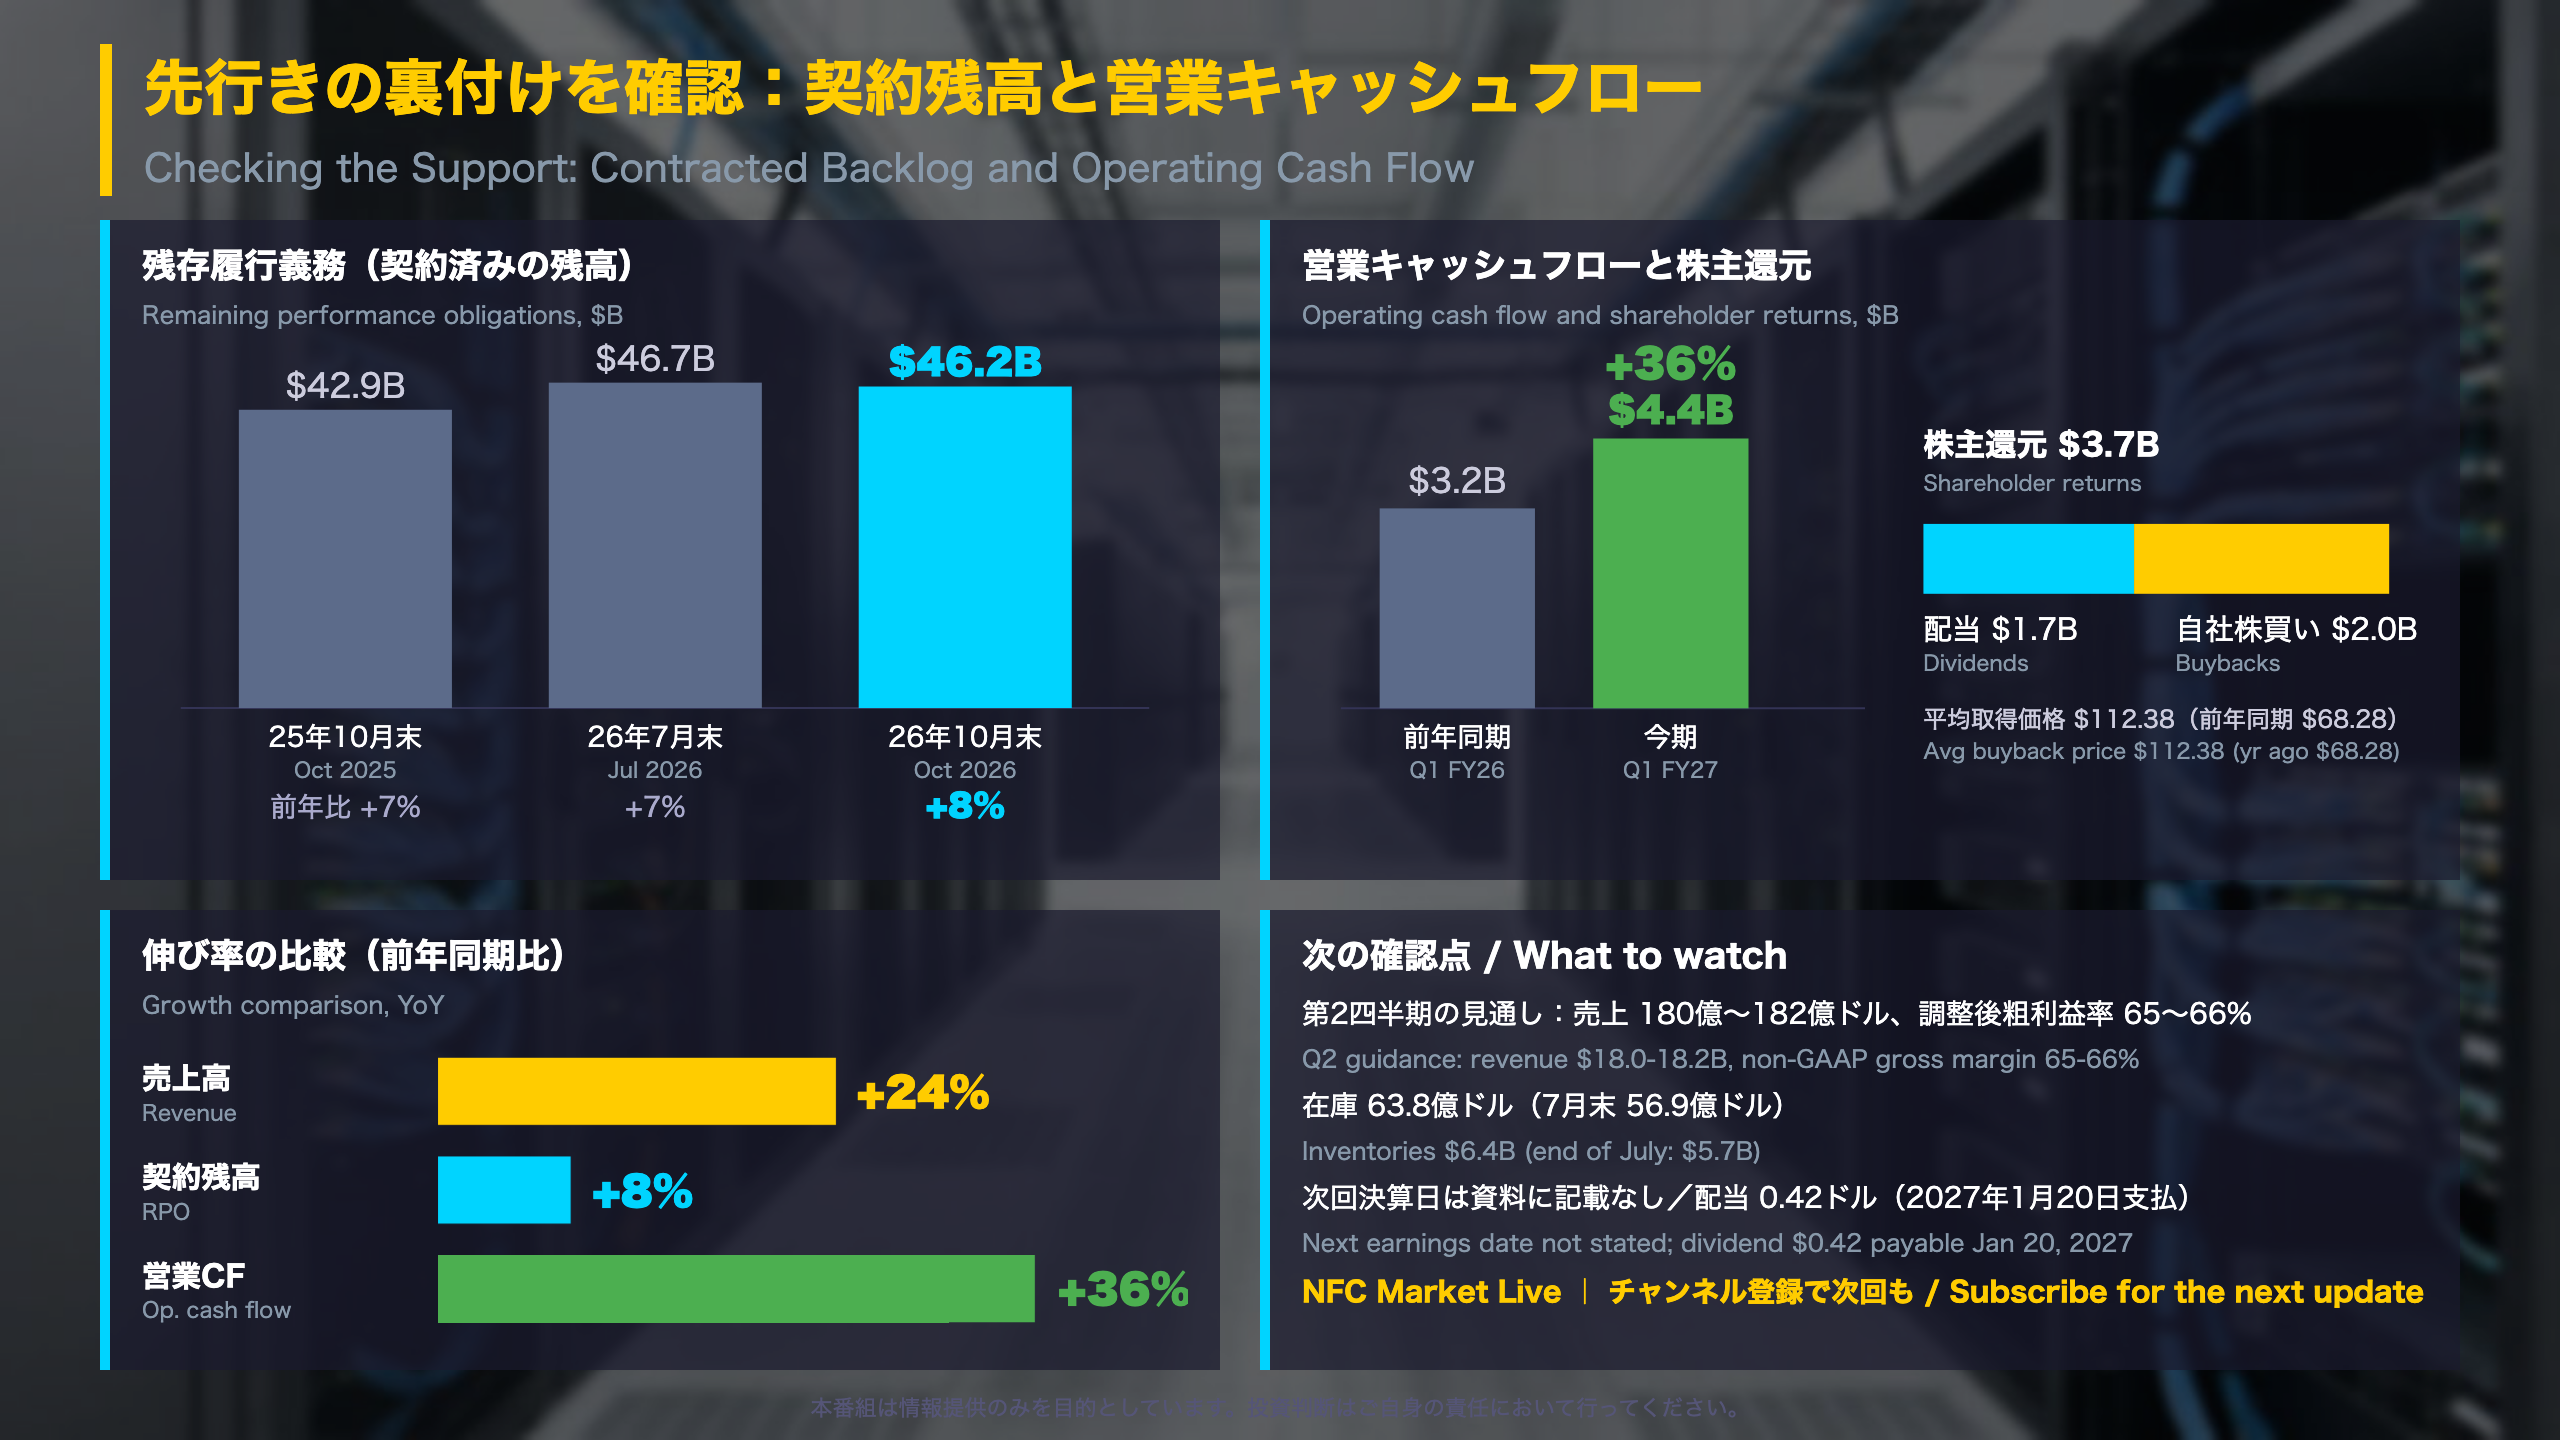
| RPO ($B) | Oct 2025 | Jul 2026 | Oct 2026 |
|---|---|---|---|
| Total | 42.9 | 46.7 | 46.2 |
| YoY | +7% | +7% | +8% |
| Product YoY | +10% | +9% | +7% |
| Services YoY | +4% | +6% | +9% |
Reading the data
Total RPO is up 8% YoY, but it slipped by roughly $0.6B from the end of July, and product RPO growth slowed from 9% to 7%. Services RPO accelerated. One quarter is too short to call a trend either way.
Cash and capital returns
- Operating cash flow $4.4B vs $3.2B a year ago; capex $0.5B vs $0.3B.
- Inventories $6.4B vs $5.7B at end-July; receivables $5.9B vs $7.5B.
- Returned $3.7B: $1.7B in dividends and $2.0B in buybacks (about 18M shares at an average $112.38, versus 29M shares at $68.28 a year earlier). $6.1B of authorization remains.
Two readings
- Constructive: cash generation outpaced revenue growth.
- Cautious: inventory rose and backlog was slightly lower sequentially, so durability of demand remains to be proven.
What to watch
Q2 guidance (revenue $18.0-18.2B, non-GAAP gross margin 65-66%, operating margin 36-37%) versus actual results. The next earnings date is not given in the release; the next dividend of $0.42 is payable January 20, 2027. For readers used to Japanese corporate disclosure, note that US companies report quarterly with explicit guidance ranges, so the guidance-versus-actual comparison is a standard checkpoint.
Disclaimer: This article is for informational purposes only. All investment decisions are made solely at your own risk.