This article was automatically generated by the NFC Market Live AI analysis system. (Updated: 2026-11-13 06:18 JST)
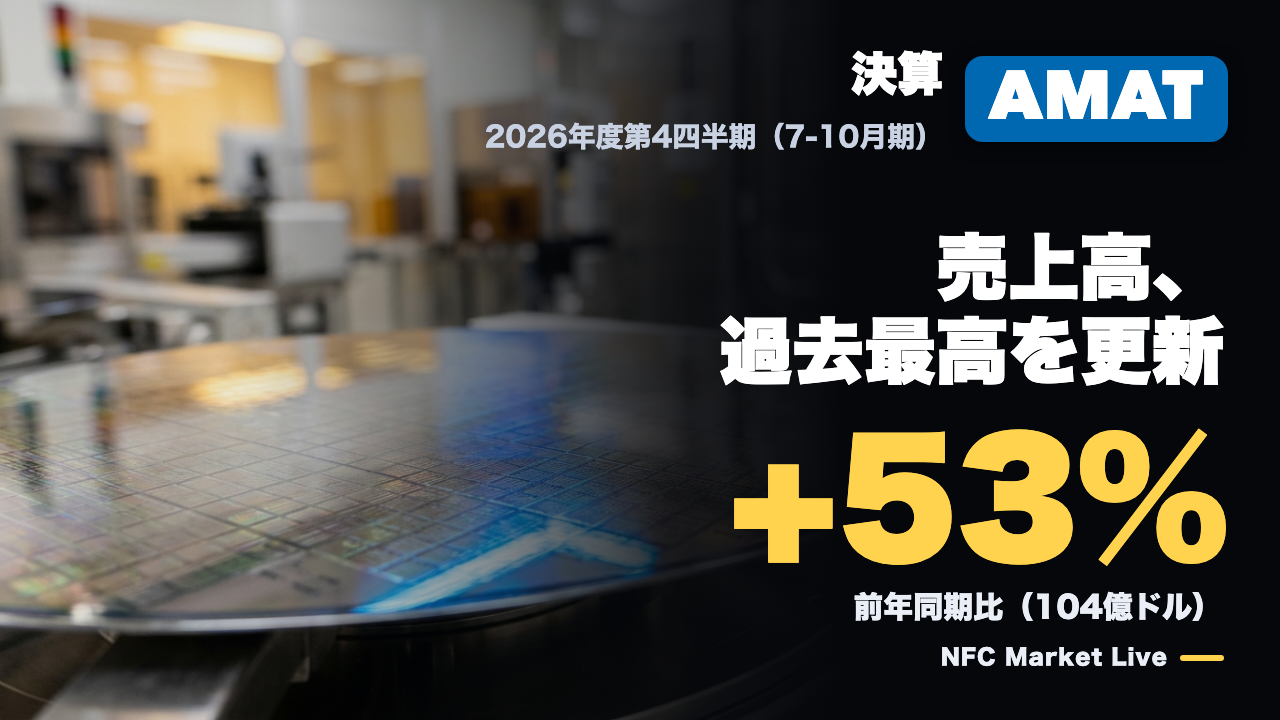
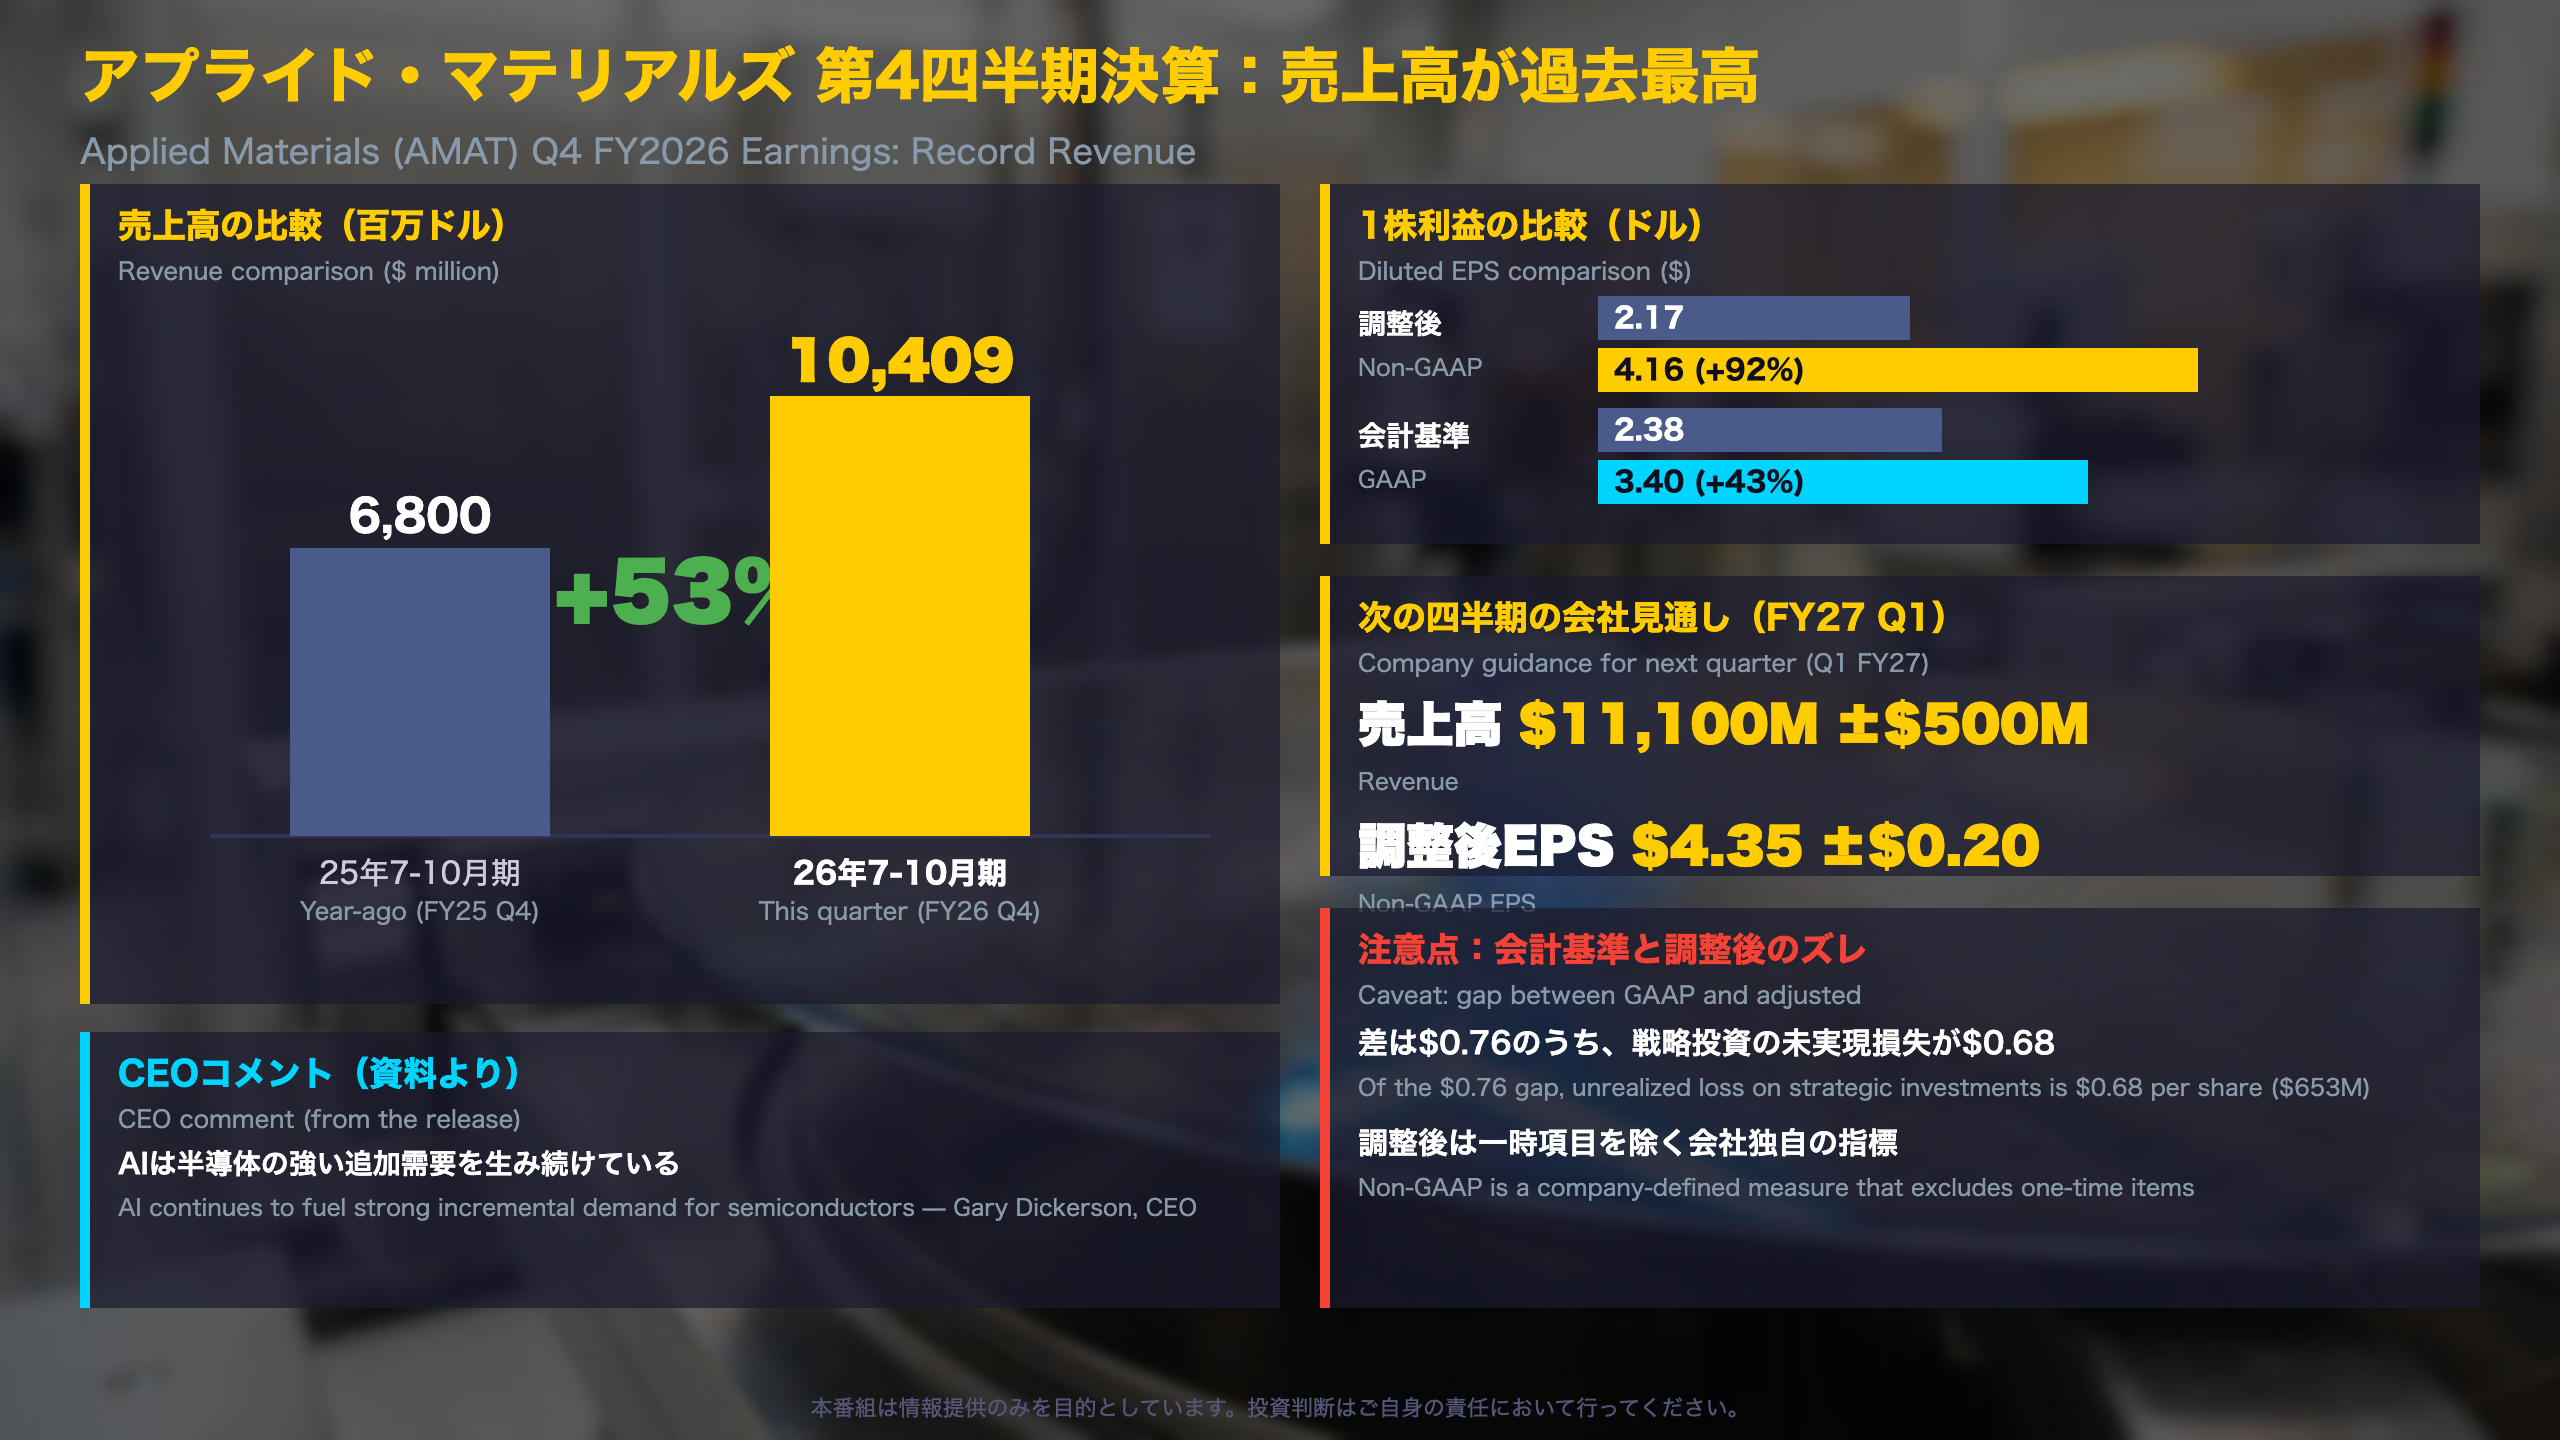
📊 Applied Materials (AMAT) reported record Q4 FY2026 revenue of $10.4B, up 53% year over year, with non-GAAP EPS of $4.16, up 92%.
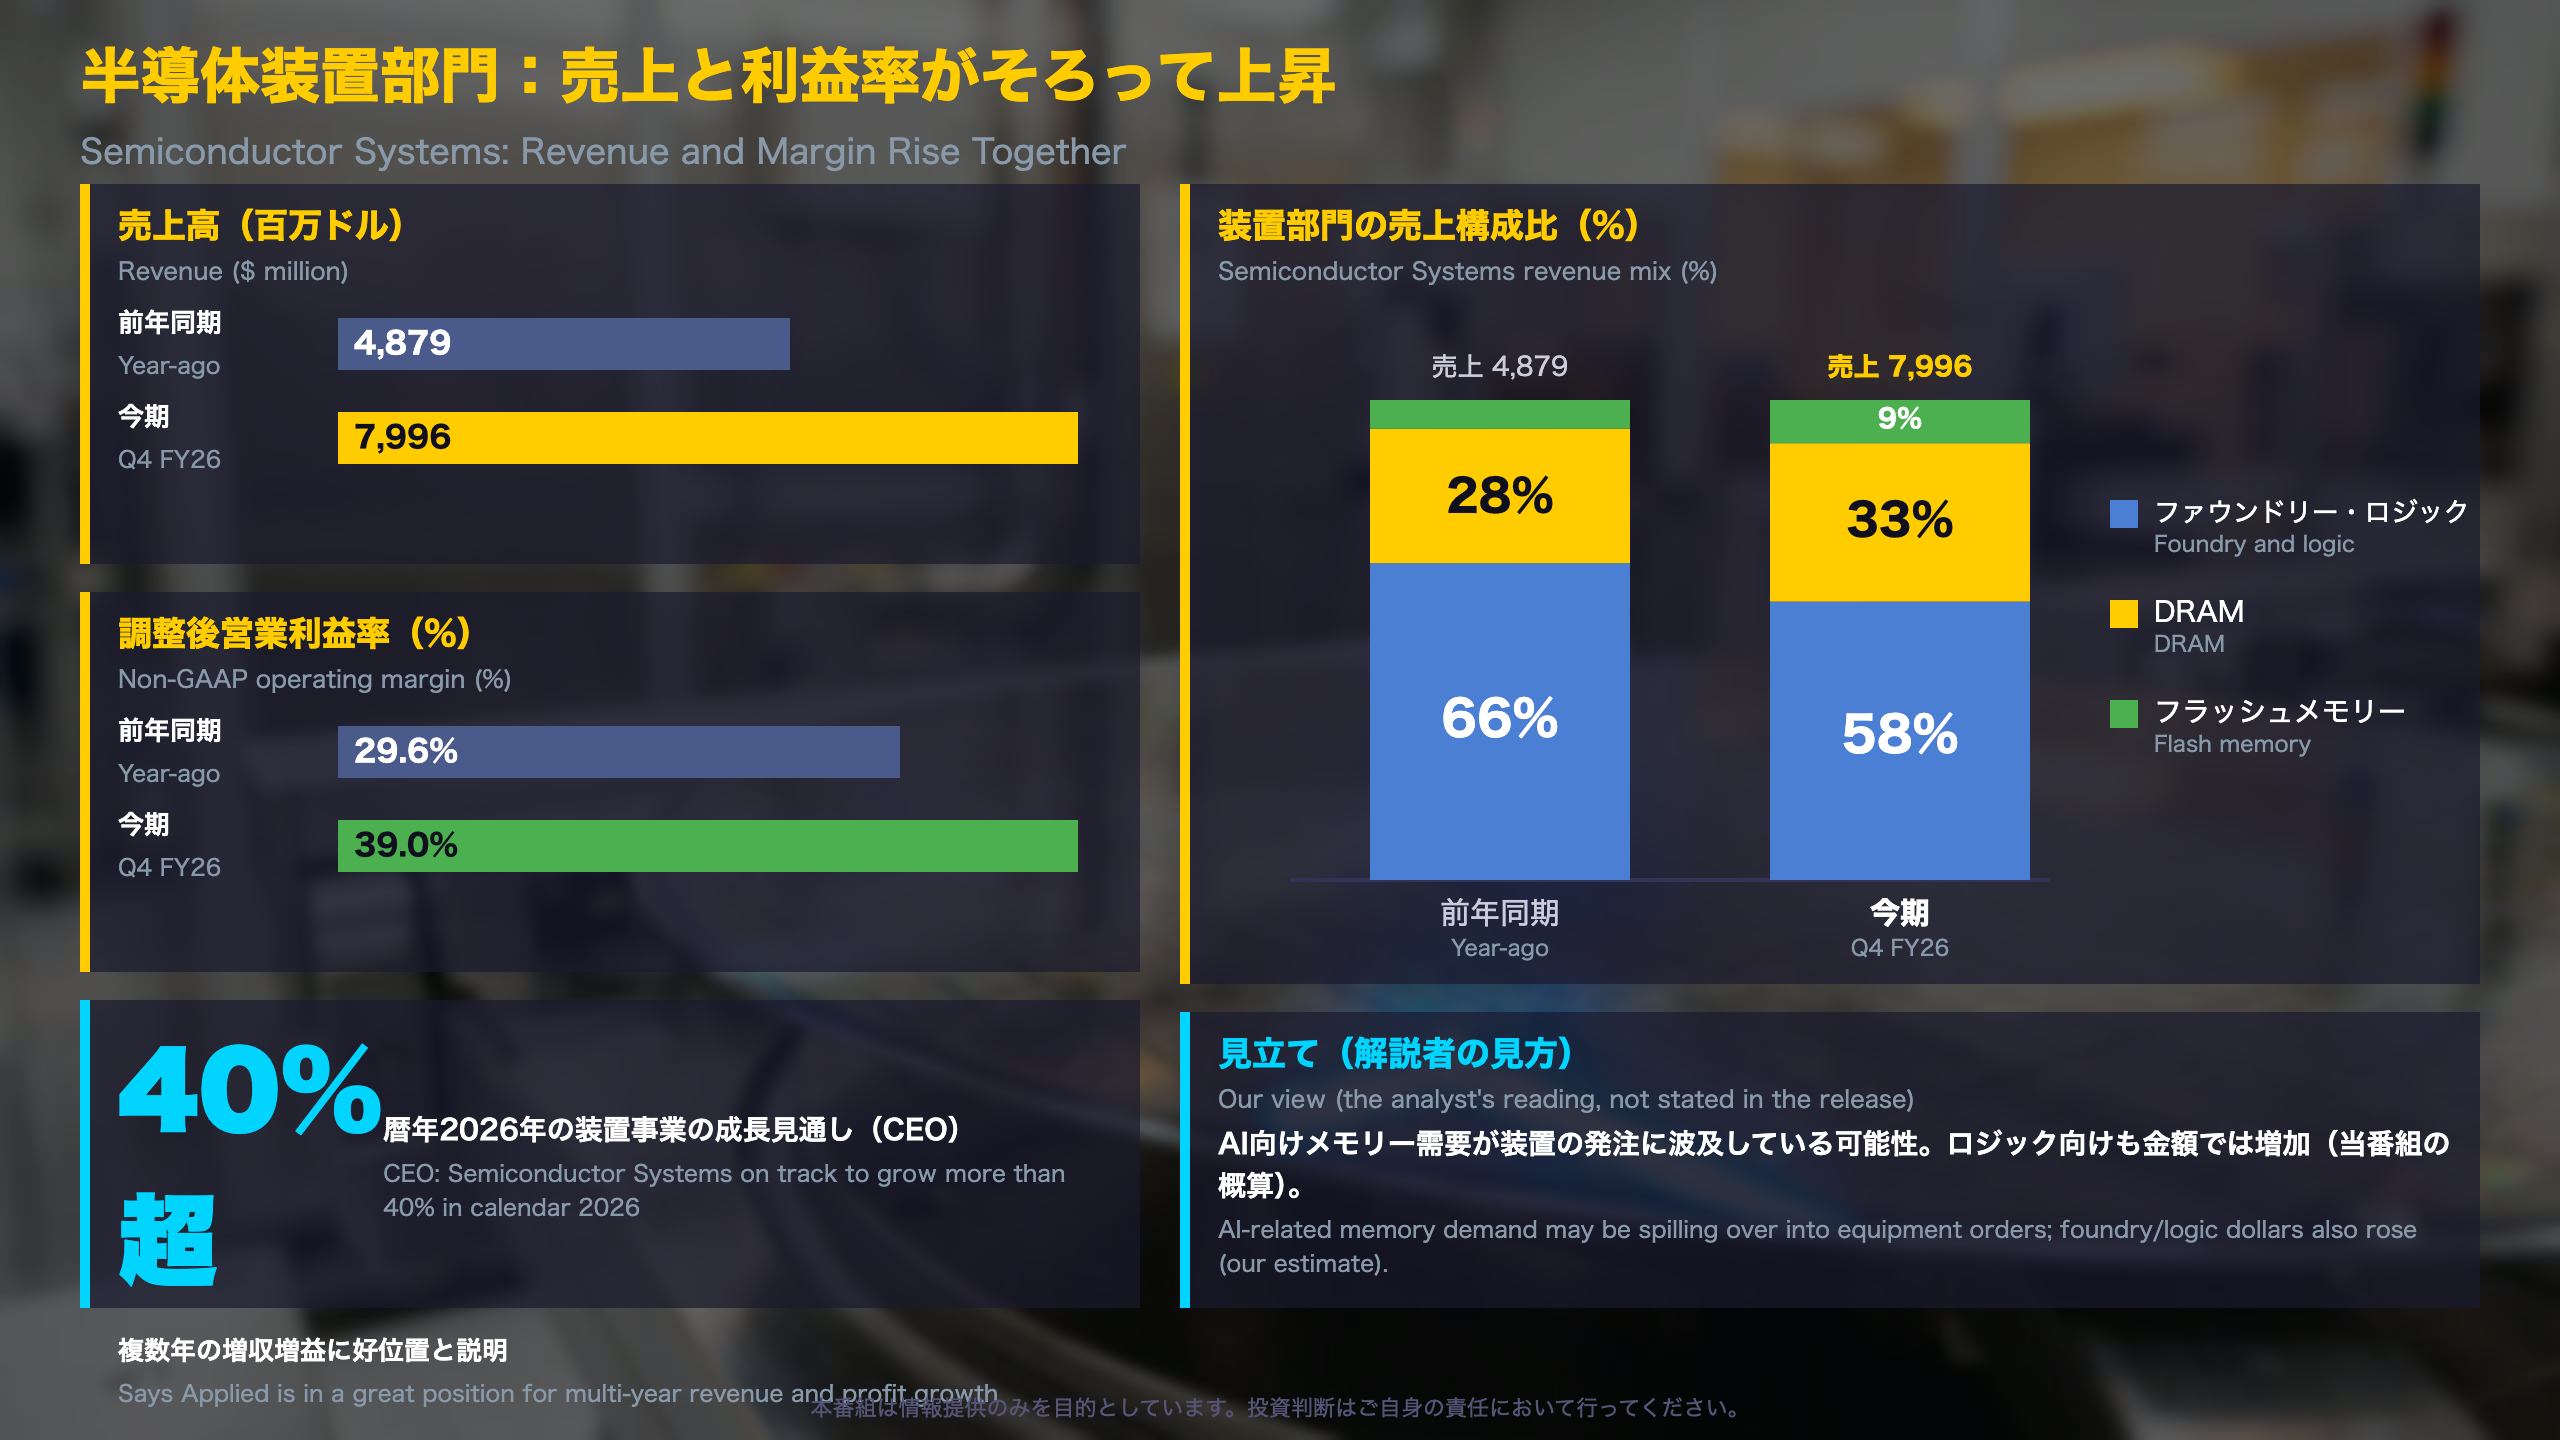
📈 Semiconductor Systems non-GAAP operating margin rose to 39.0% from 29.6% a year earlier. Guidance for next quarter: revenue of $11.1B ±$0.5B and non-GAAP EPS of $4.35 ±$0.20.
⚠️ On the other hand, GAAP EPS was $3.40, with unrealized losses on strategic investments explaining most of the gap. Accounts receivable also rose sharply.
💡 The release does not state the next earnings date. Watch revenue versus the guided range, segment margins and receivables.
第1部 サマリー:売上高は過去最高、利益の見方は二面
Overview
Applied Materials (NASDAQ: AMAT) filed its fiscal fourth-quarter 2026 results as an SEC Form 8-K (Exhibit 99.1) on November 12, 2026. The quarter covers late July to late October. Applied is one of the largest suppliers of wafer fabrication equipment (WFE), the machines chipmakers use to build semiconductors.
Key numbers
- Revenue: $10,409M, up 53% from $6,800M a year earlier
- Non-GAAP gross margin: 50.6%, up 250 basis points
- Non-GAAP operating margin: 35.3% versus 28.6%
- Non-GAAP EPS: $4.16 versus $2.17; GAAP EPS $3.40 versus $2.38
Why GAAP and non-GAAP differ
Non-GAAP is a company-defined measure that strips out items such as acquisition-related charges, restructuring and gains or losses on strategic investments. This quarter the largest single item was a $653M unrealized loss on strategic investments, worth $0.68 per share. Investors comparing US and Japanese reporting should note that Japanese companies mostly report under J-GAAP or IFRS, and adjusted metrics are less standardized.
Balanced read
The strength is broad: record revenue, record operating income and a higher margin. The caveat is that GAAP earnings include investment valuation swings that the adjusted figure removes. The release does not state the next earnings date, and this program makes no market forecast. Watch whether next-quarter revenue lands in the guided range of $11.1B ±$0.5B.
第2部① 半導体装置部門:売上と利益率がそろって上昇
Semiconductor Systems in detail
Semiconductor Systems is Applied’s equipment segment and generated $7,996M of the company’s $10,409M quarterly revenue. Non-GAAP gross margin was 55.2% (52.8% a year ago) and non-GAAP operating income was $3,115M (versus $1,442M). The company recast prior-period figures after moving its 200-millimeter equipment business into this segment and fully allocating corporate support costs.
Mix shift
- Foundry and logic: 58% of segment revenue (66% a year ago)
- DRAM: 33% (28%)
- Flash: 9% (6%)
By our rough calculation, foundry and logic revenue still rose from about $3.2B to about $4.6B. A falling share does not mean falling sales.
Other disclosures
Applied Global Services, the installed-base service business, grew revenue to $1,896M with a 30.5% operating margin. The new EPIC Center in Silicon Valley is a shared R&D facility; Intel joined as a founding partner and KIOXIA, Besi and UCLA also signed on. For readers following Japanese supply chains, note that Japan accounted for $619M of quarterly revenue, and KIOXIA is a Japanese memory maker.
Balanced view
The margin gains are a clear positive. The offsetting point is that the CEO’s ‘more than 40 percent’ growth target for calendar 2026 is management’s own outlook, and the release lists a concentrated customer base and export controls among risk factors. This program offers no market forecast.
第2部② 利益の中身とキャッシュ:強いキャッシュと、確認したい売掛金
From GAAP to adjusted EPS
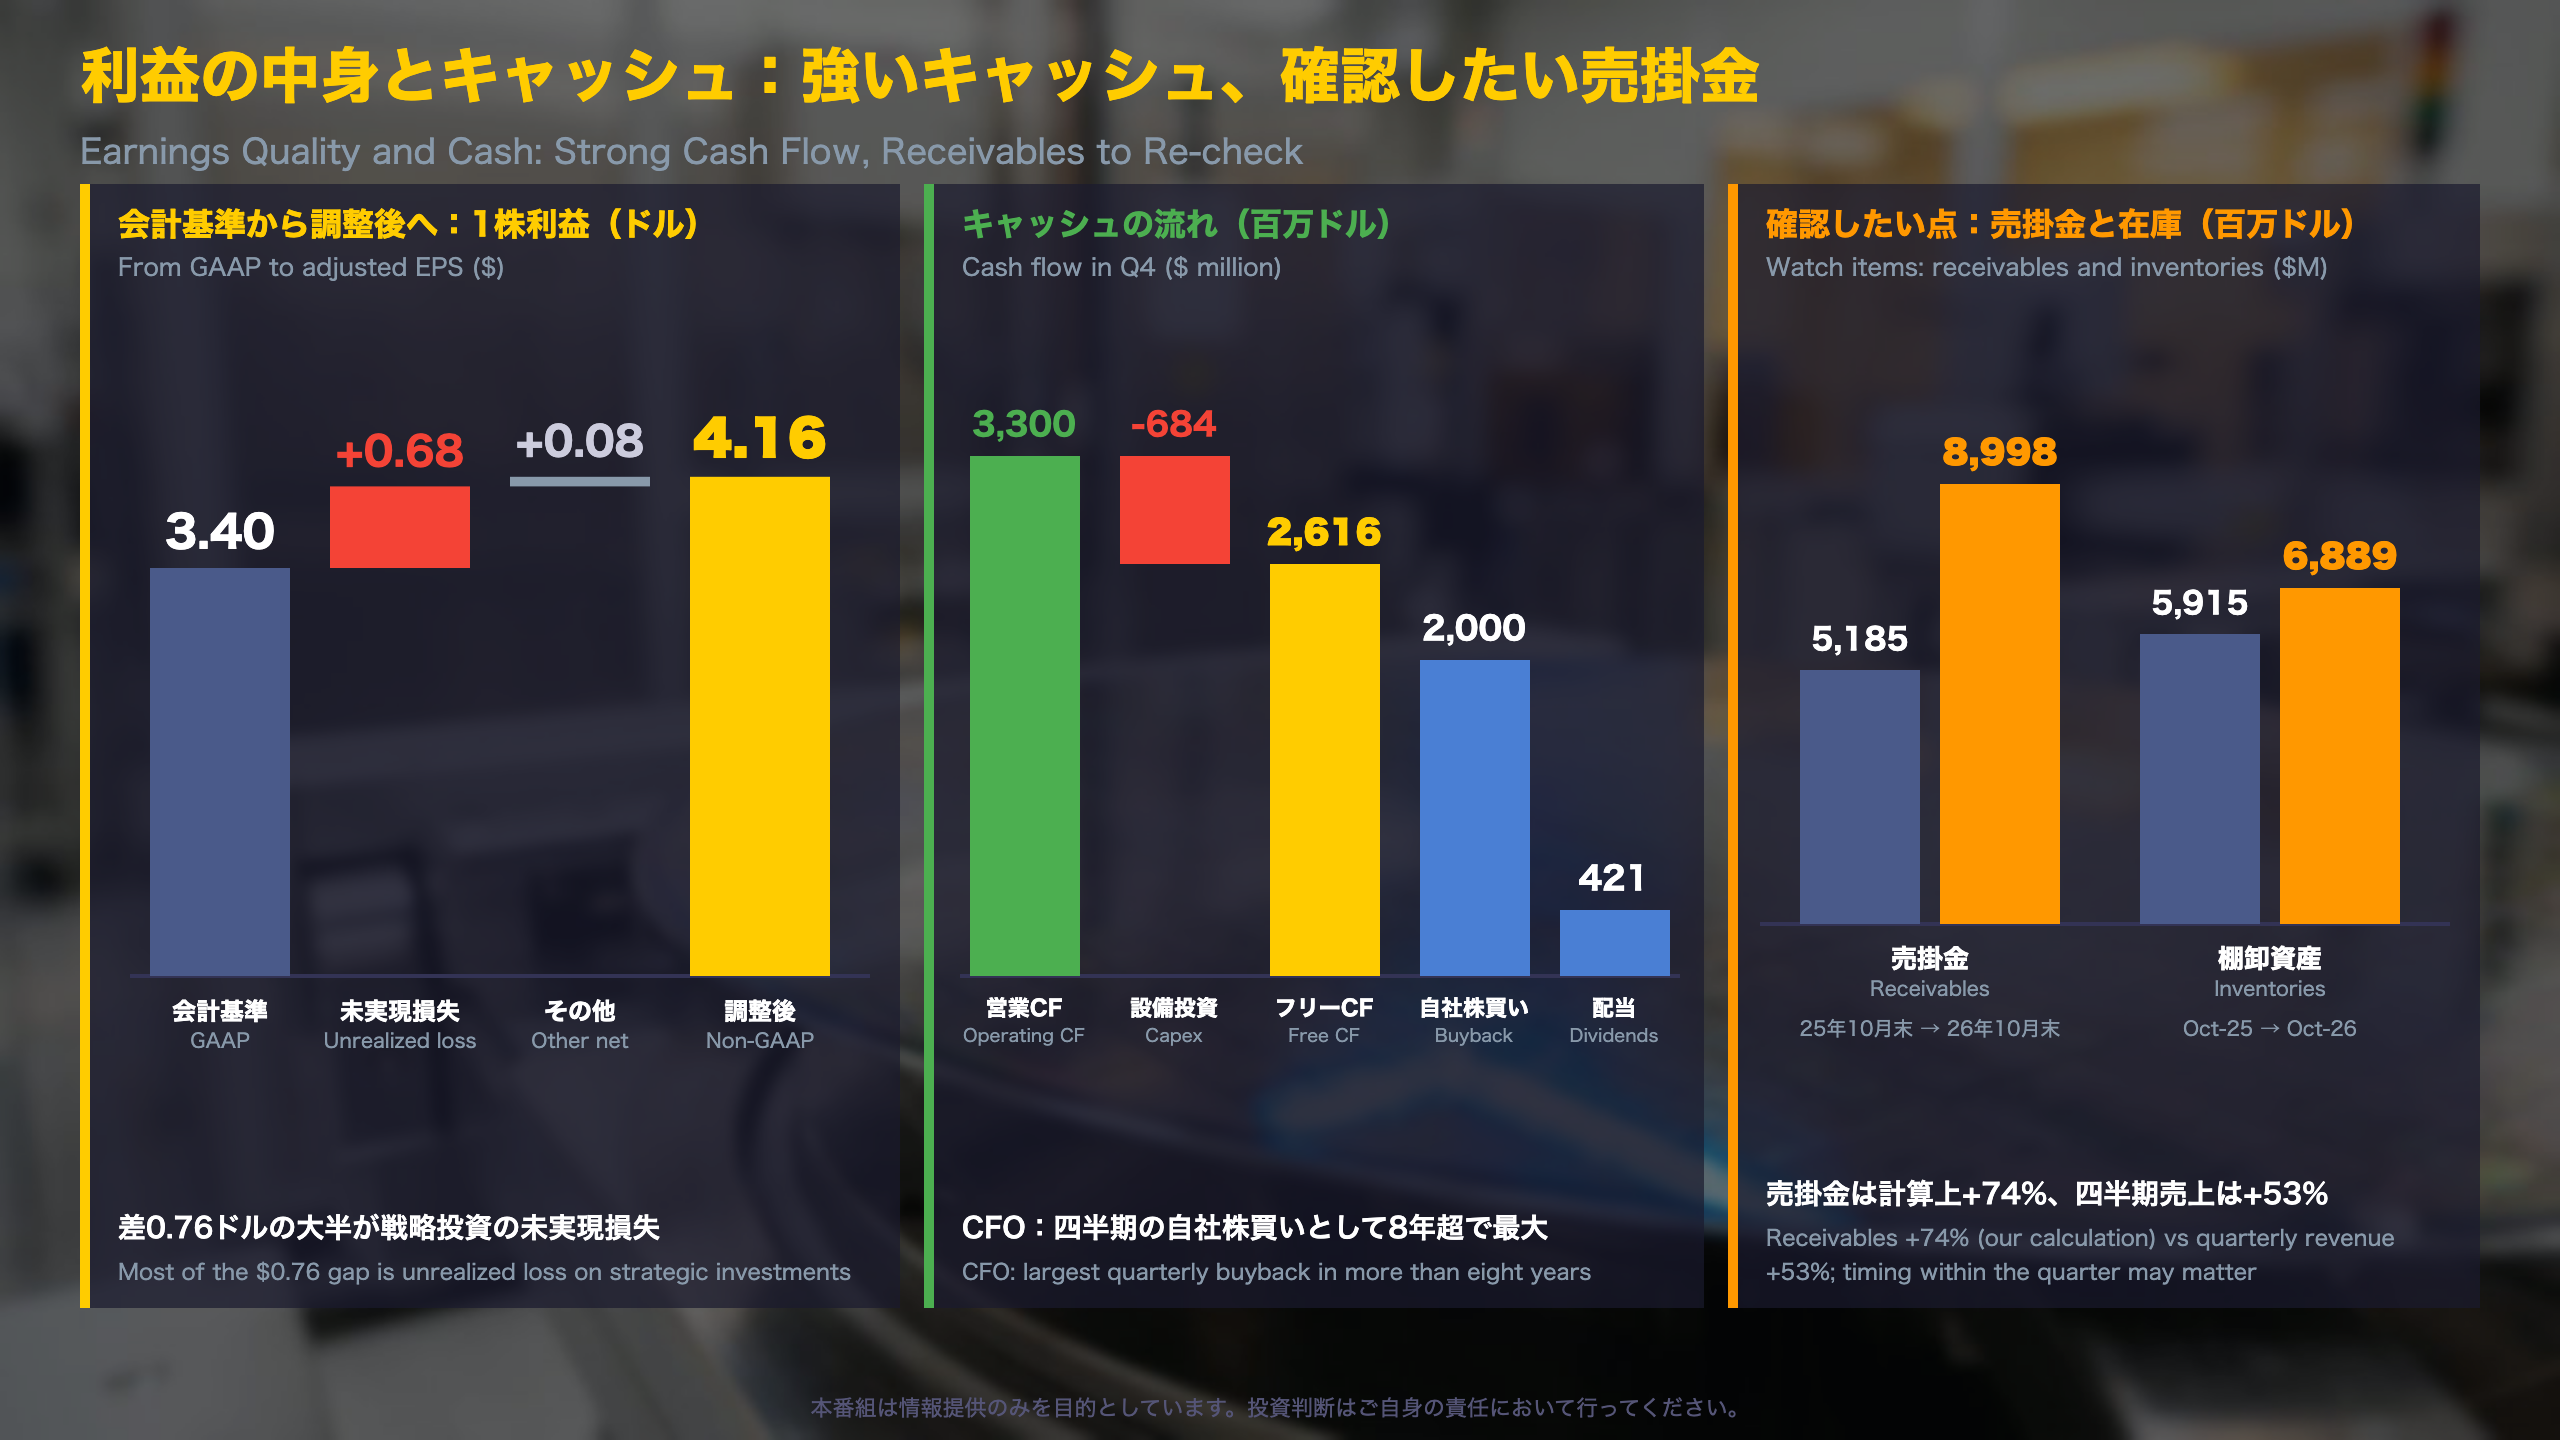
The reconciliation table in the release bridges $3.40 of GAAP EPS to $4.16 of non-GAAP EPS. The biggest item is an unrealized loss on strategic investments of $0.68 per share ($653M). Smaller items include acquisition charges ($0.02 plus $0.01 of integration costs), realized losses on strategic investments ($0.02), tax effects of intra-entity intangible transfers (+$0.06) and a tax item of -$0.03. ‘Interest and other income (expense), net’ was a $513M expense versus $626M of income a year earlier, which is why GAAP profit swings more than operating profit.
Cash generation
Operating cash flow was $3,300M and capex $684M, leaving free cash flow of $2,616M versus $2,043M a year earlier. Buybacks were $2,000M (versus $851M) and dividends $421M. The CFO described it as the largest quarterly buyback in more than eight years. For comparison with Japanese companies, buybacks of this scale in a single quarter are rare in Japan, where shareholder returns are more often paced by annual announcements.
Balance sheet watch items
Accounts receivable rose to $8,998M from $5,185M, about 74% by our calculation, against 53% revenue growth in the quarter. Inventories rose to $6,889M from $5,915M and short-term debt to $1,299M from $100M. Timing of shipments within the quarter could explain part of this, and the release gives no explanation, so we treat it as a point to re-check, not a conclusion.
This program does not offer market forecasts.
第3部 質疑で深める:見通し、リスク、次の注目点
Reading the guidance
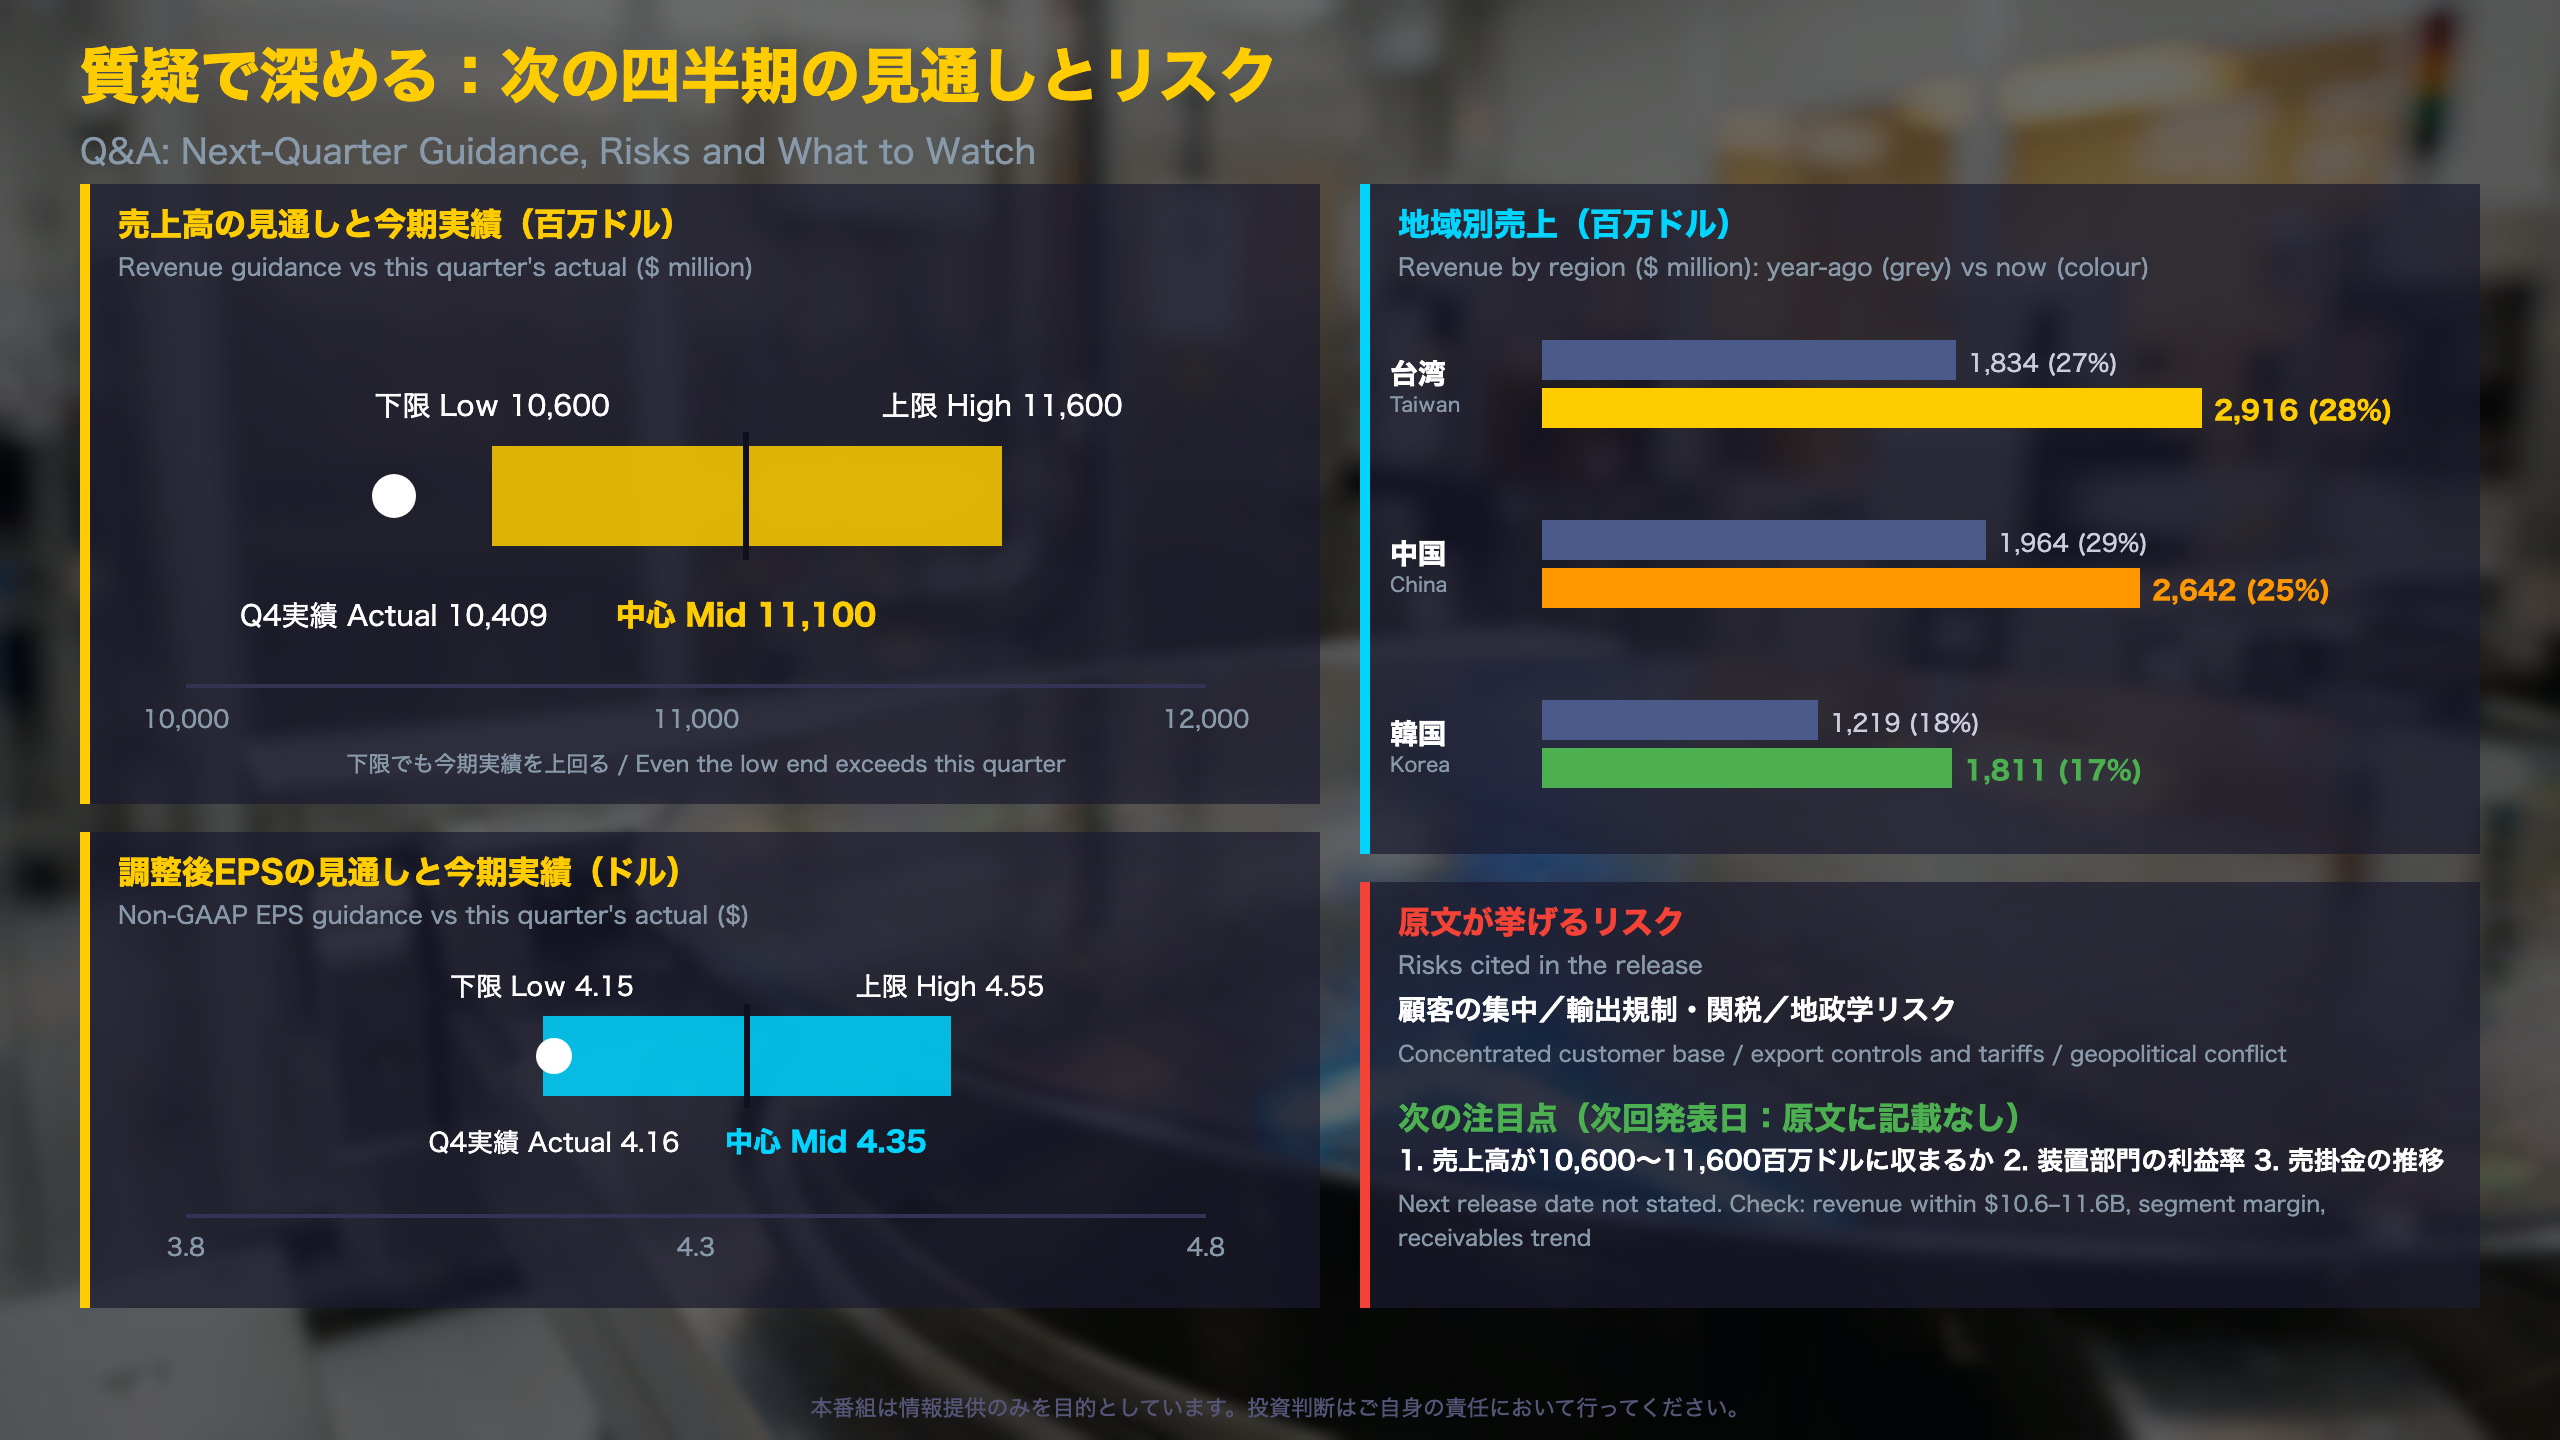
For fiscal Q1 2027, Applied guides revenue to $11,100M ±$500M and non-GAAP EPS to $4.35 ±$0.20. The simple range is $10.6–11.6B and $4.15–4.55. The revenue floor sits above this quarter’s $10,409M, while the EPS floor is roughly equal to this quarter’s $4.16. The EPS guide includes a $0.04 tax benefit and excludes $0.01 of acquisition-related charges. Guidance in US earnings releases is a company outlook, not a commitment, and it is distinct from analyst consensus, which this program does not use.
Regional mix
Taiwan was the largest region at $2,916M (28%), followed by China at $2,642M (25%, versus 29% a year earlier) and Korea at $1,811M. China’s dollar sales rose from $1,964M, so the lower share reflects faster growth elsewhere. Japan was $619M (6%). Revenue rose in every region listed.
Risk language
The forward-looking statements section cites a concentrated customer base, export controls and license requirements, tariffs and geopolitical conflict. Separately, the fiscal-year results include a $253M charge to settle an export controls compliance matter with the US Commerce Department’s Bureau of Industry and Security. Japanese readers can think of this as akin to the foreign-exchange and export-control (FEFTA) compliance burden facing Japanese equipment makers.
What to check next
The release gives no date for the next earnings report. Useful checkpoints are revenue within $10.6–11.6B, non-GAAP EPS within $4.15–4.55, the Semiconductor Systems margin and receivables. This program offers no market forecast.
Disclaimer: This article is for informational purposes only. All investment decisions are made solely at your own risk.