This article was automatically generated by the NFC Market Live AI analysis system. (Updated: 2026-11-13 01:15 JST)
📊 A deep dive into Nebius (NBIS) Q3 2026 results.
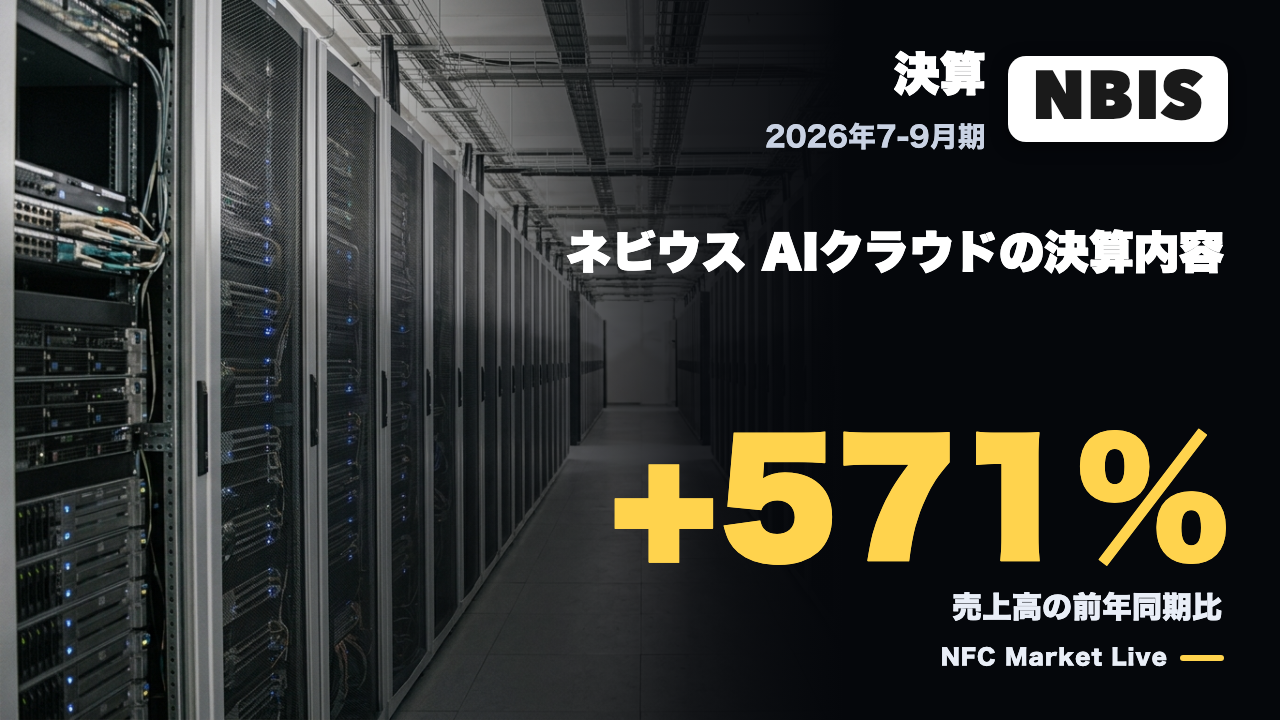
Revenue was $980.8M, up 571% year over year, and adjusted EBITDA turned positive at $465.8M.
⚠️ About $325M of revenue is described by the company as non-recurring; capex was $7.3B and operating cash flow was negative.
💡 Prepayments covered over 100% of capex on Q3 deals. For 2027 the company guides to $12-13B revenue and pre-tax breakeven in Q4. 2026 revenue is now expected at the low end of the range.
📈 We weigh the strength of growth against funding and delivery risks, using only the company’s own figures.
Nebius 2026年7-9月期決算サマリー
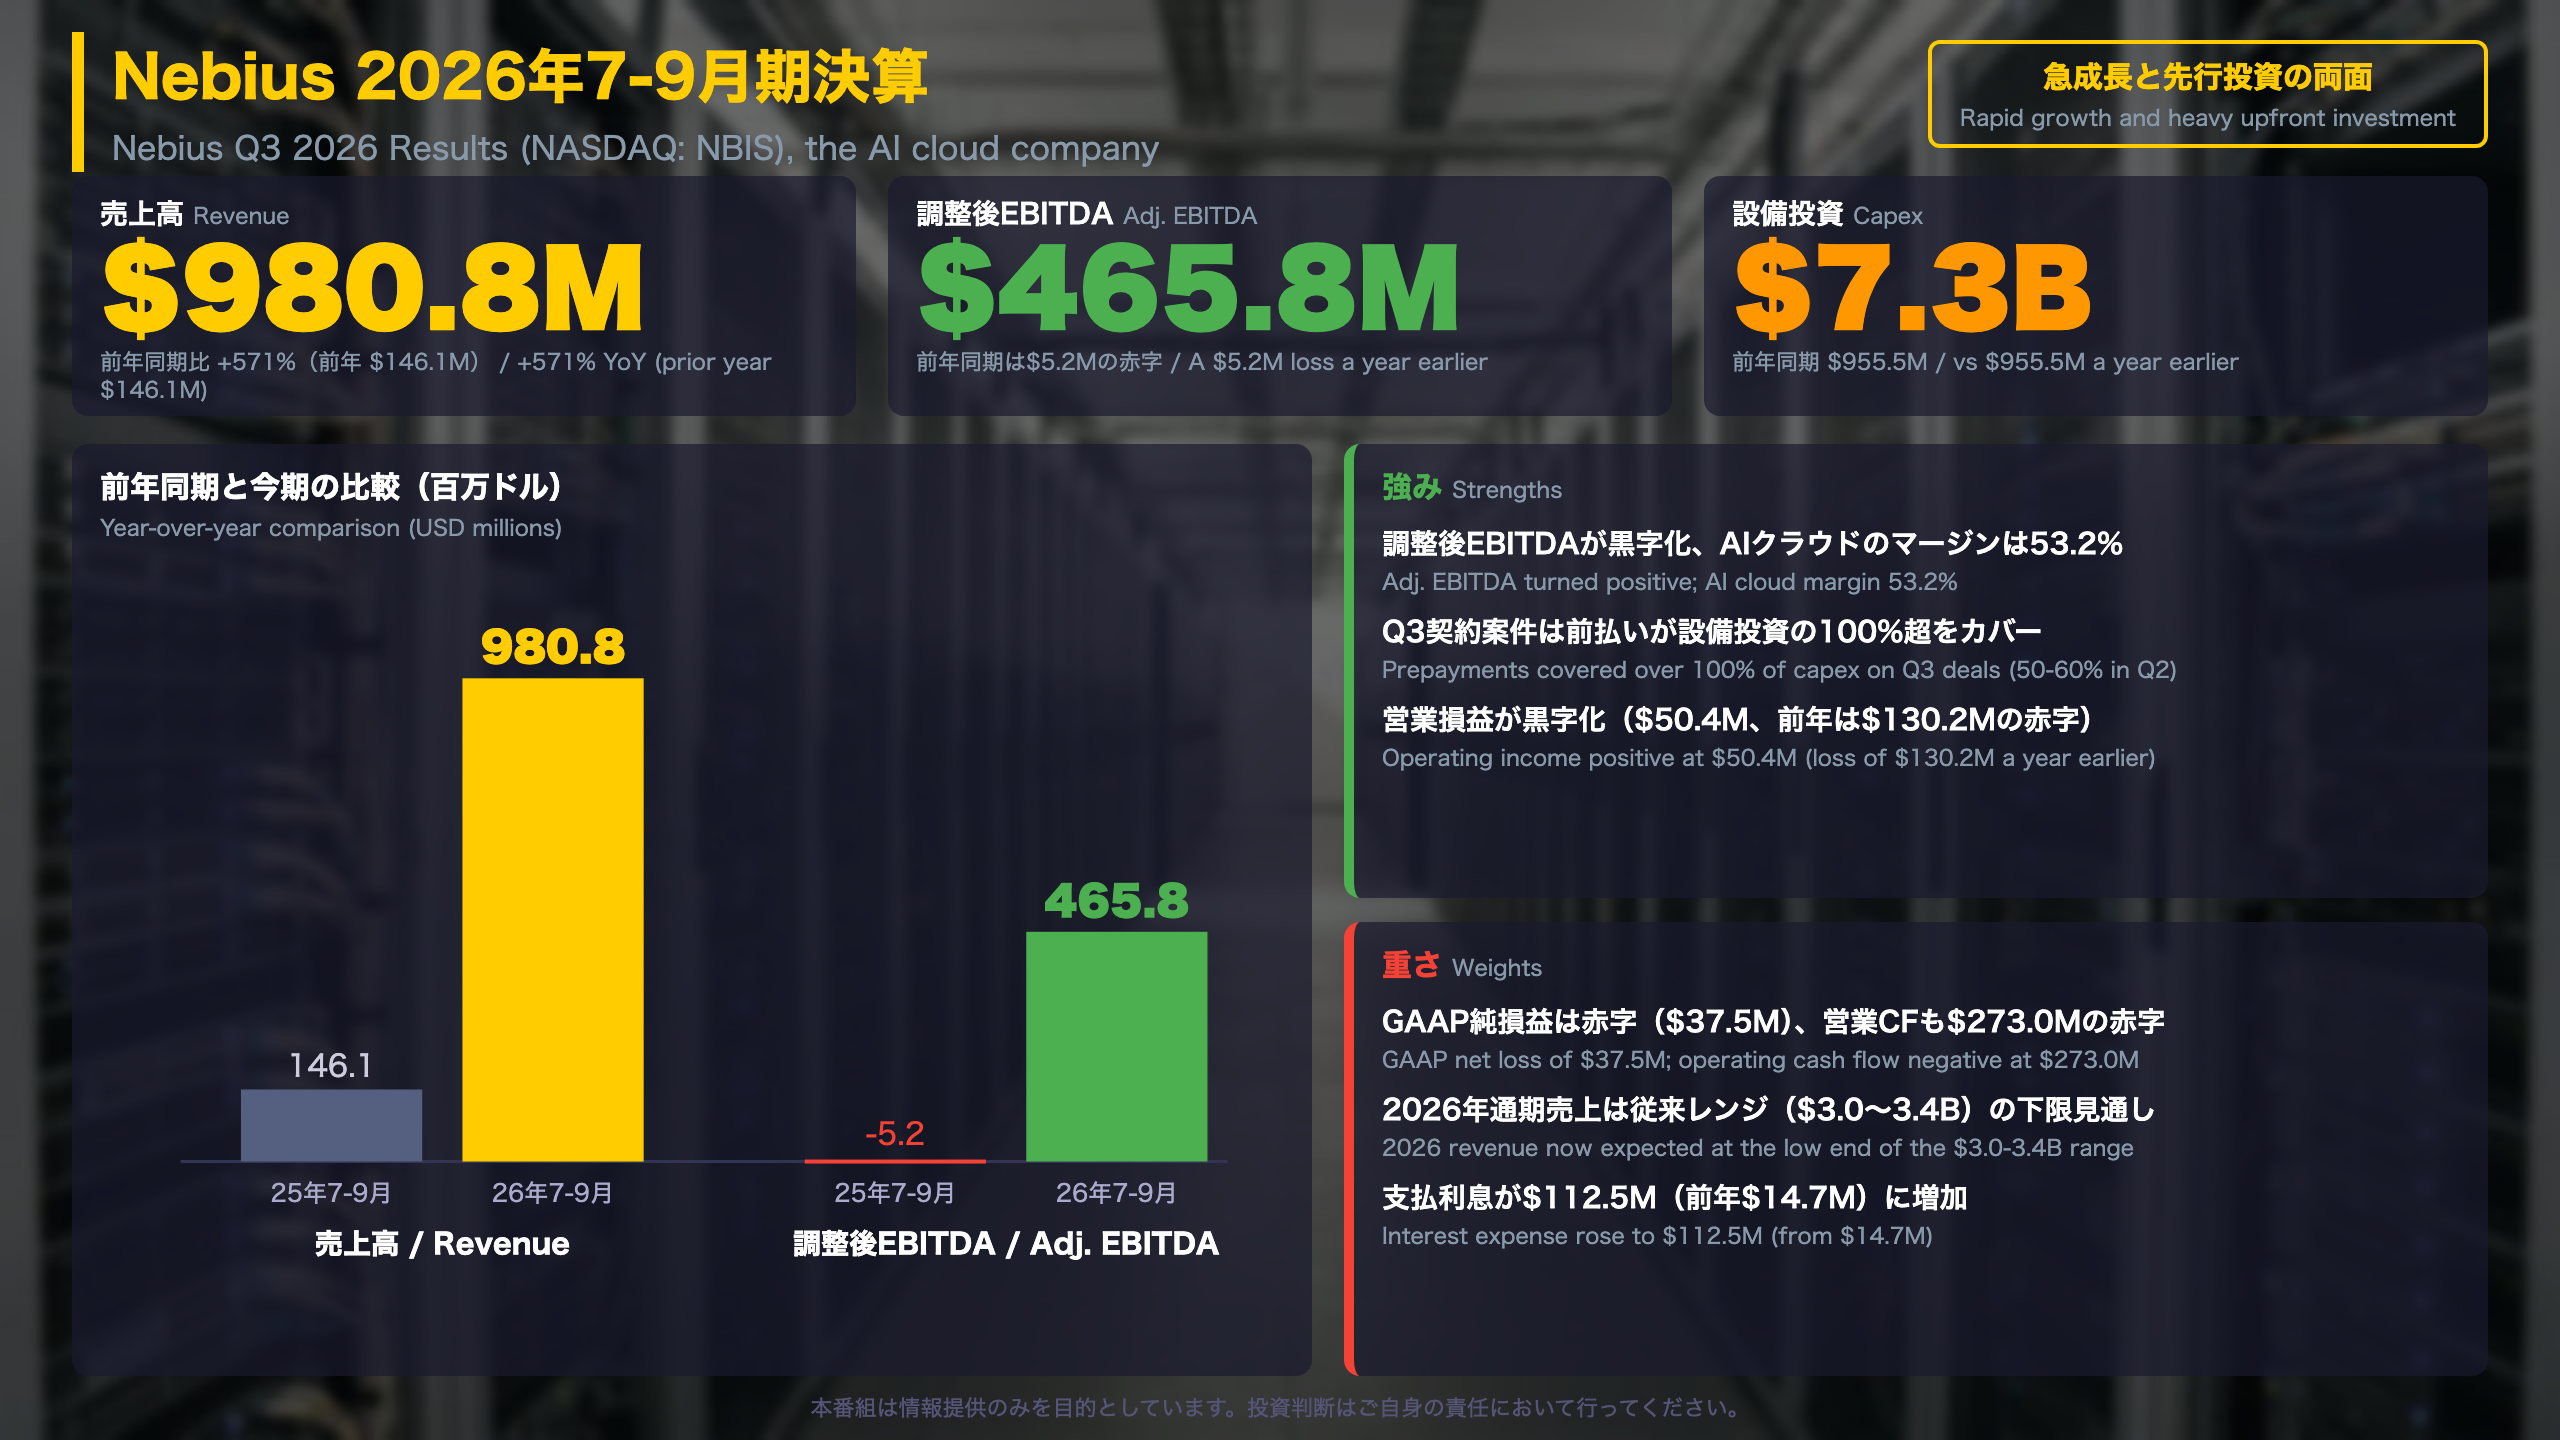
Nebius Q3 2026: Reading Past the Headline
Who reports this? Nebius Group N.V. (NASDAQ: NBIS) is an Amsterdam-headquartered AI cloud company. As a foreign private issuer it furnishes results on Form 6-K and files annual reports on Form 20-F, so these are unaudited quarterly figures, not a US 10-Q.
Headline table (USD millions)
| Metric | Q3 2025 | Q3 2026 |
|---|---|---|
| Revenue | 146.1 | 980.8 |
| Adjusted EBITDA | (5.2) | 465.8 |
| Net income/(loss), continuing ops | (119.6) | (37.5) |
| Adjusted net income/(loss) | (100.4) | 90.9 |
Why GAAP is still negative
Operating income turned positive at $50.4 million, but interest expense was $112.5 million (versus $14.7 million) and a $49.5 million induced-conversion expense on convertible notes pushed the pre-tax result to a $62.7 million loss. Diluted EPS was -$0.13 versus -$0.50.
Asia-Pacific angle
The shareholder letter says Nebius has signed multiple customer agreements in Japan, Korea, India, Australia and Singapore since launching in APAC in Q1, and appointed country managers for Japan and South Korea.
Two readings
- Constructive: operating income and adjusted net income both turned positive in the same quarter.
- Cautious: financing costs remain heavy, and 2026 revenue is now expected at the low end of the guided range.
No consensus estimates are used; comparisons are to the prior-year quarter and the company’s own guidance.
売上の中身:成長と一時収入
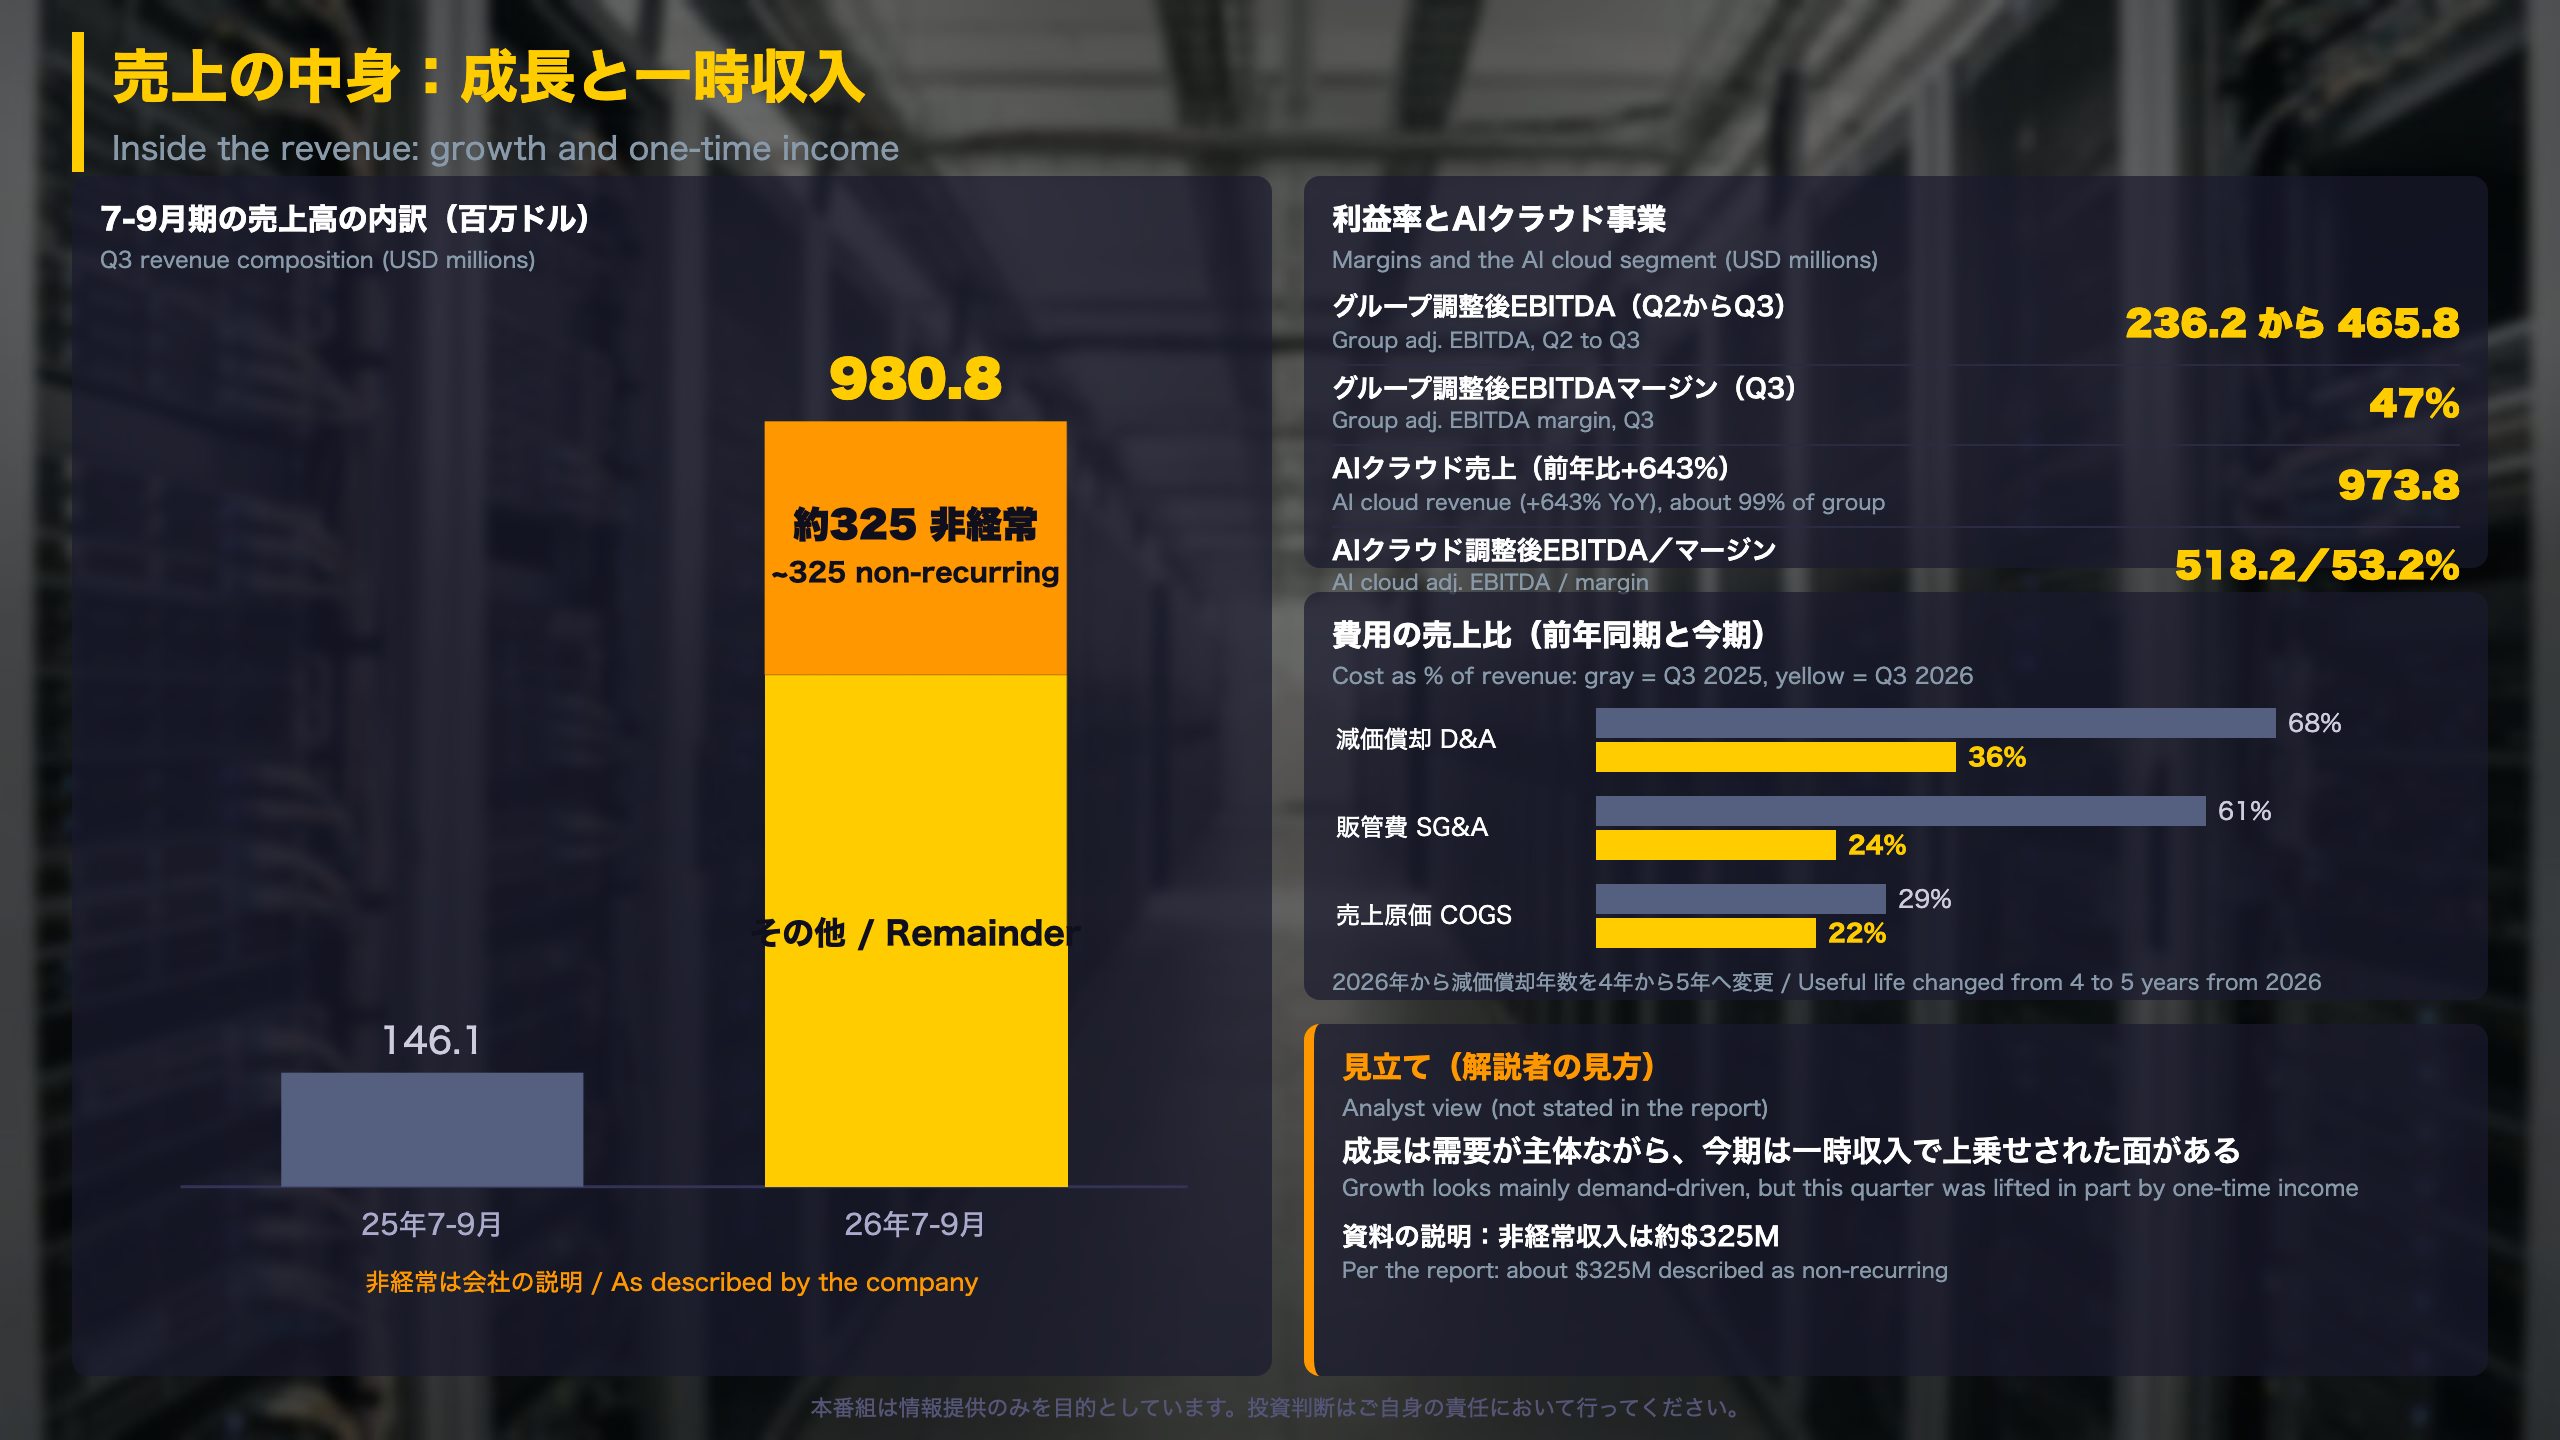
Revenue Quality: Mix, Cost Ratios and Accounting Assumptions
What the segment data shows
- Nebius AI cloud revenue was $973.8M (+643% YoY), about 99% of group revenue; segment adjusted EBITDA was $518.2M, a 53.2% margin.
- Group adjusted EBITDA rose from $236.2M in Q2 to $465.8M in Q3.
- Annualized run-rate revenue (ARR) reached $6.4B in September versus $3.0B in June, but management says it will stop guiding on ARR because it reflects just one month and can be choppy as partner revenue ramps.
Cost ratios (share of revenue, Q3 2025 to Q3 2026)
| Item | Prior year | Now |
|---|---|---|
| Cost of revenue | 29% | 22% |
| Product development | 31% | 12% |
| SG&A | 61% | 24% |
| D&A | 68% | 36% |
Two caveats
About $325M of revenue is labeled non-recurring, which also inflates the denominator in these ratios. Separately, equipment useful life moved from four years to five from 2026, so part of the D&A ratio decline likely reflects an accounting estimate rather than operations.
Asset-light model
Under these partnerships Nebius earns revenue when it enables its architecture and platform on a partner’s funded capacity, and again as that capacity comes online. This differs from owning every GPU, and it can make revenue timing lumpier.
Two readings
- Constructive: every cost line improved as a share of revenue.
- Cautious: an underlying run-rate excluding one-offs and the depreciation change cannot be derived from the filing. Remaining performance obligations were $38.7B, up only 3% from $37.5B.
お金の流れ:設備投資と前払い
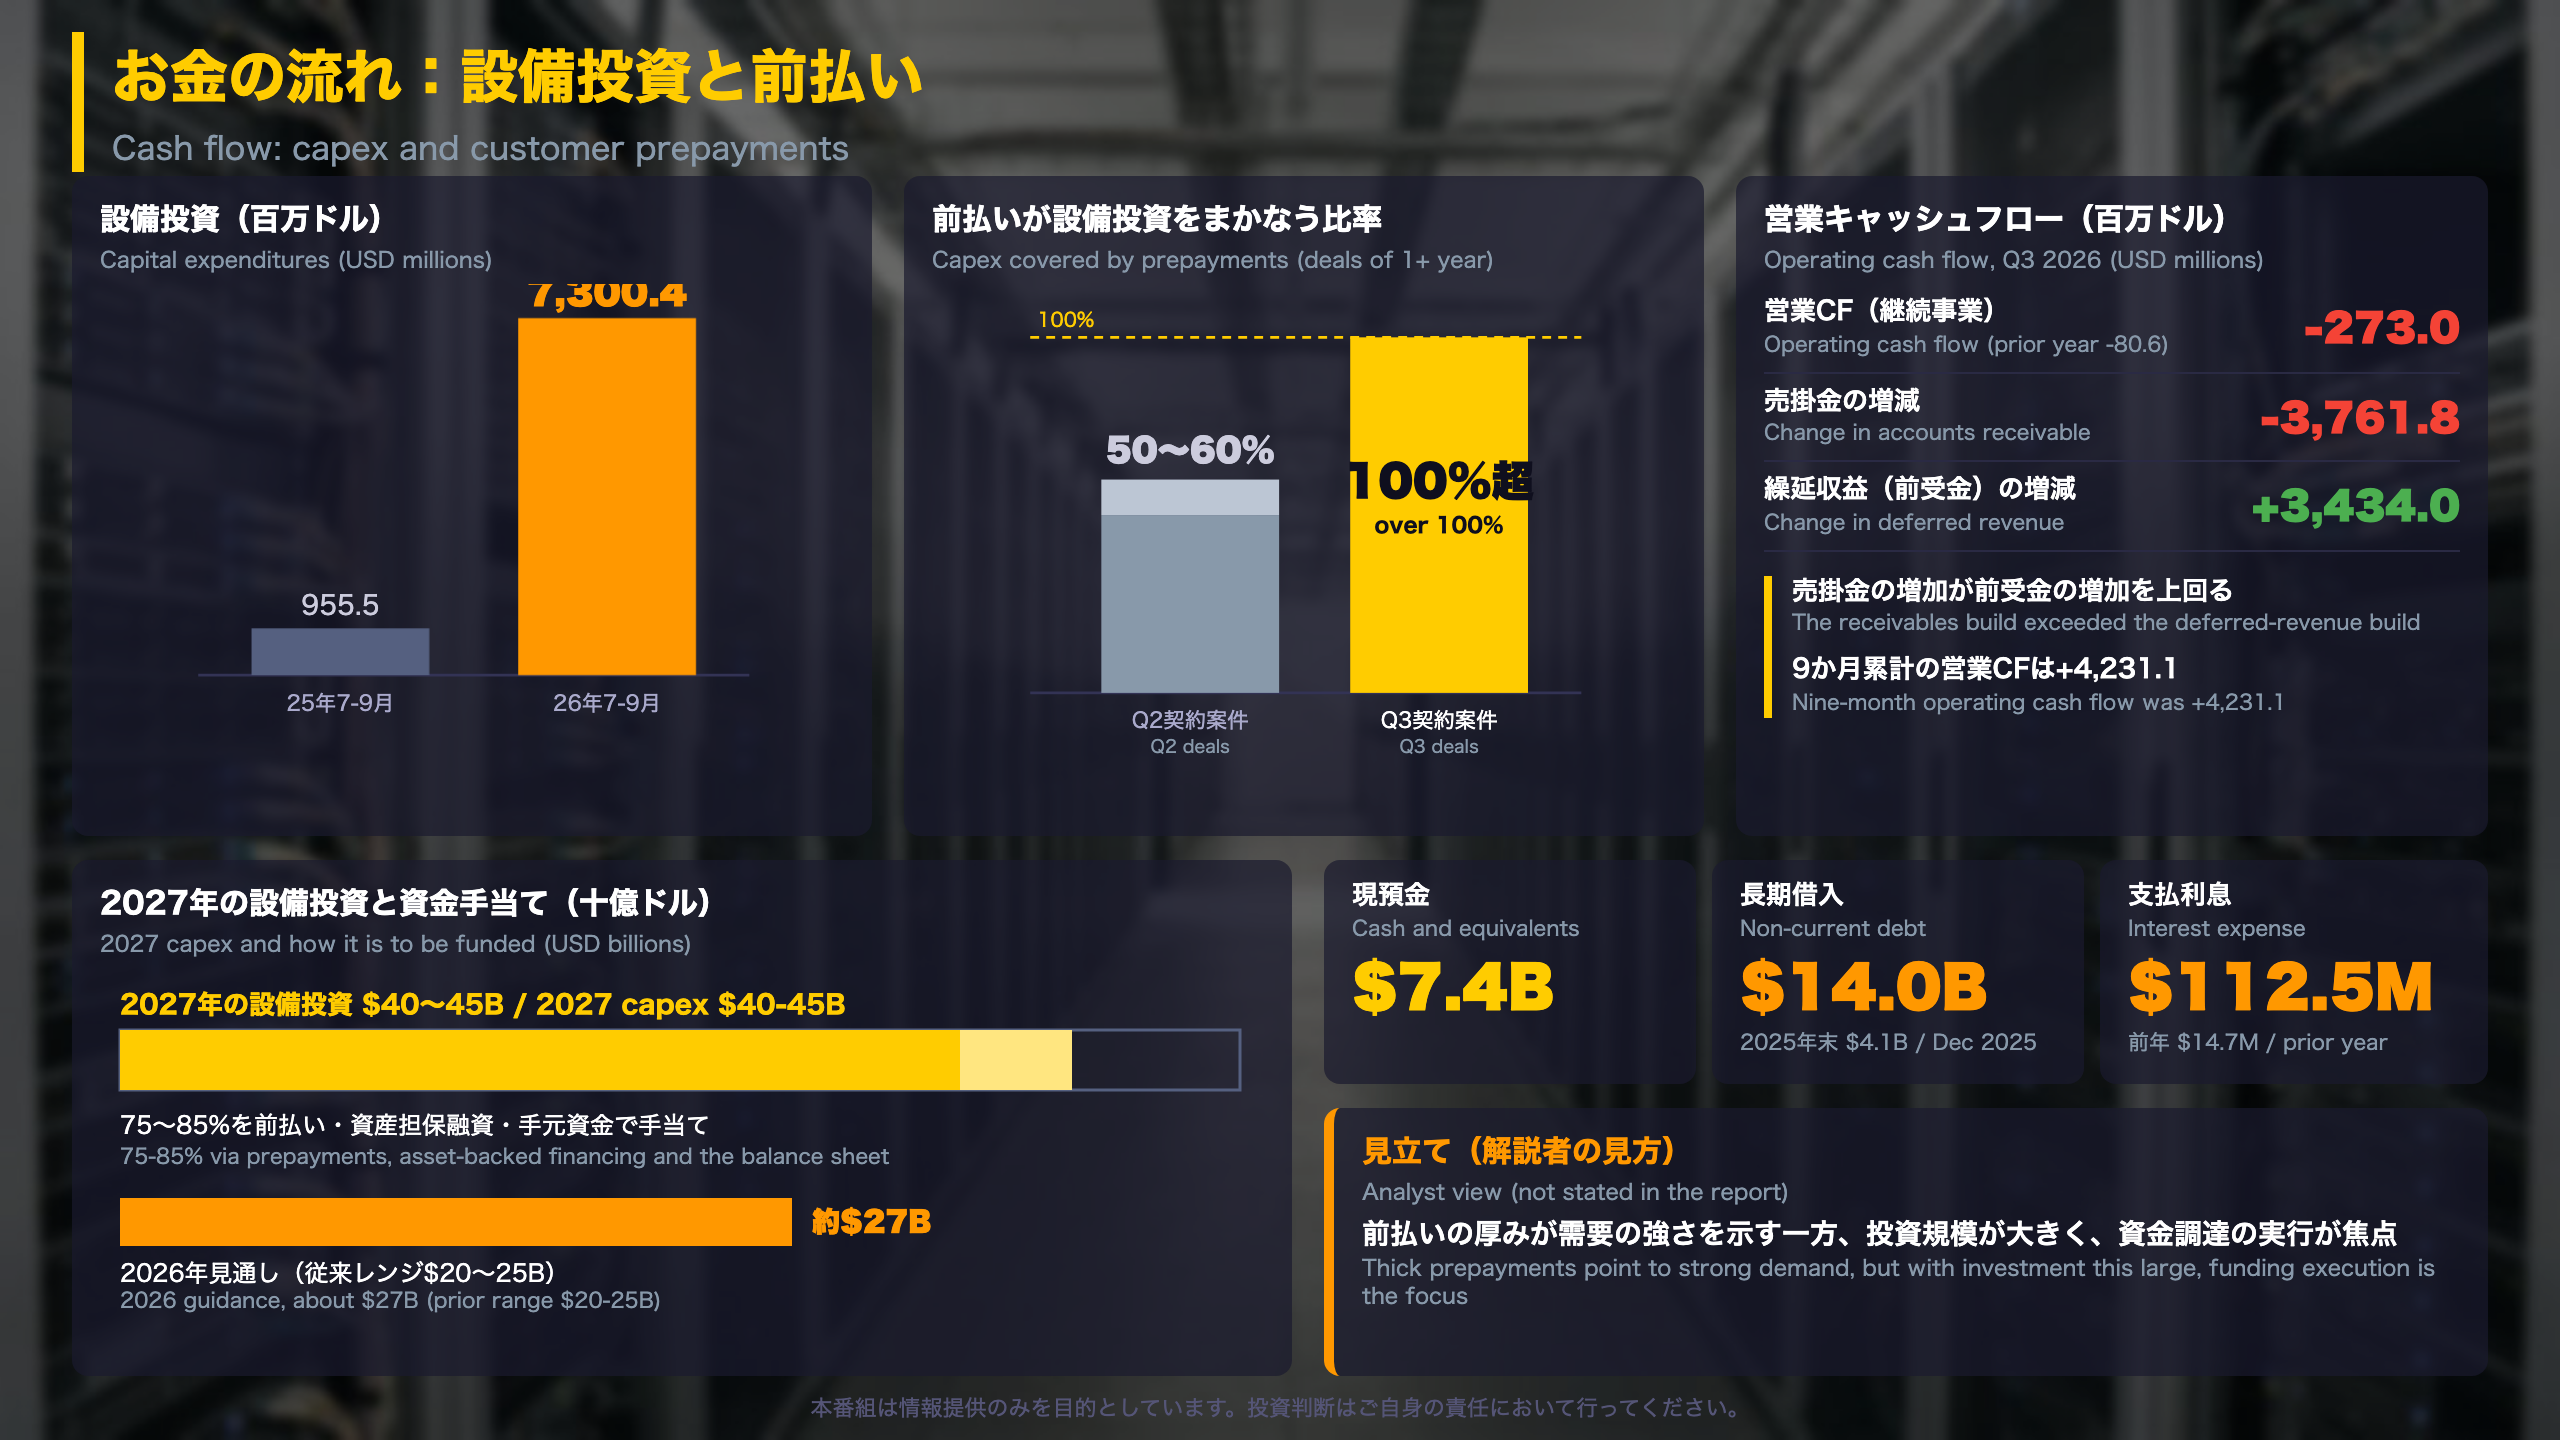
Reading the Funding Picture: Prepayments, Debt and Payback
From the cash flow statement (USD millions)
| Item | Q3 2025 | Q3 2026 |
|---|---|---|
| Operating cash flow | (80.6) | (273.0) |
| Capex | (955.5) | (7,300.4) |
| Change in receivables | (37.3) | (3,761.8) |
| Change in deferred revenue | (3.8) | 3,434.0 |
Nine-month operating cash flow was +$4,231.1M, driven by a $7,829.0M increase in deferred revenue, meaning cash arrives ahead of revenue recognition.
Better contract terms (company-reported)
- Payback on comparable 1-3 year deals: 1 year 10 months to 1 year 7 months
- Annual contract value per MW: above $20M to above $25M
- Average price per GPU-hour up more than 20% quarter on quarter
- More than 90% of Q3 contract value carried a prepayment
How it is financed
$5.75B convertible notes (August), about $1.0B net from the at-the-market program, a $775M asset-backed facility at SOFR plus 2.50% (July), and a $3.5B secured facility with Citi (October).
Two readings
- Constructive: prepayments exceeded 100% of capex on Q3 deals; management expects $10B of prepayments in 2026 and $17-20B in 2027.
- Cautious: non-current debt rose from $4.1B at end-2025 to $14.0B, interest expense reached $112.5M, and 2026 capex of about $27B exceeds the earlier $20-25B range.
Watch how the planned 75-85% coverage of 2027 capex is executed.
質疑で深める:見通しと次の確認点
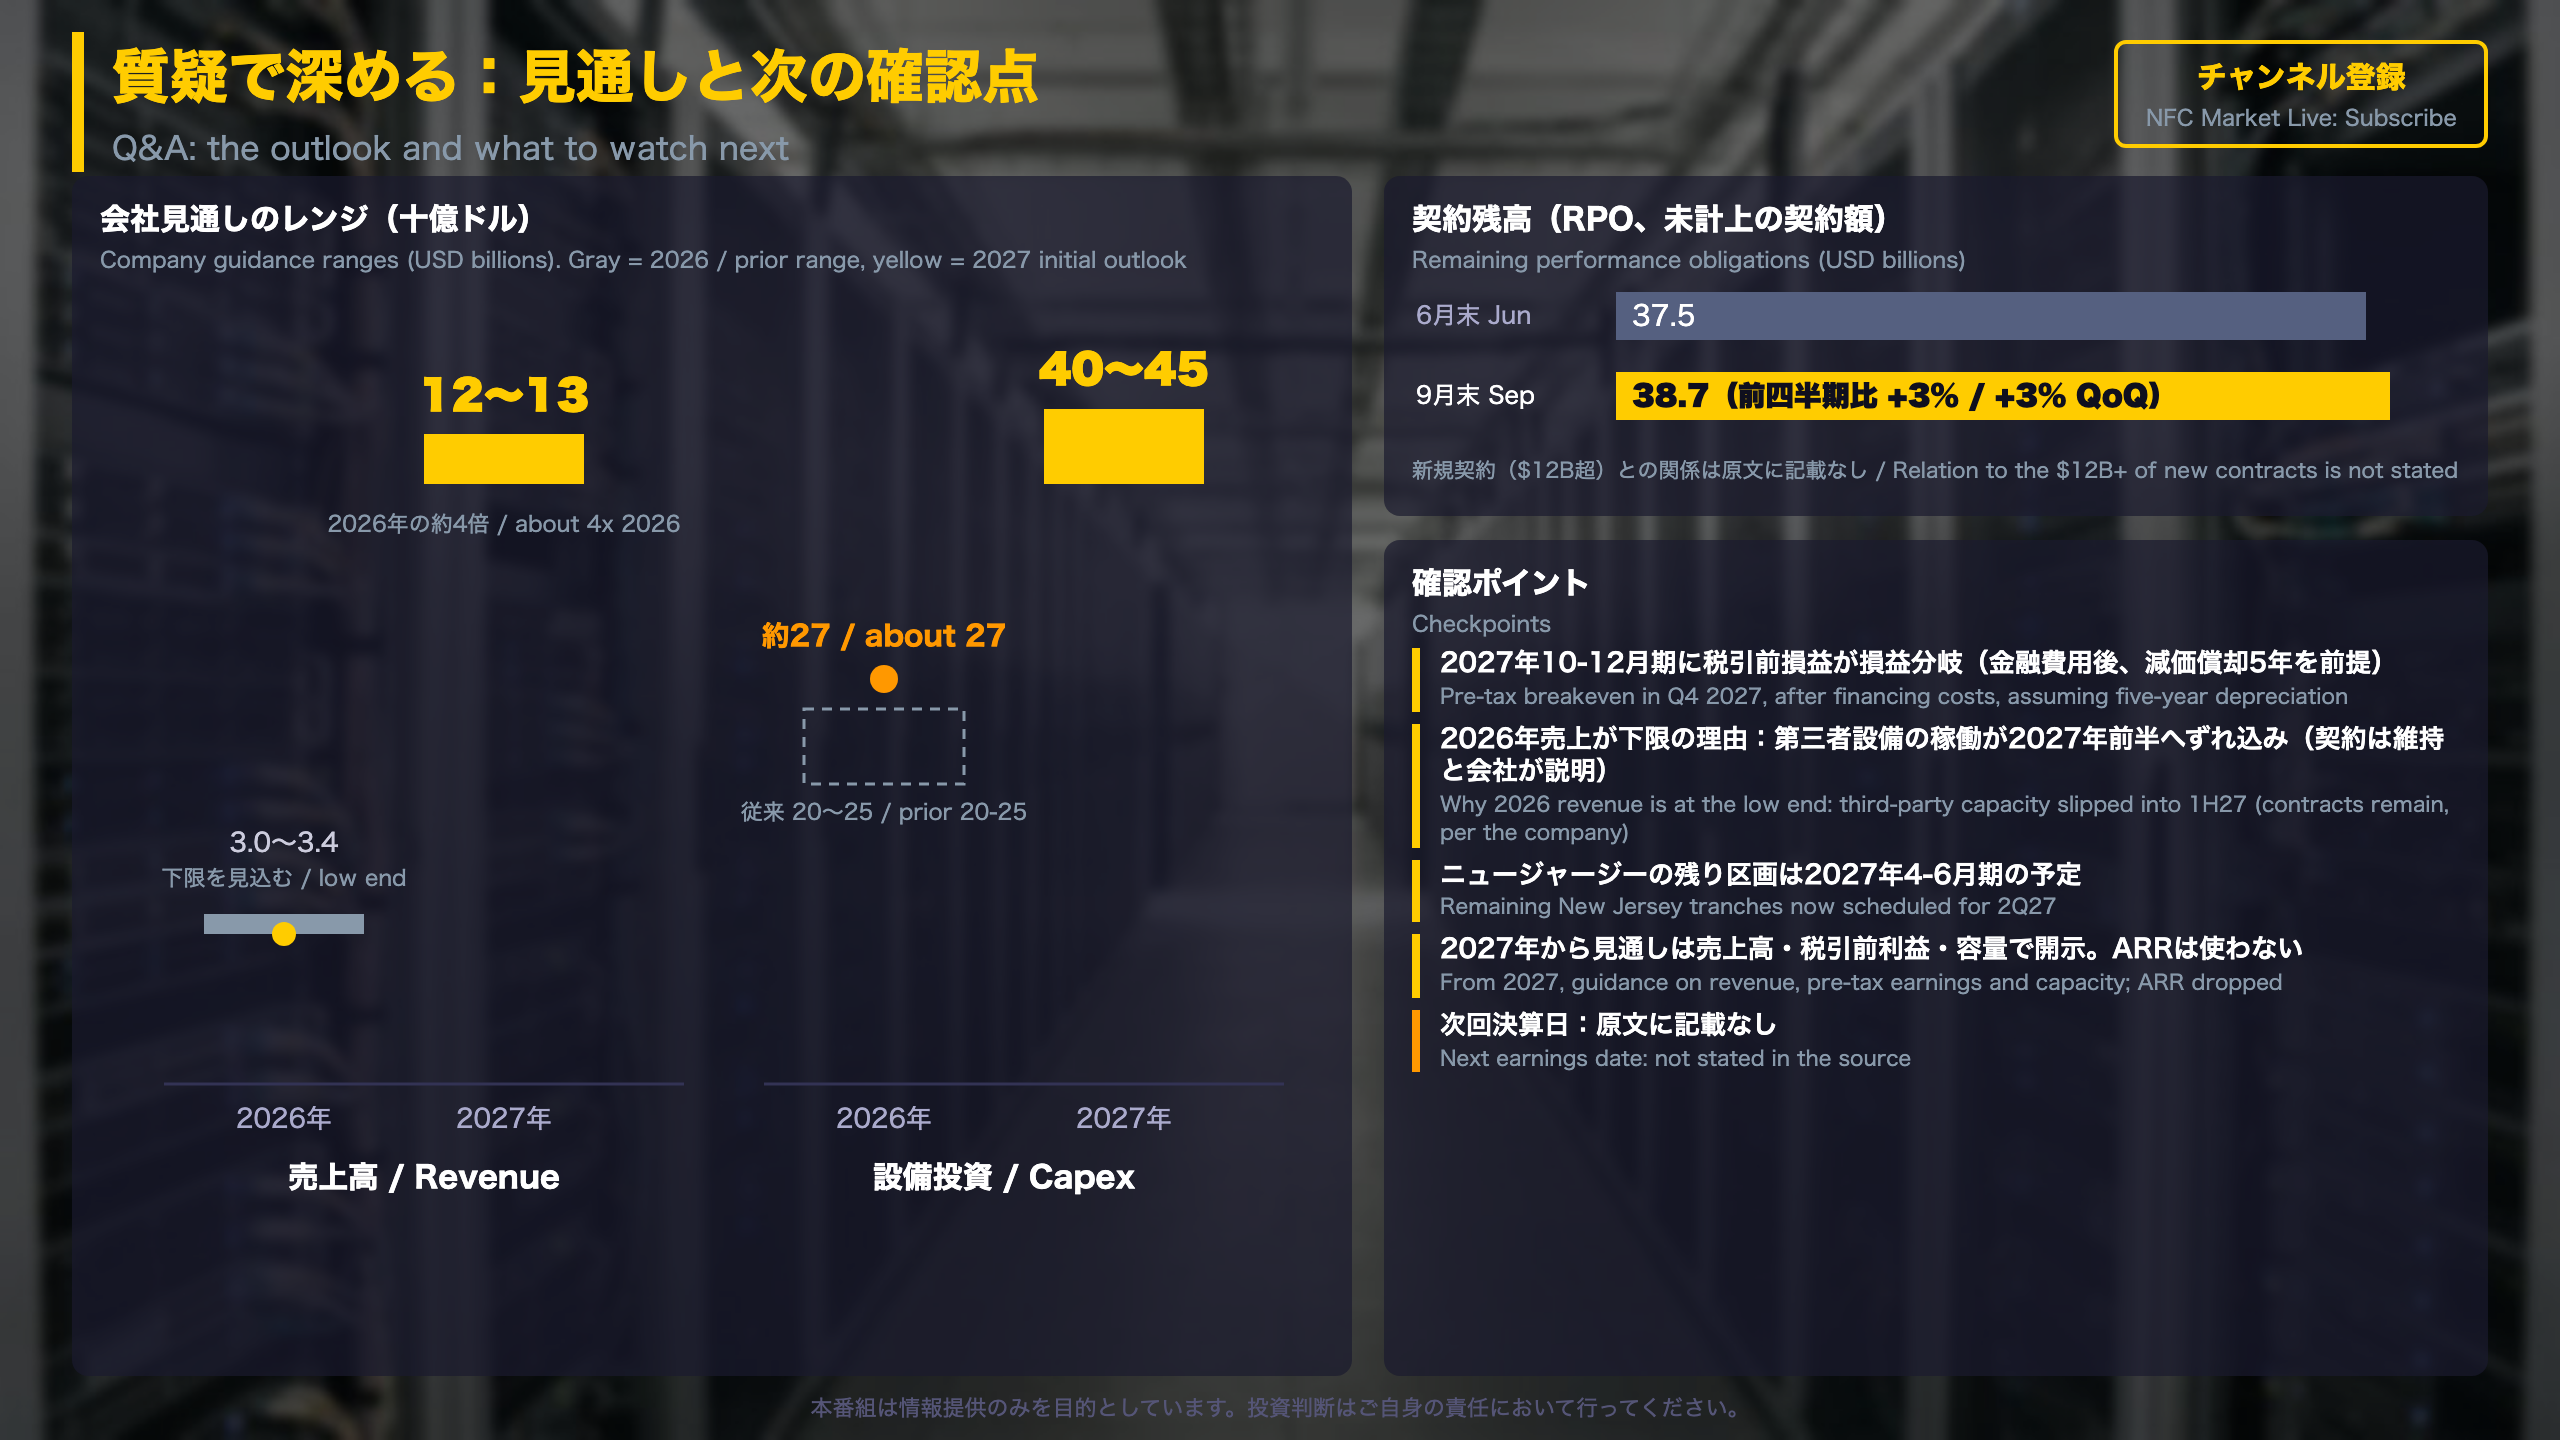
Outlook Changes and Risk Items
Guidance at a glance
| Item | 2026 (updated) | 2027 (initial) |
|---|---|---|
| Revenue | Low end of $3.0-3.4B | $12-13B |
| Adj. EBITDA margin | About 40% (unchanged) | Guidance moves to revenue and pre-tax earnings |
| Capex | About $27B (prior $20-25B) | $40-45B |
| Pre-tax result | n/a | Breakeven in Q4 2027 |
The December ARR target of $7-9B now arrives in February at more than $7B. Management says it will drop ARR as a guided metric from 2027 because it annualizes a single month.
What caused the delays
The letter states that delivery dates at a number of colocation sites shifted into the first half of 2027. In New Jersey, DataOne began retiring some temporary generation ahead of the move to permanent power (Bloom fuel cells), which reset the schedule for remaining tranches to 2Q27. More than half of the capacity contracted with Microsoft is still expected by year-end.
Owned sites
Nebius expects most capacity from 2027 to come from owned sites in Missouri, Lappeenranta (Finland), a second Mantsala site and Alabama, representing more than 3 GW over 3 to 3.5 years. Owned sites give it control over timing, while third-party sites are where delays occurred.
Two readings
- Constructive: contracts remain in place, 2027 revenue is guided to roughly four times 2026, and prepayments are designed to fund the build.
- Cautious: the breakeven assumes five-year depreciation, delays cluster in third-party sites, and remaining performance obligations rose only 3% quarter on quarter.
The next earnings date is not stated in the source documents.
Disclaimer: This article is for informational purposes only. All investment decisions are made solely at your own risk.