📺 Watch the Full Video Analysis
This article was automatically generated by the NFC Market Live AI analysis system. (Updated: 2026-11-04 06:32 JST)
📊 AMD reported Q3 2026 results on November 3, 2026.
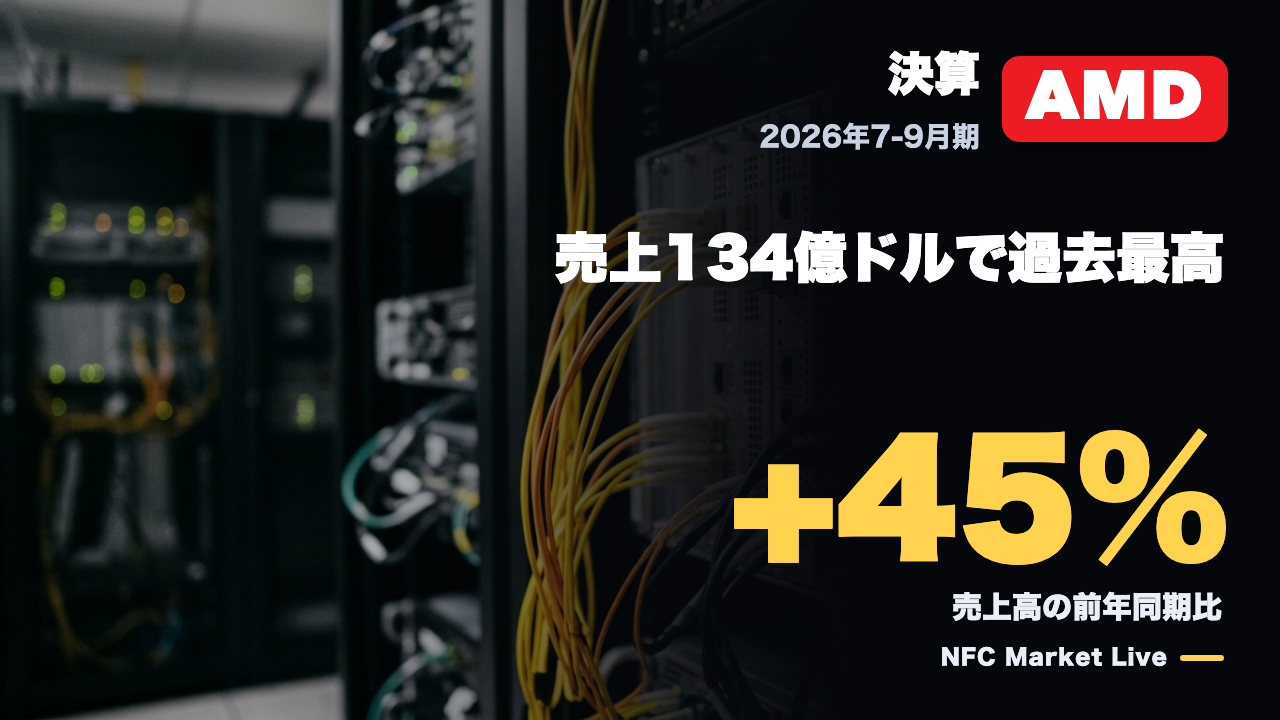
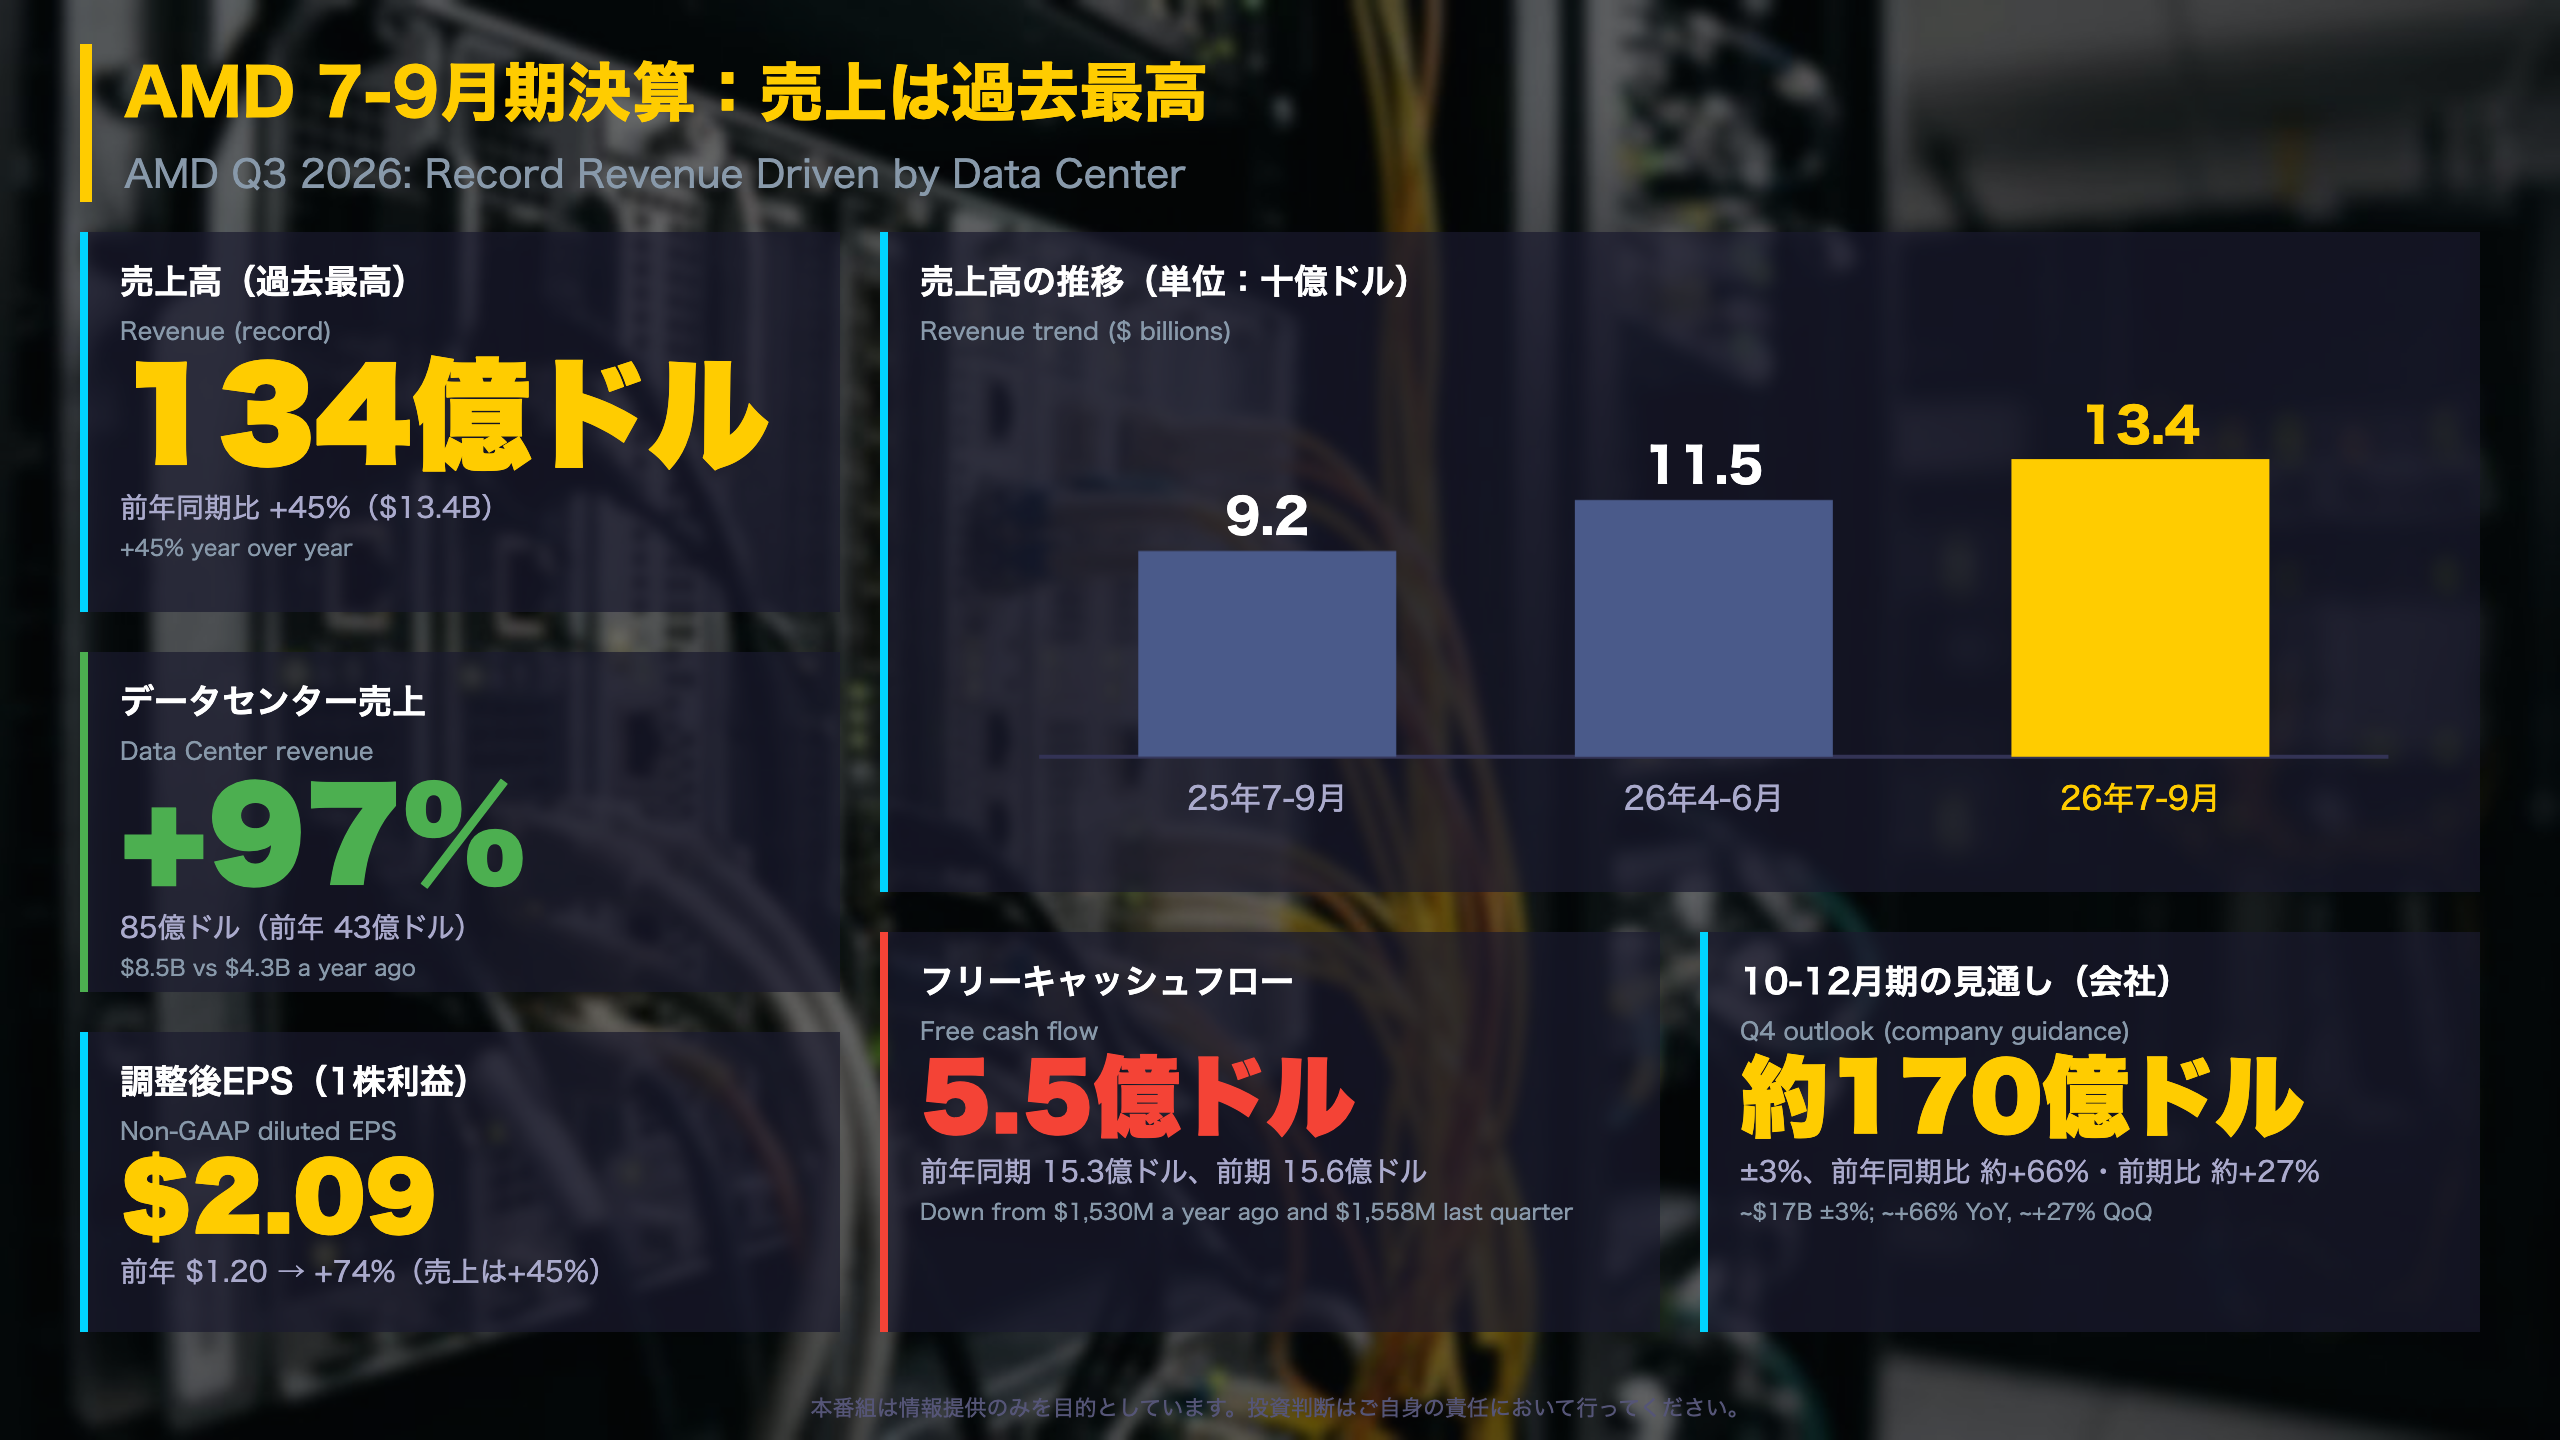
Revenue hit a record $13.4B (+45% YoY), with Data Center up 97% to $8.5B.
📈 Non-GAAP EPS was $2.09 (+74%). The company guides Q4 revenue to about $17B (±3%), implying further acceleration.
⚠️ On the other side, inventory rose 35% from the prior quarter and free cash flow fell to $554M. Gaming revenue dropped 40% YoY.
💡 We lay out both the strengths and the weights, using the numbers in the filing.
AMD 7-9月期決算:売上は過去最高
What AMD reported
AMD (NASDAQ: AMD) published its fiscal third-quarter 2026 results on November 3, 2026. Revenue was $13.4 billion, up 45% year over year and 16% from the prior quarter. GAAP diluted EPS was $1.46. Non-GAAP EPS, which strips out items such as stock-based compensation, amortization of acquired intangibles and the fair-value change on customer warrants, was $2.09.
Why the non-GAAP figures matter
U.S. companies commonly report both GAAP and adjusted numbers. AMD applies a projected 13% non-GAAP tax rate for fiscal 2026, so adjusted EPS is not a like-for-like substitute for GAAP. The press release reconciles the two line by line.
Operating leverage
- Non-GAAP gross margin: 56% (54% a year ago)
- Non-GAAP operating expenses as a share of revenue: 27% (30% a year ago)
- Non-GAAP operating margin: 29% (24% a year ago)
The CFO described this as significant operating leverage as the Data Center business scales.
Context for global readers
AMD competes with Nvidia in AI accelerators and with Intel in server and PC processors. This release is one company’s quarterly report, so it is best read together with the cash-flow and balance-sheet items covered in the next slides, rather than as a verdict on the whole sector.
What to watch
Guidance for Q4 2026 is revenue of about $17 billion (plus or minus 3%) and non-GAAP gross margin of about 55%, slightly below this quarter’s 56%. The date of the next earnings release is not stated in the document.
データセンター:売上は前年のほぼ2倍
Data Center segment in detail
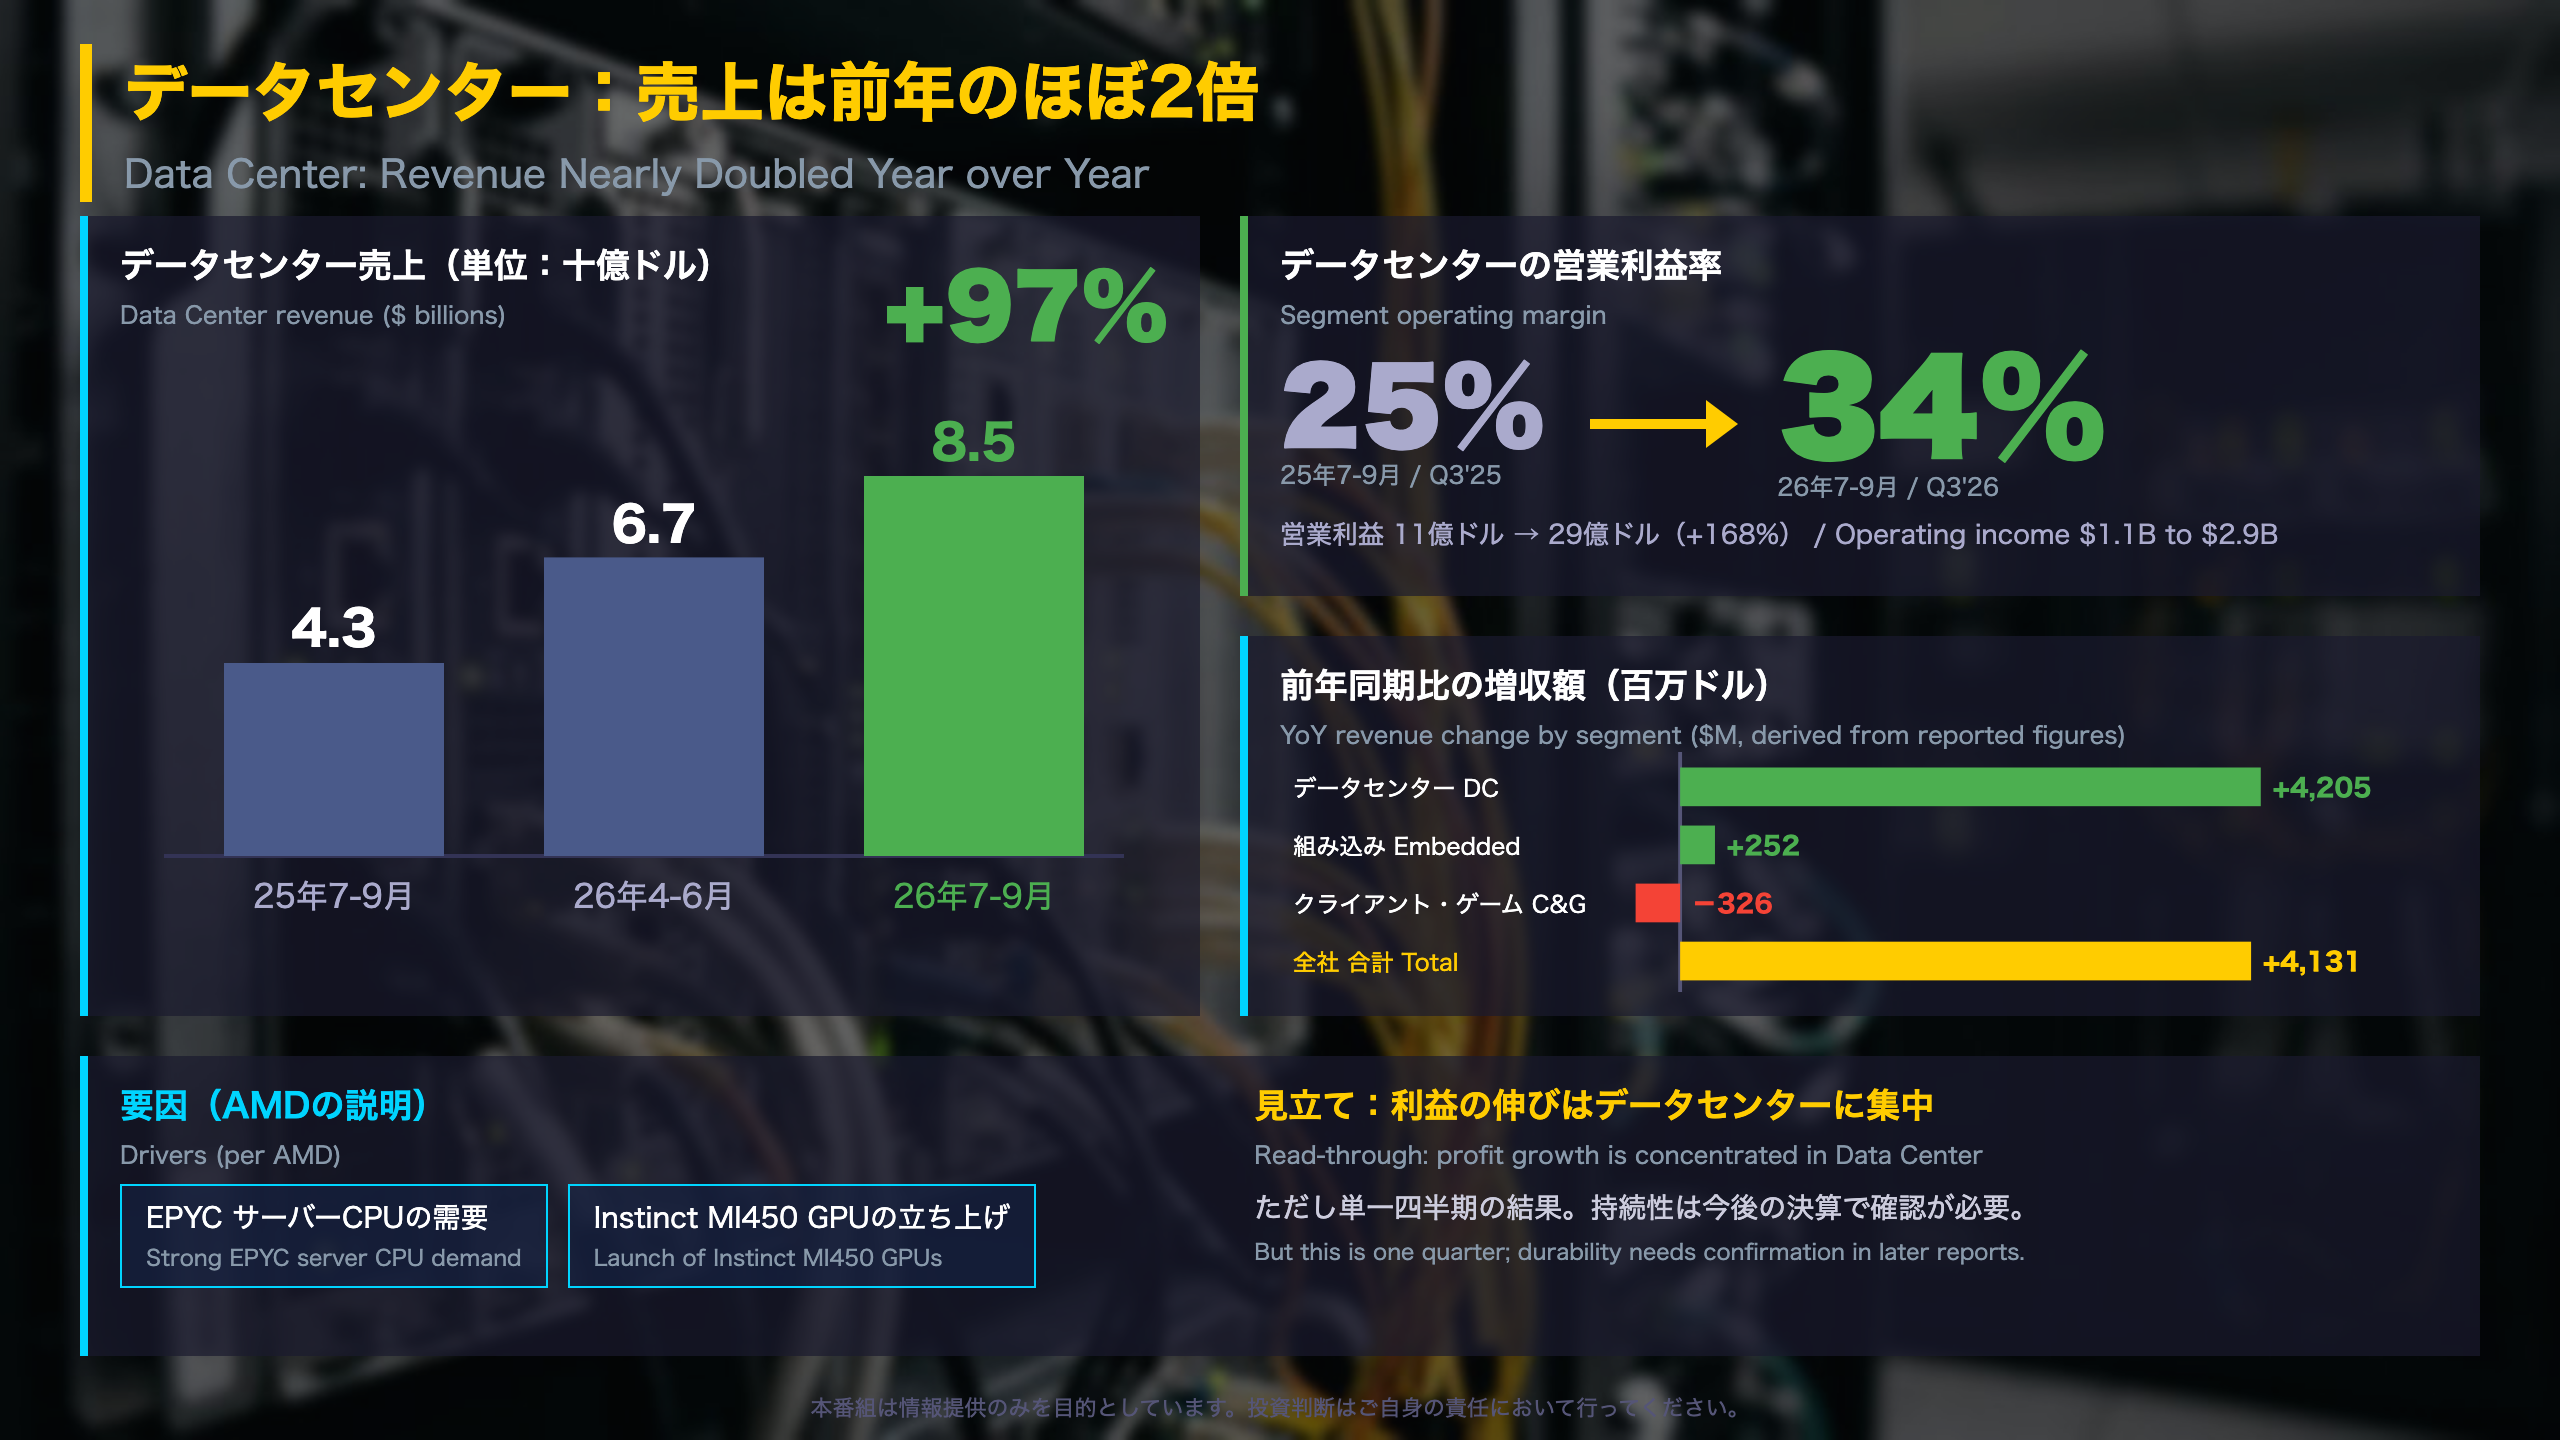
Data Center revenue was $8,546 million, up 97% from $4,341 million a year earlier and up 27% from $6,718 million in the prior quarter. Segment operating income was $2,882 million, about 2.7 times the $1,074 million of a year ago.
Decomposing the revenue gain
Company revenue rose $4,131 million year over year. By segment (our arithmetic from the reported figures): Data Center +$4,205 million, Embedded +$252 million, Client and Gaming −$326 million. Data Center alone accounts for more than the entire company-level increase.
Margin expansion
Segment operating margin rose from 25% to 34%. AMD attributes this to higher revenue, partly offset by higher operating expenses.
What the segment contains
In AMD’s reporting, Data Center includes AI accelerators (the Instinct GPU line), server CPUs (EPYC), DPUs, AI NICs and FPGA or adaptive SoC products for data centers. The release says the first Helios rack-scale systems, built on Instinct MI450 GPUs and 6th Gen EPYC CPUs, are running workloads for Anthropic, Meta, Microsoft, OpenAI and Oracle Cloud Infrastructure.
Two ways to read it
- Constructive: both CPUs and GPUs contributed, and the margin gain suggests operating leverage.
- Cautious: this is a product-launch quarter and a single data point; durability must be confirmed in later reports.
What to watch
CEO Lisa Su says growth should accelerate further in Q4 as Helios and Venice production scales. The next checkpoint is whether Data Center revenue and margin keep moving together.
成長の裏で重くなったキャッシュ
Cash-flow detail
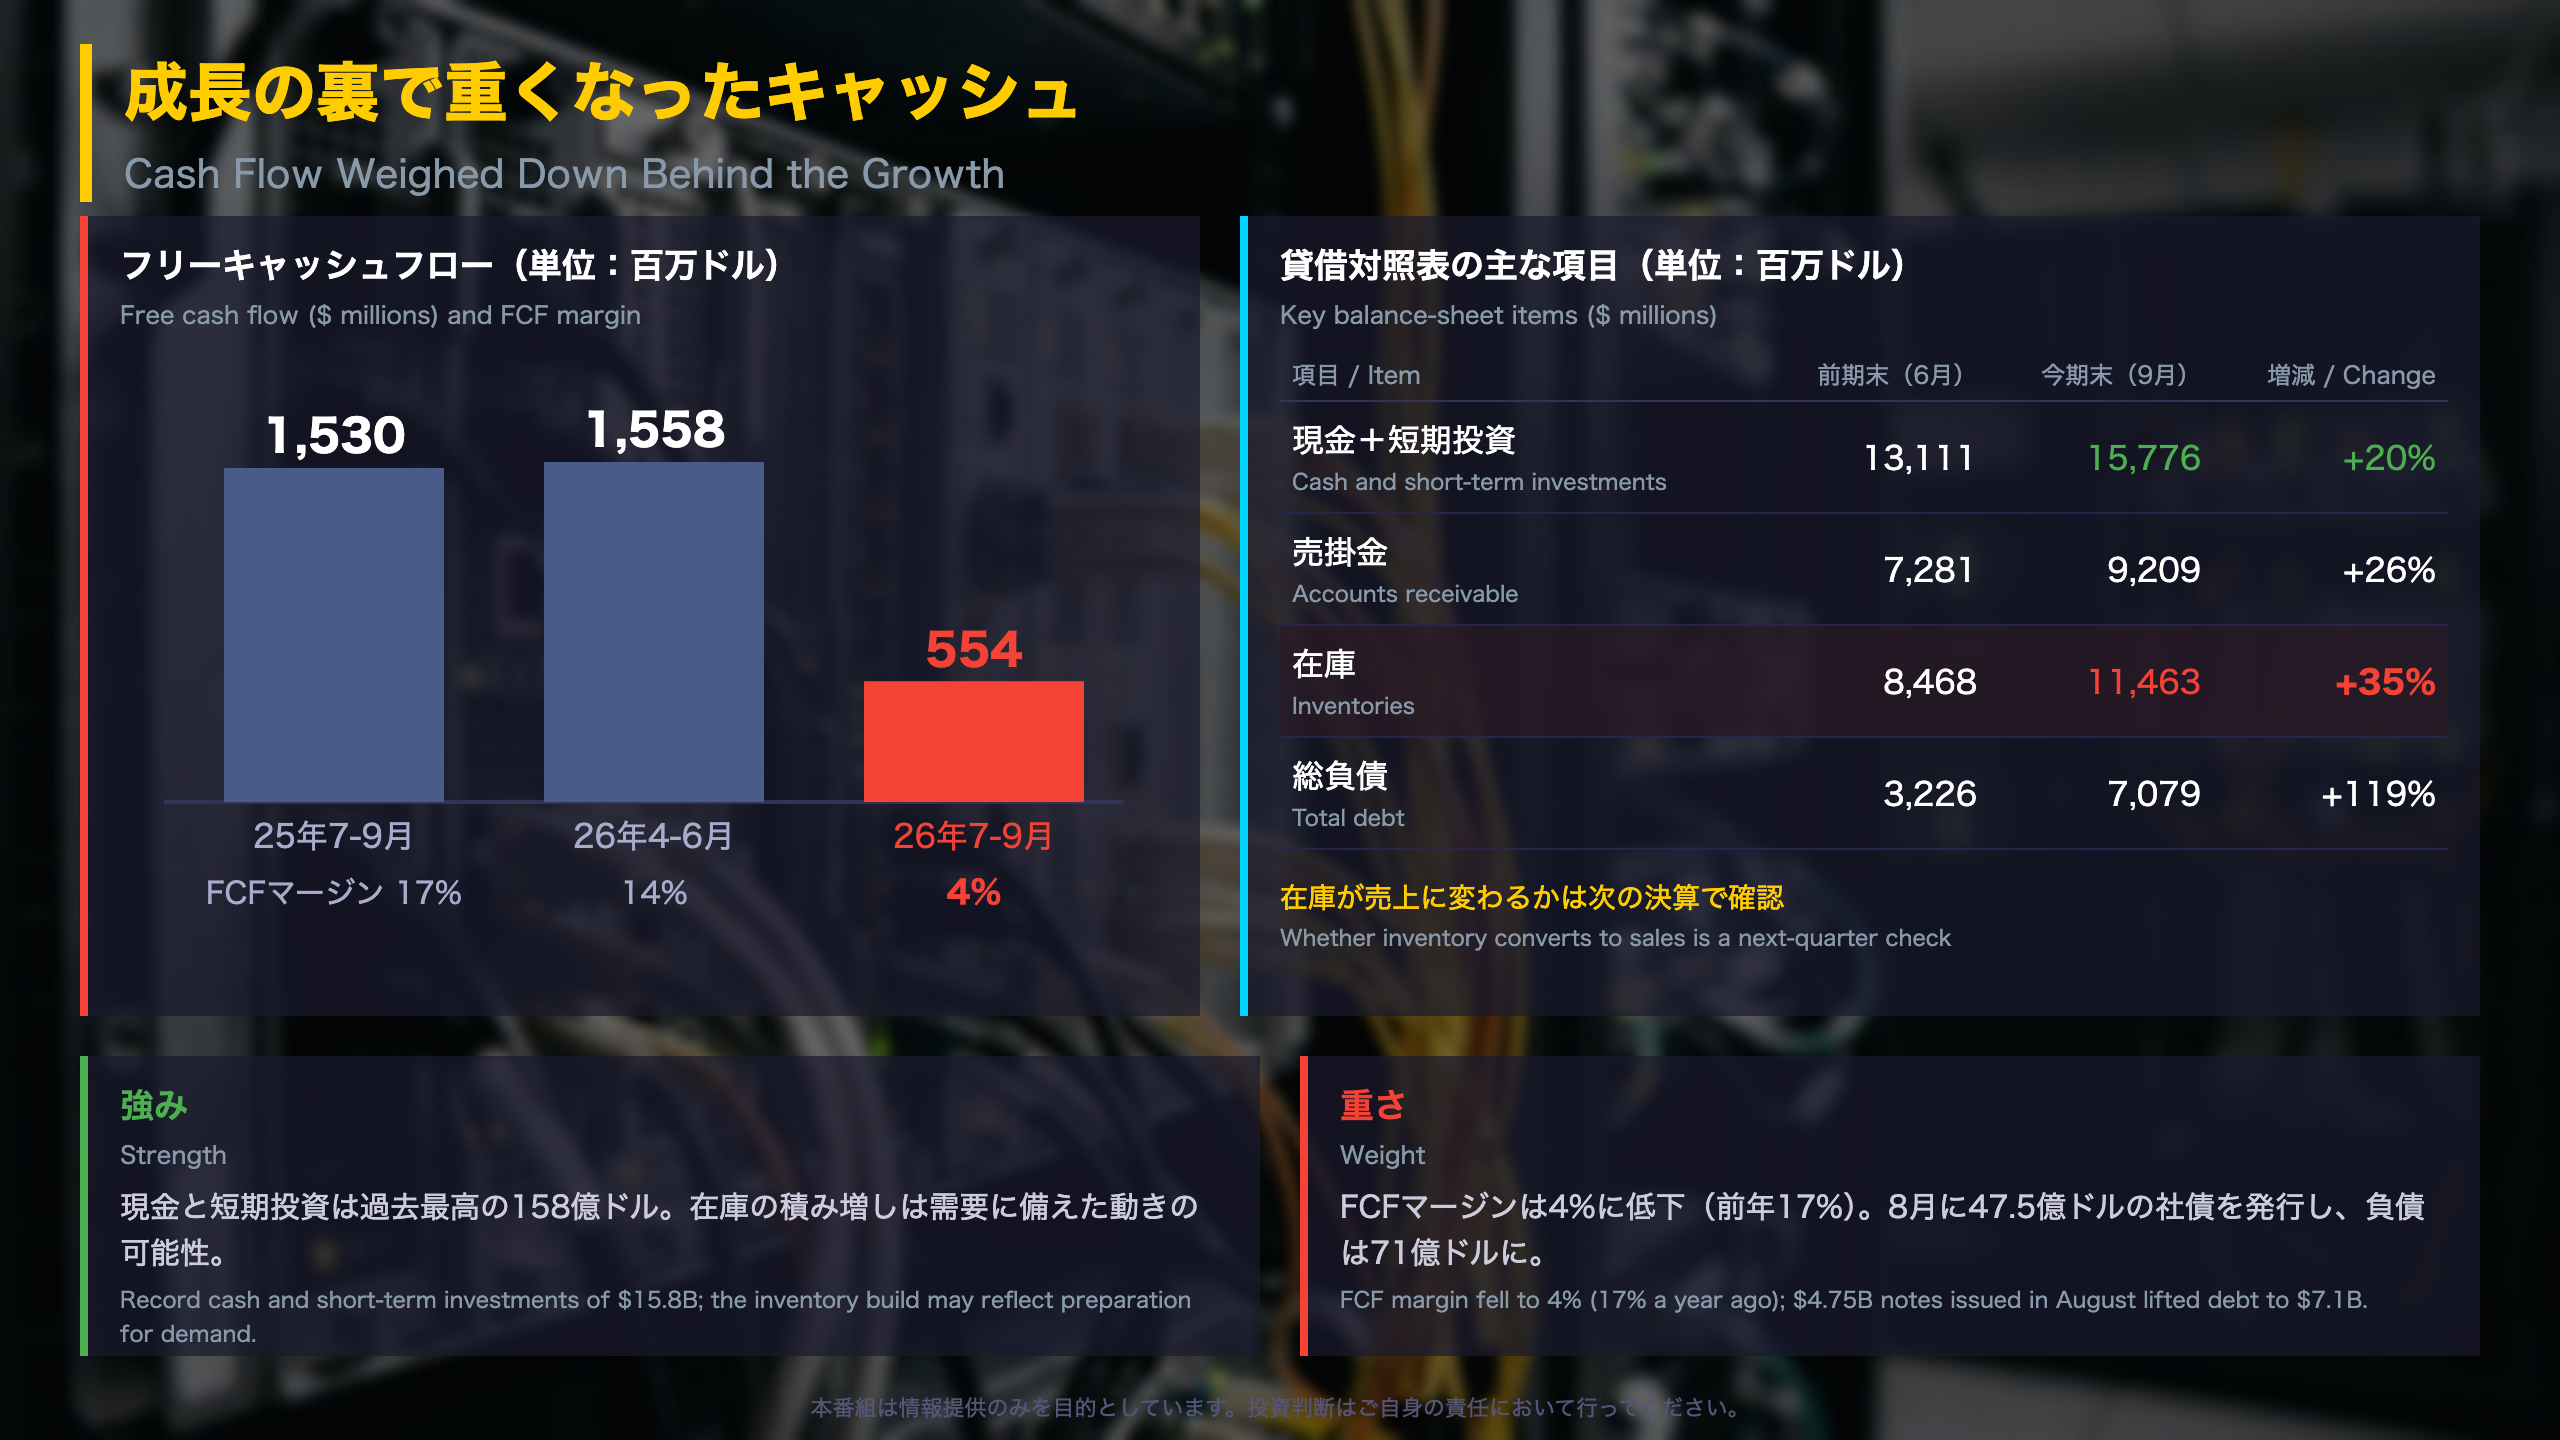
Cash from continuing operations was $1,202 million, down from $1,788 million a year ago and $2,366 million in the prior quarter. Capital expenditures were $648 million, so free cash flow (operating cash flow minus capex) was $554 million, a 4% margin. A year earlier it was $1,530 million (17%); last quarter it was $1,558 million (14%).
Working capital
The cash-flow statement shows a $2,995 million cash outflow from higher inventories and $1,928 million from higher receivables, partly offset by a $2,313 million inflow from higher accounts payable. The reconciliation also adds back $1,179 million of non-cash impact from warrants issued to customers.
Balance sheet
AMD issued $4.75 billion of senior notes in August. Total debt rose from $3,226 million to $7,079 million, while cash and short-term investments reached a record $15,776 million, up from $13,111 million.
Why free cash flow matters
Free cash flow shows how much cash a company generates after reinvesting in its business. For a fast-growing hardware company, a quarter of heavy inventory build can depress it even when earnings are strong. The relevant test is whether inventory converts into revenue in the following quarters.
Two readings
- Constructive: the build may be preparation for the roughly $17 billion Q4 revenue guidance, and liquidity is ample.
- Cautious: inventory (+35% QoQ) and receivables (+26%) grew faster than revenue (+16% QoQ), and FCF margin fell to 4%.
What to watch
The next print should show whether inventory growth slows relative to sales and whether FCF margin recovers. The next release date is not stated in the document.
質疑で深める:他部門と利益の見方
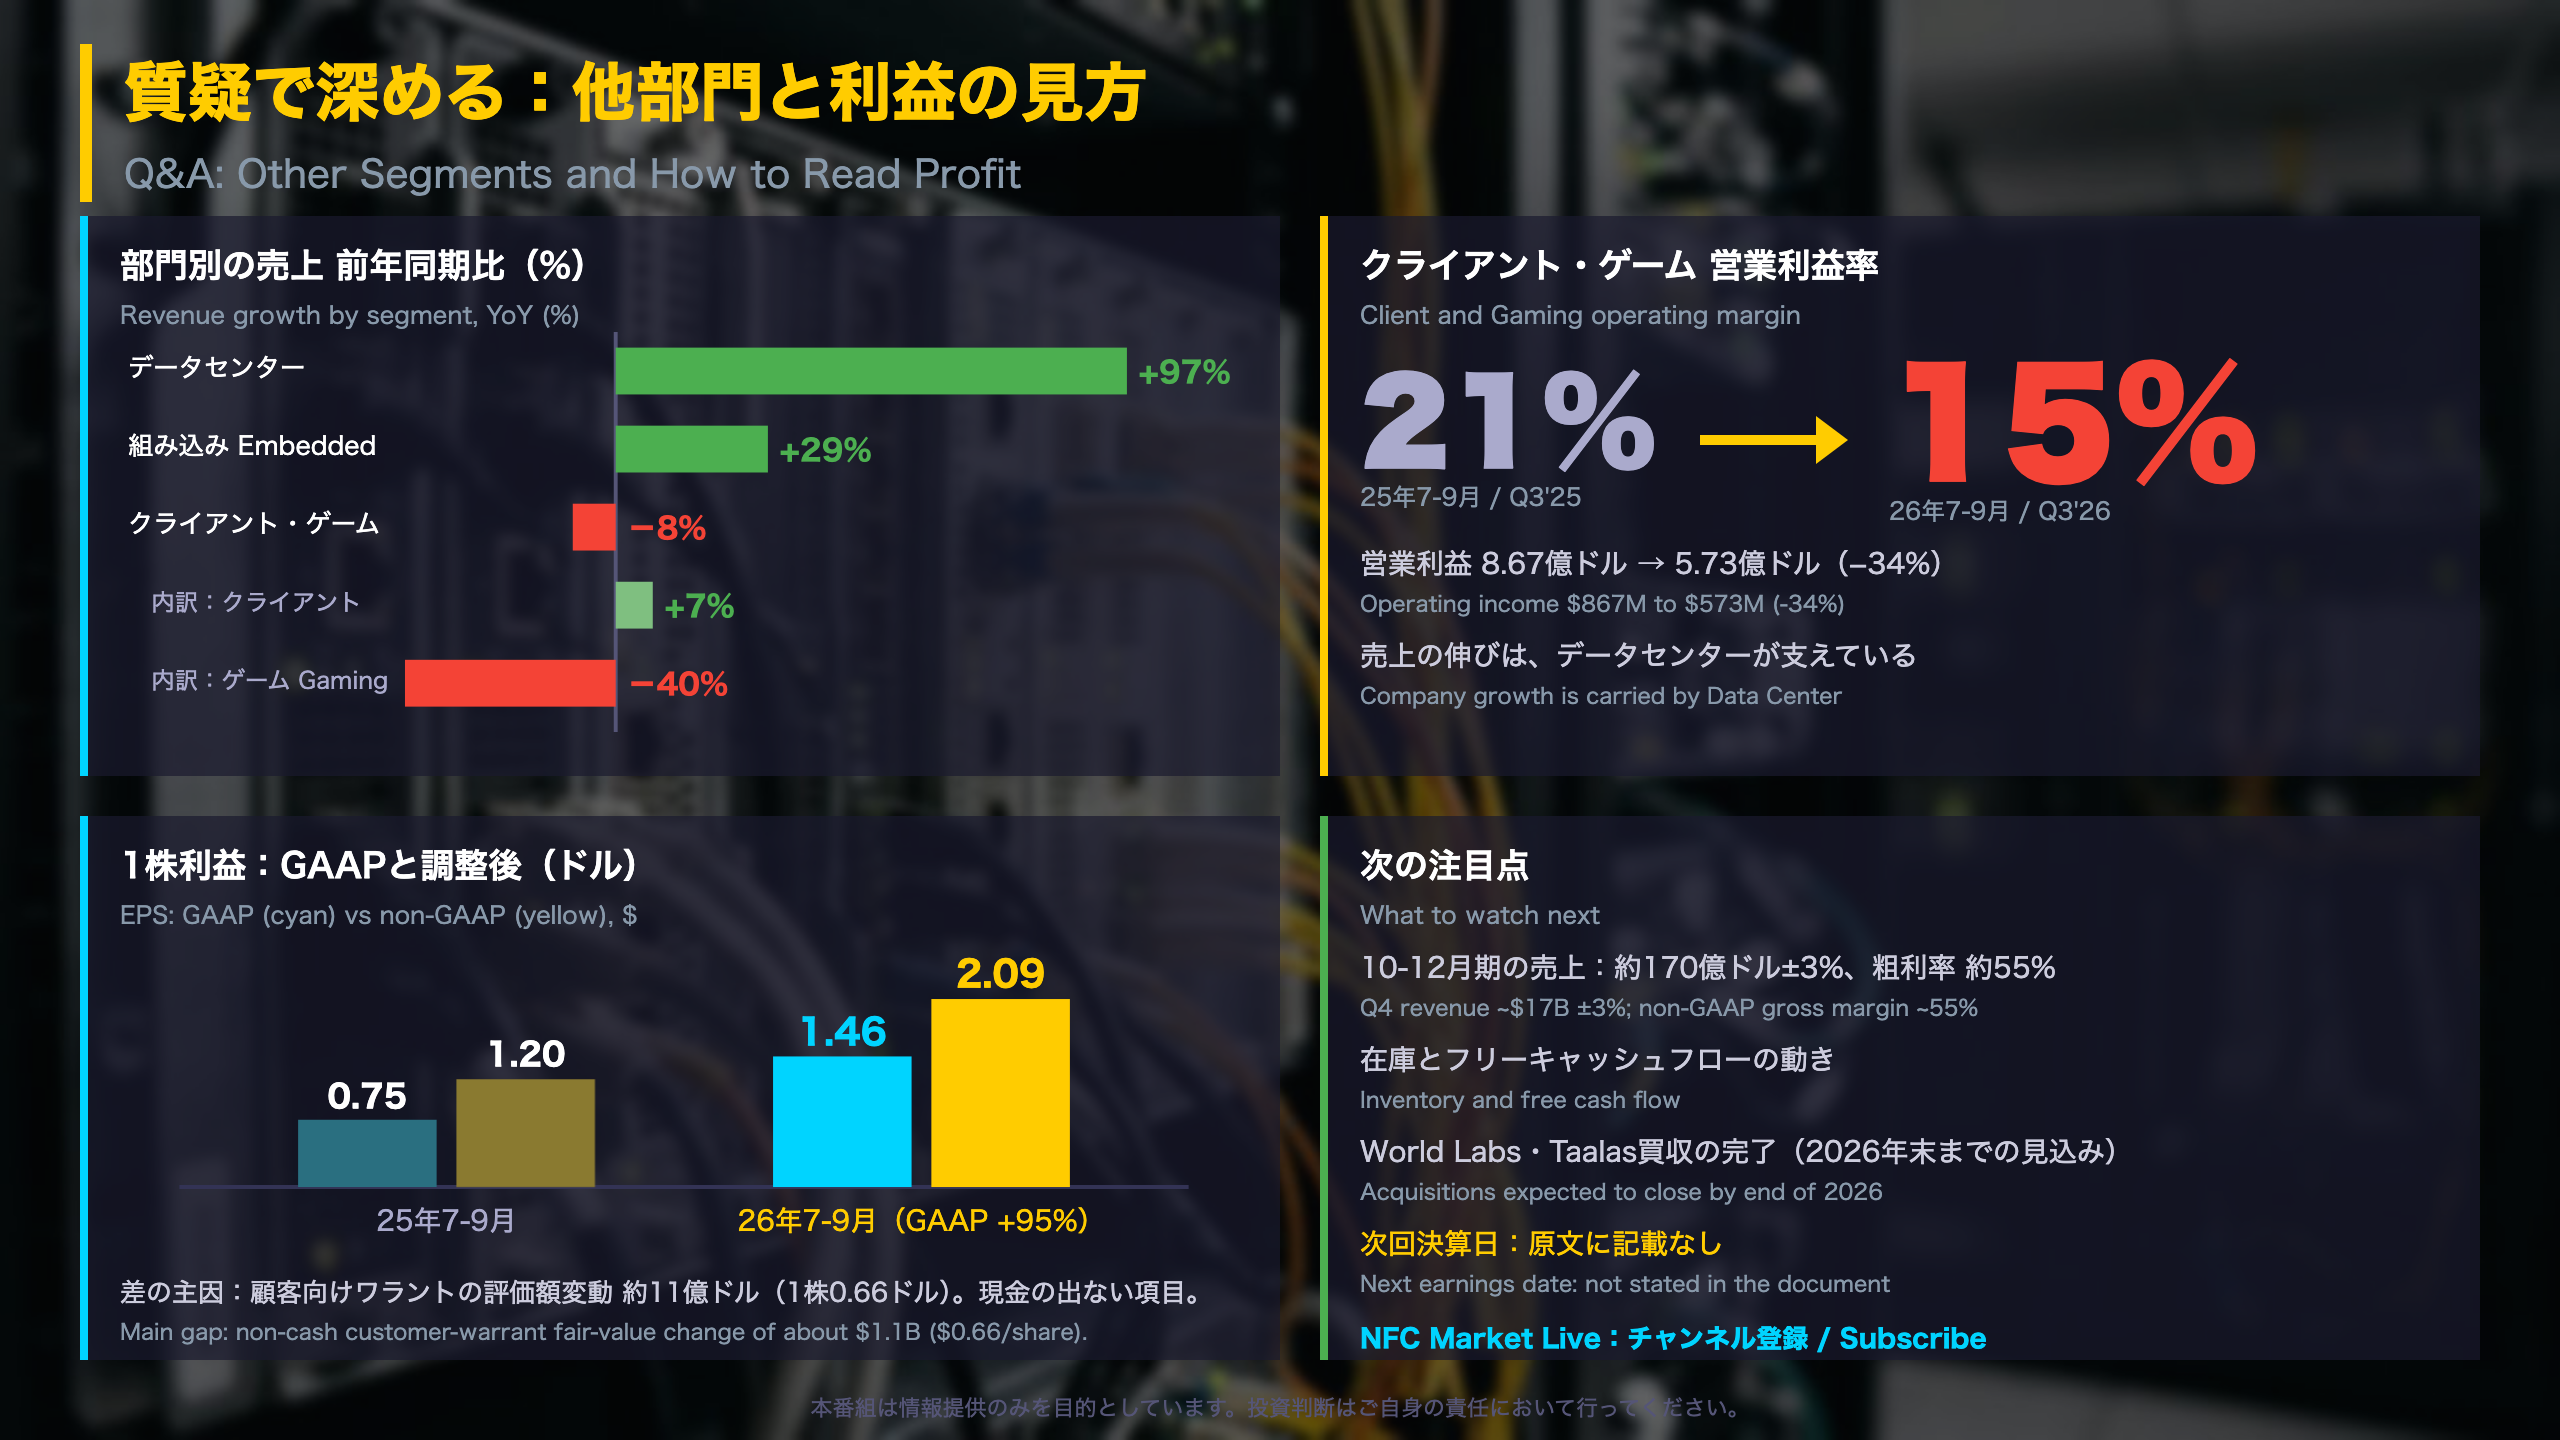
Segment scorecard
| Segment | Revenue ($M) | YoY | Operating income ($M) |
|---|---|---|---|
| Data Center | 8,546 | +97% | 2,882 (1,074 a year ago) |
| Client | 2,949 | +7% | Client and Gaming combined: 573 (867) |
| Gaming | 773 | −40% | same |
| Embedded | 1,109 | +29% | 453 (283) |
Client and Gaming revenue was $3,722 million, down 8%, and its operating margin fell from 21% to 15%. AMD cites lower semi-custom and graphics sales. Embedded margin rose from 33% to 41%, led by aerospace and defense, automotive, communications and industrial markets.
GAAP versus non-GAAP
GAAP EPS was $1.46 (+95%) and non-GAAP EPS was $2.09 (+74%). The largest swing item is the change in fair value of warrants issued to certain customers: $1,097 million, or $0.66 per share. AMD states this remeasurement is driven by changes in its share price and other valuation assumptions, so it is non-cash. Other income (expense) was −$902 million versus +$598 million last quarter, while GAAP income tax was a $555 million benefit.
Why this matters for readers outside the U.S.
In the U.S., non-GAAP figures are management-defined, so investors typically check the reconciliation table. Here the reconciliation shows GAAP earnings are exposed to share-price-linked accounting, which can make quarter-to-quarter GAAP comparisons noisy.
Two readings
- Constructive: both GAAP and non-GAAP earnings nearly doubled.
- Cautious: GAAP net income includes market-linked valuation items that can swing in either direction.
What to watch
Q4 guidance: revenue about $17 billion (±3%), non-GAAP gross margin about 55%, non-GAAP operating expenses about $3.75 billion, and about 1.668 billion diluted shares. The pending acquisitions of World Labs and Taalas are expected to close by the end of 2026, subject to approvals. The next earnings date is not stated in the document.
Disclaimer: This article is for informational purposes only. All investment decisions are made solely at your own risk.