📺 Watch the Full Video Analysis
This article was automatically generated by the NFC Market Live AI analysis system. (Updated: 2026-06-25 20:35 JST)
📄 Primary Source
Banco Central do Brasil
https://www.bcb.gov.br/content/ri/relatorioinflacao/202606/rpm202606p.pdf
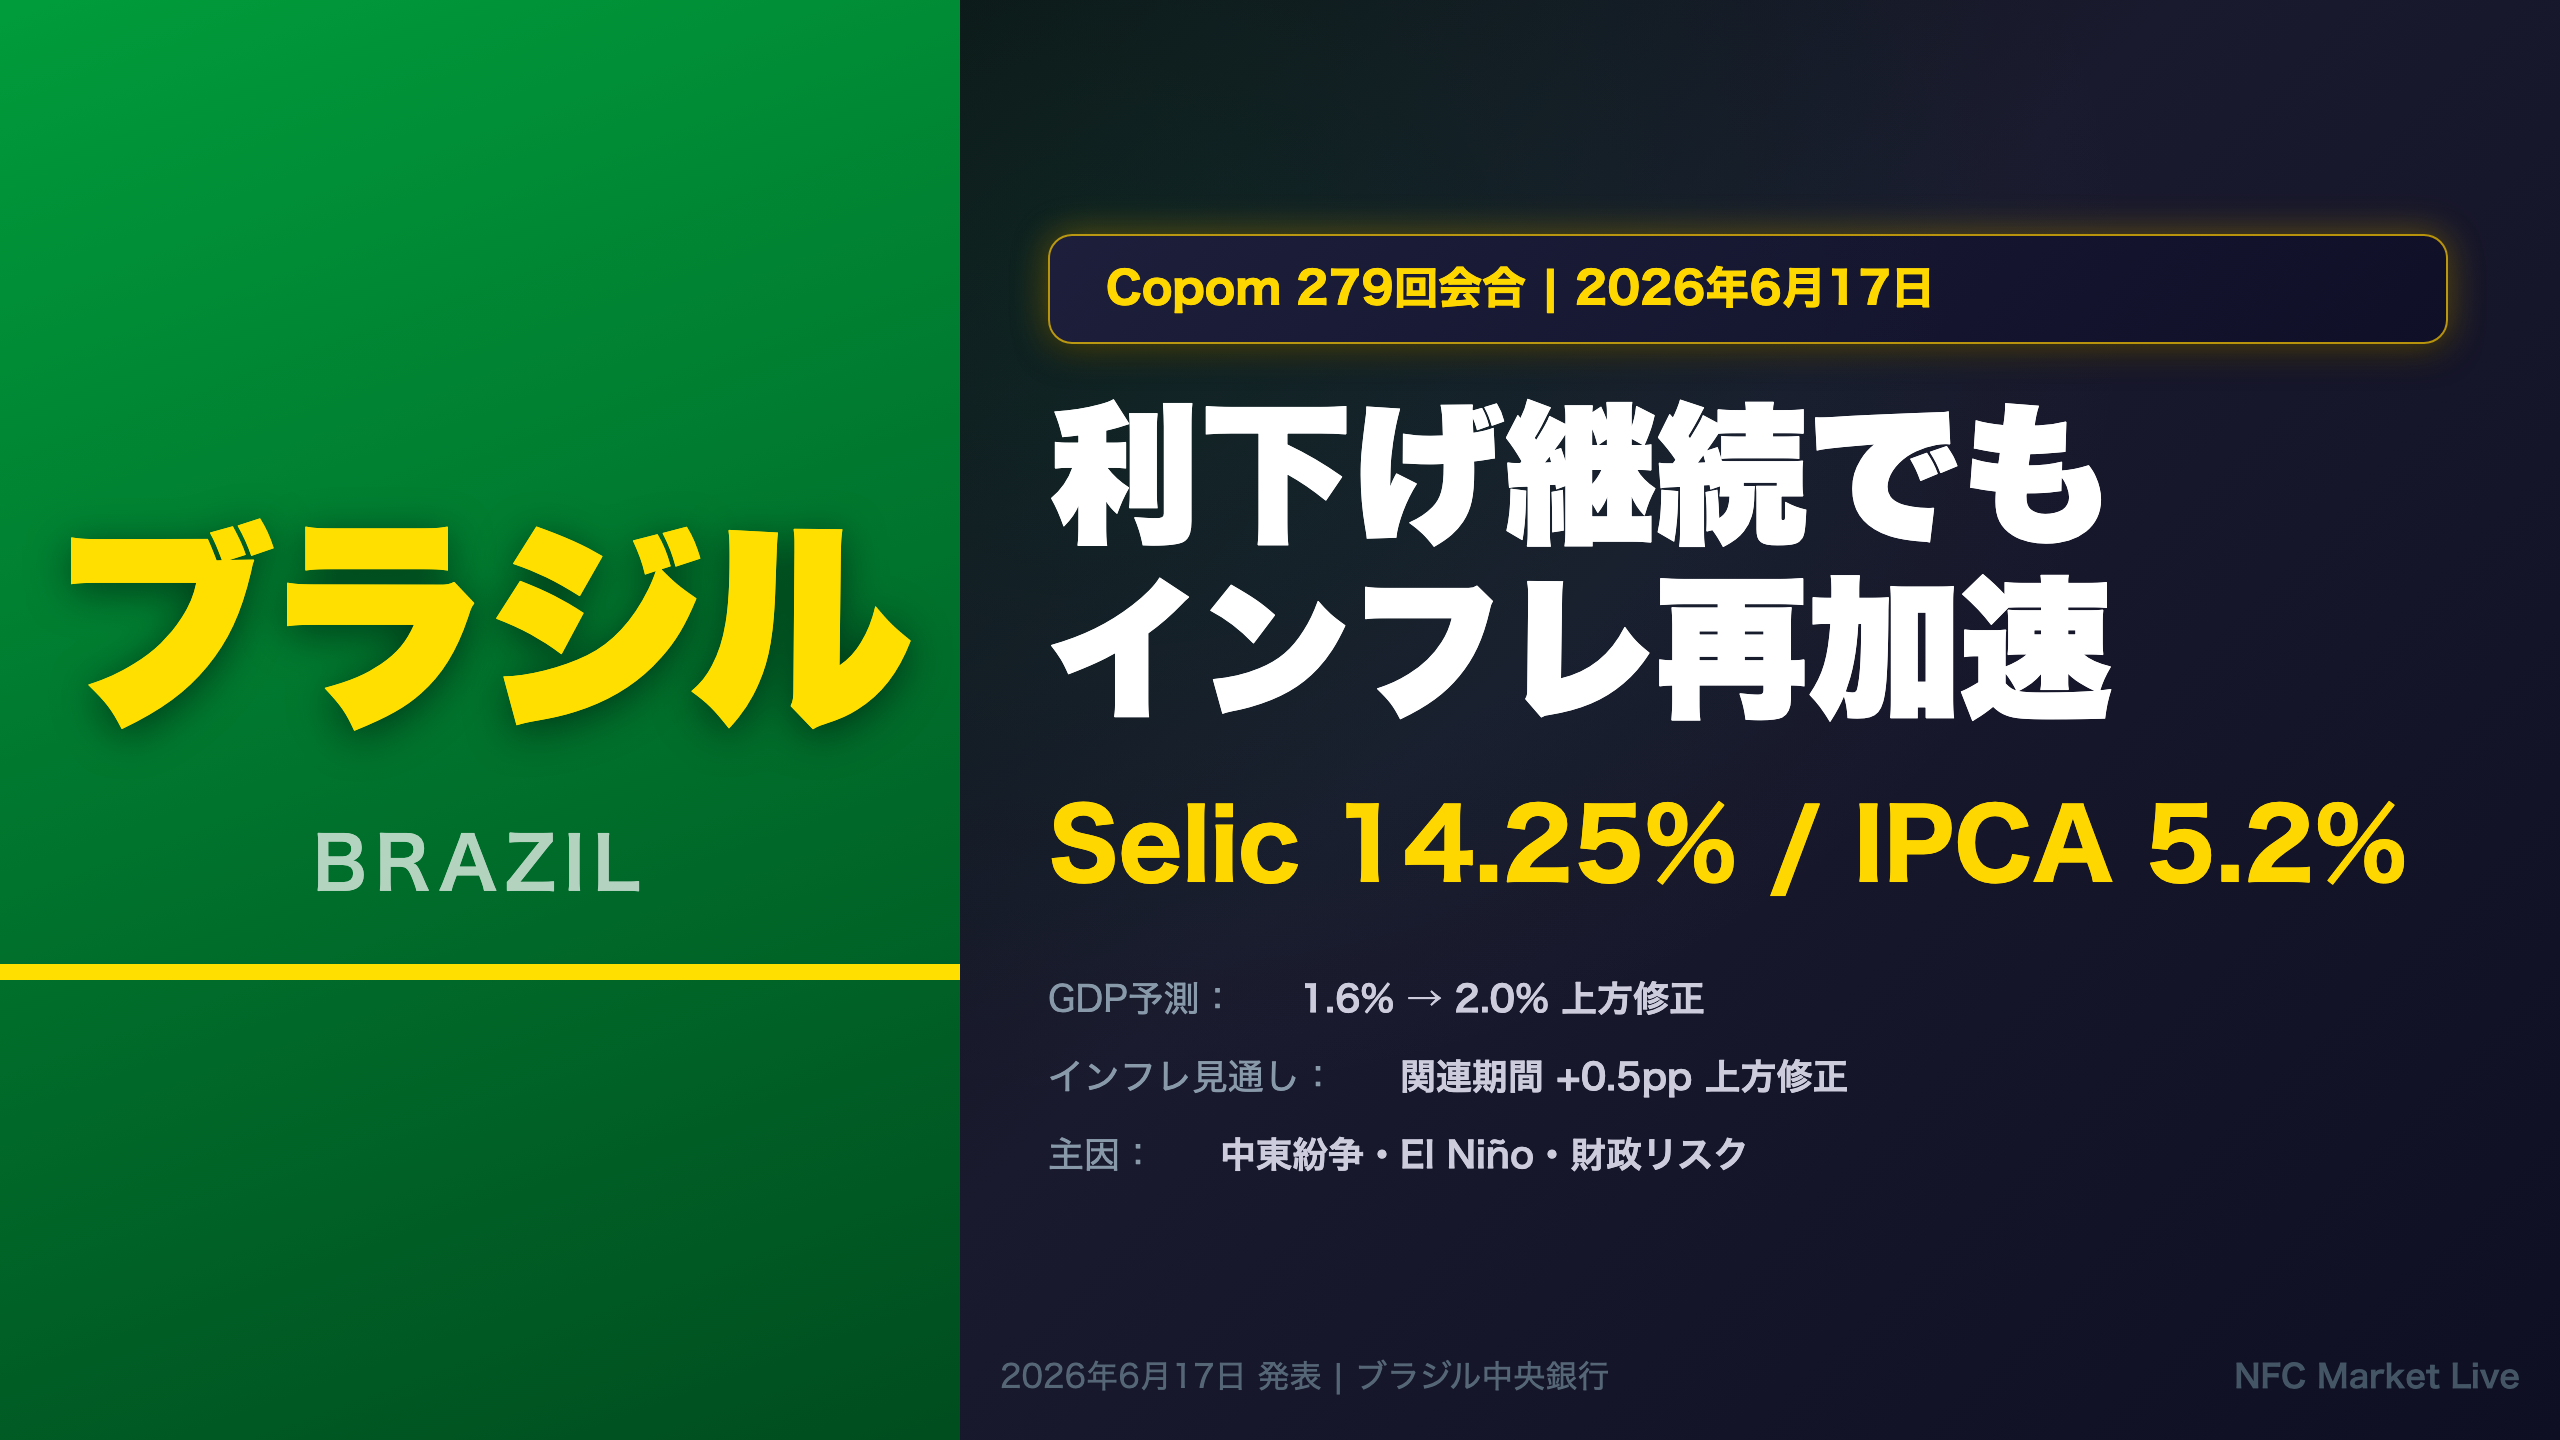
Brazil’s Copom cut the Selic rate to 14.25% on June 17, 2026, even as it sharply revised inflation projections upward (+0.5pp at the relevant horizon of Q4 2027). This deep dive unpacks the Middle East supply shock, El Niño risks, fiscal pressures, and the GDP upgrade from 1.6% to 2.0% — and what it all means for BRL, Brazilian rates, and EM assets.
The Ultimate Summary:利下げとインフレ上方修正の「矛盾」を読み解く
The Paradox: Rate Cut + Inflation Upgrade
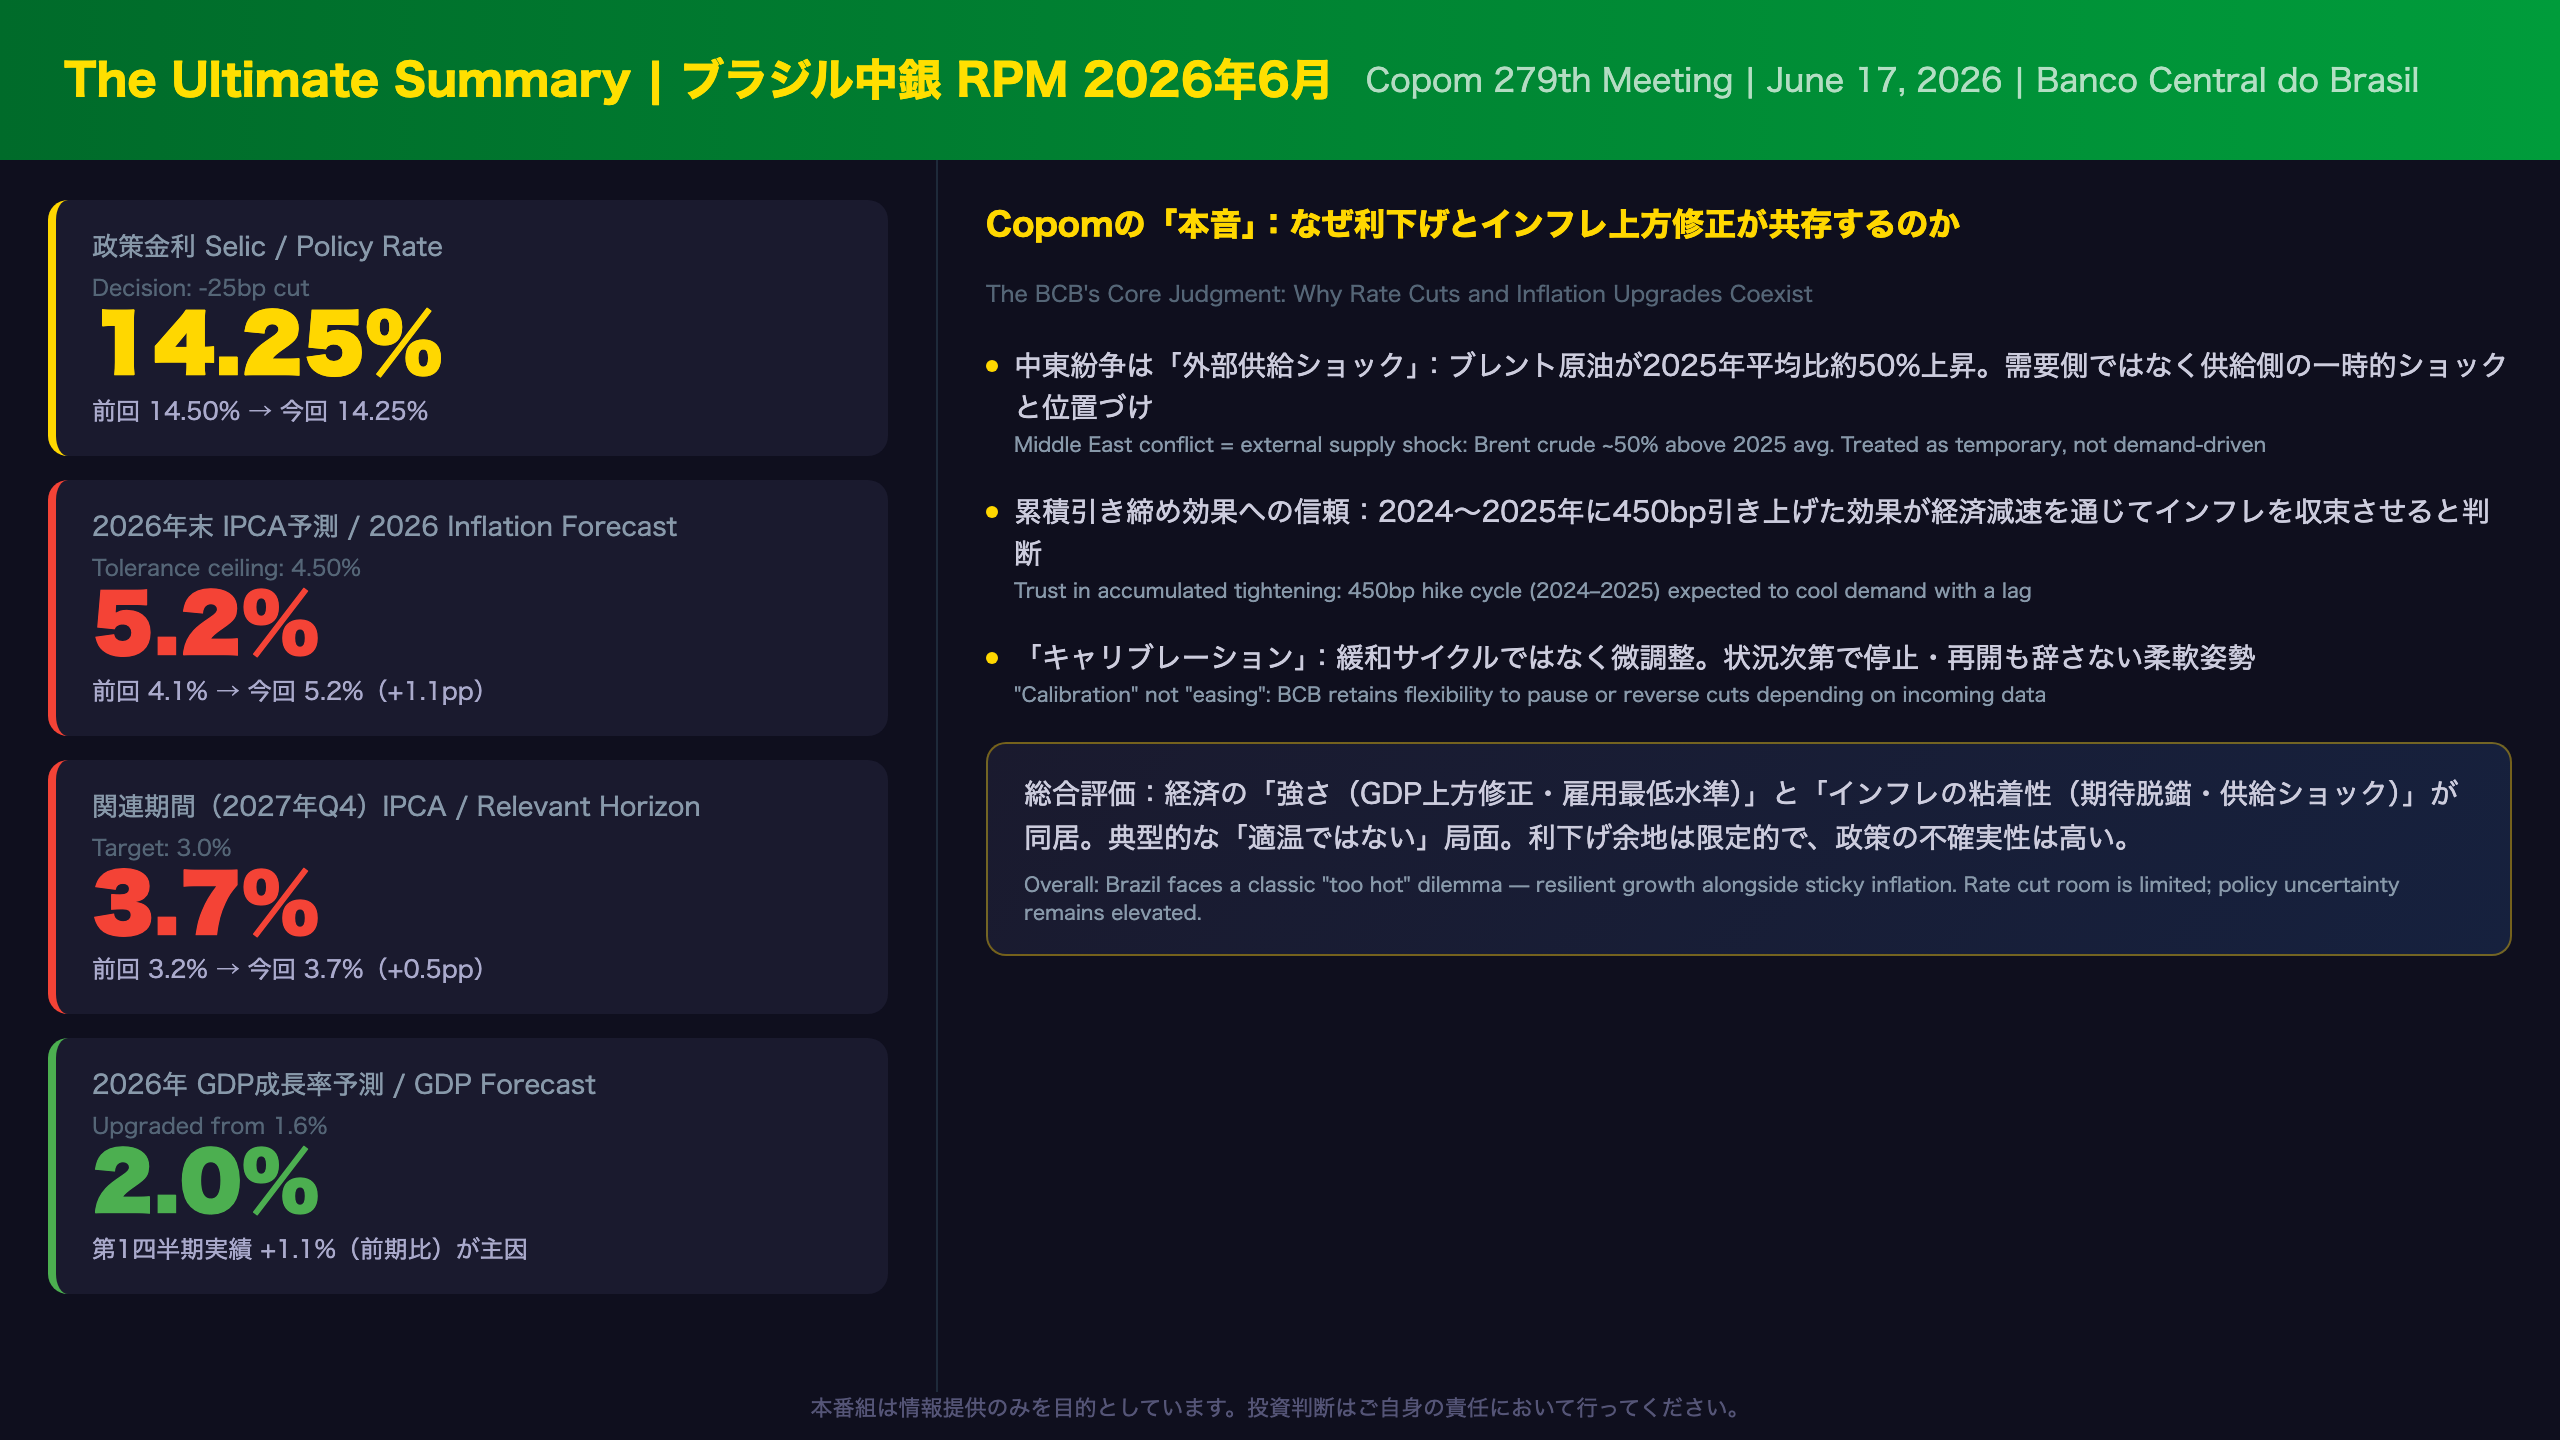
On June 17, 2026, Brazil’s Copom (Monetary Policy Committee) delivered its third consecutive 25bp rate cut, lowering the Selic to 14.25%. What makes this decision remarkable is that it came alongside a sharp upward revision to the inflation outlook — a combination rarely seen in central banking.
Key Forecast Revisions
| Indicator | March RPM | June RPM | Change |
|---|---|---|---|
| 2026 Year-End IPCA | 4.1% | 5.2% | +1.1pp |
| Q4 2027 IPCA (Relevant Horizon) | 3.2% | 3.7% | +0.5pp |
| 2026 GDP Growth | 1.6% | 2.0% | +0.4pp |
| Selic Rate | 14.50% | 14.25% | -25bp |
The Copom’s Logic
The BCB’s reasoning rests on three pillars:
-
Supply shock, not demand shock: The Middle East conflict (which erupted in late February 2026) caused Brent crude to surge roughly 50% above 2025 averages in the March–May period. The BCB treats this as a temporary external supply shock that monetary policy cannot directly address without causing unnecessary economic damage.
-
Trust in accumulated tightening: The Selic was raised from 10.50% to 15.00% between mid-2024 and June 2025 — a cumulative 450bp tightening cycle. The BCB believes these lagged effects will continue to cool demand and bring inflation back toward target.
-
“Calibration” framing: The BCB deliberately avoids calling this an “easing cycle,” instead using the term calibração (calibration). This signals flexibility — cuts can continue if inflation converges, but can be paused or reversed if conditions deteriorate.
“The degree of restriction accumulated by monetary policy allows for different interest rate trajectories compatible with inflation convergence to the target.” — Copom Statement, June 2026
The Genuine Strengths
For English-speaking investors unfamiliar with Brazil’s macro context, it’s important to note that the BCB’s inflation concern does not reflect a collapsing economy:
- Q1 2026 GDP: +1.1% QoQ, beating expectations
- Unemployment: 5.4%, a historic low
- Real wages: +5.4% YoY (PNAD survey, April 2026 quarter)
- Current account deficit: Improving from 2.9% of GDP (2025) to a projected 2.1% (2026)
These are genuine positives. The challenge is that this very resilience is also part of what keeps inflation elevated — a classic “too hot” dilemma for an emerging market central bank.
Deep Dive①:インフレの実態と期待の脱錨
Structural Inflation Analysis: Why Did It Overshoot So Badly?
The Scale of the Short-Term Surprise
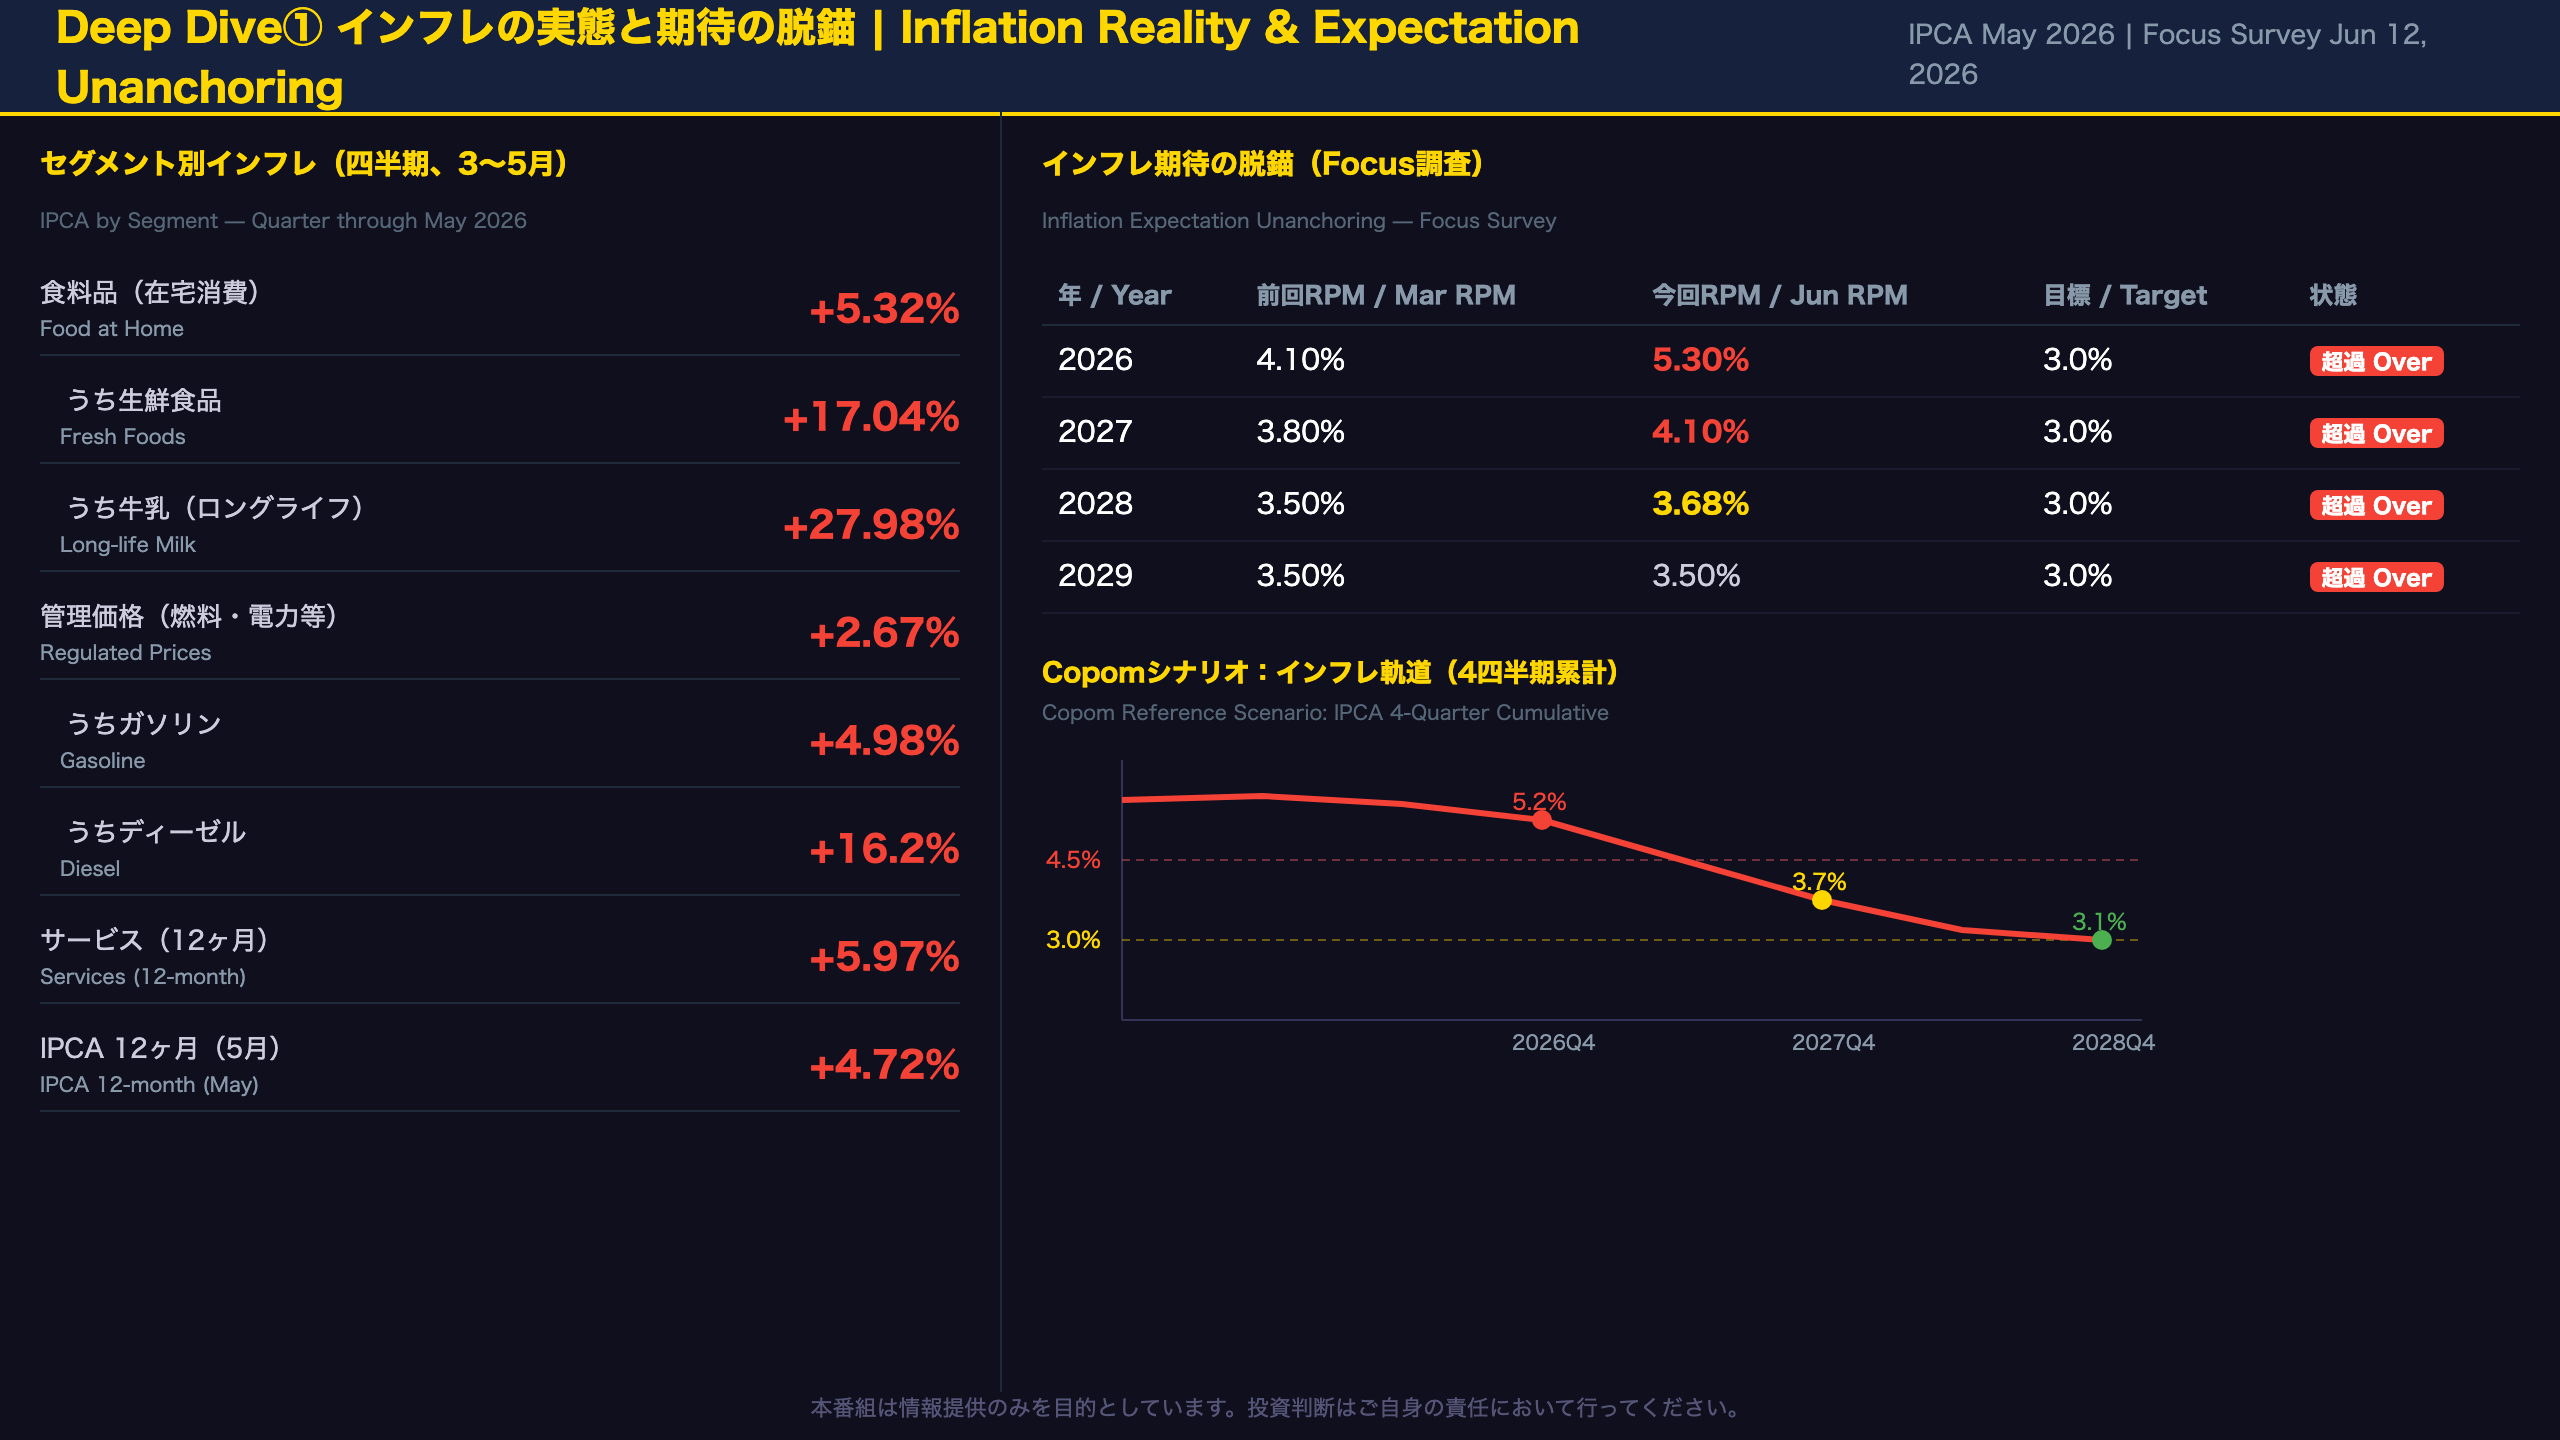
One of the most striking data points in this RPM is the magnitude of the near-term inflation surprise. The cumulative IPCA for the March–May quarter came in at 2.14%, versus the Copom’s scenario of 1.07% at the time of the March RPM — a 1.07 percentage point overshoot. This was not a one-month blip; inflation exceeded forecasts for three consecutive months.
Component-Level Deep Dive
Food at Home (Alimentação no Domicílio)
– Quarterly change: +5.32% (previous three quarters were near zero or negative)
– Fresh foods: +17.04% (seasonally adjusted annualized: +15.3%)
– Long-life milk: +27.98%
– Black beans (feijão carioca): +27.09%
– Beef: +4.78%
The combination of El Niño weather risks and Middle East conflict-driven fertilizer price spikes (urea up ~50% from February) is likely compounding food price pressures.
Regulated Prices (Preços Administrados)
– Quarterly change: +2.67%
– Gasoline: +4.98% (driven by international crude prices)
– Diesel: +16.2% (despite government subsidy measures)
– Residential electricity: +4.55% (tariff band change)
Services Inflation
– 12-month: 5.97% (nearly unchanged from 6.01% in February)
– Services ex-airfares: 5.44% (still elevated)
– Labor-intensive services: annualized >6%
For context, Brazil’s services inflation is structurally stickier than in advanced economies due to higher wage indexation and a tighter labor market. The 5.4% unemployment rate — a historic low — means wage pressures are unlikely to ease quickly.
Inflation Expectations: The Deepest Concern
The BCB’s most serious worry is that inflation expectations are becoming unanchored across all horizons, including 2028:
| Year | March RPM | June RPM | Target |
|---|---|---|---|
| 2026 | 4.10% | 5.30% | 3.0% |
| 2027 | 3.80% | 4.10% | 3.0% |
| 2028 | 3.50% | 3.68% | 3.0% |
Only 2029 remains unchanged at 3.50%. The fact that expectations for 2028 — two years out — are rising is difficult to reconcile with the “temporary supply shock” narrative and is the primary reason the BCB is maintaining a cautious tone despite cutting rates.
Key Thresholds to Watch
- If Q4 2027 IPCA projection exceeds 3.5%, rate cuts may pause
- El Niño intensity (RONI index projected to reach 2.1°C by Q4 2026)
- Effectiveness of the June 17 Middle East ceasefire MoU
Deep Dive②:GDP成長率の上方修正と経済の強さ
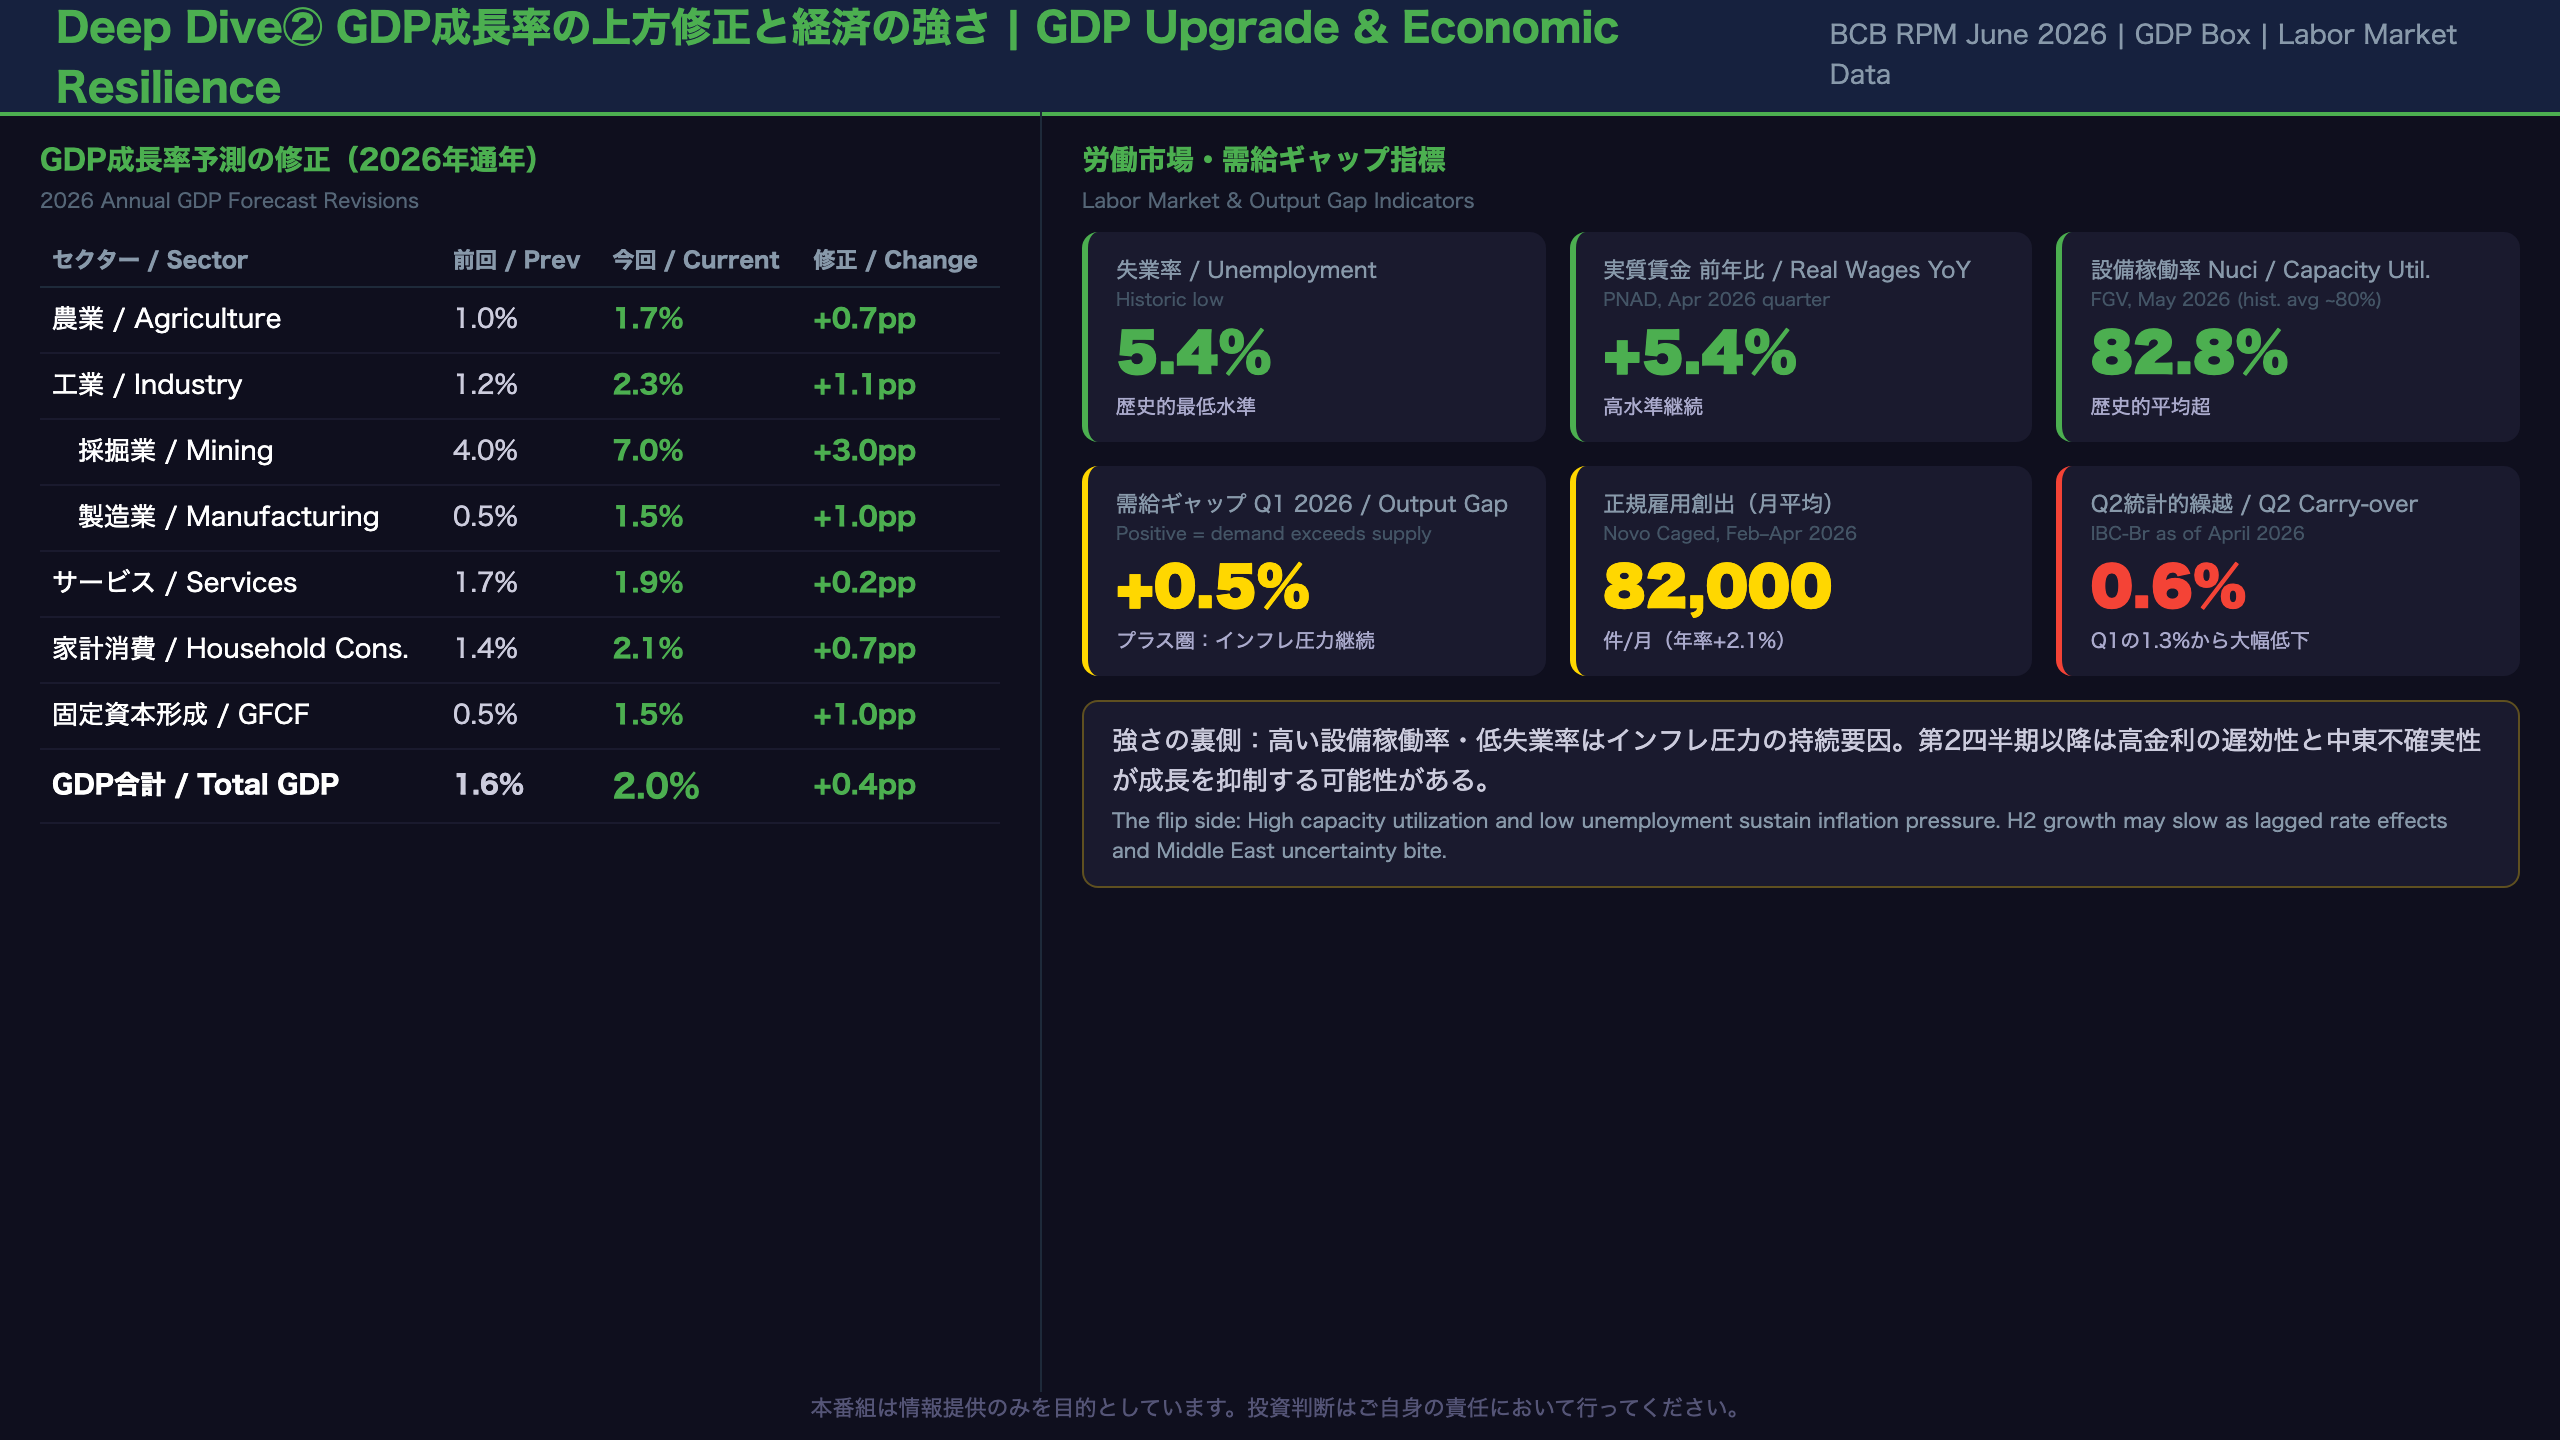
GDP Upgrade: What Is Driving Brazil’s Economic Resilience?
Q1 2026 in Detail
Brazil’s Q1 2026 GDP expanded 1.1% quarter-on-quarter using the official direct seasonal adjustment method. The indirect method (adjusting components before aggregation) yields a slightly lower 0.8%, reflecting the strong seasonal pattern of soybean harvests concentrated in Q1. The BCB urges caution in interpreting the headline figure.
Sector-Level Revisions
| Sector | Previous Forecast | Current Forecast | Change |
|---|---|---|---|
| Agriculture | 1.0% | 1.7% | +0.7pp |
| Industry | 1.2% | 2.3% | +1.1pp |
| — Mining/Extraction | 4.0% | 7.0% | +3.0pp |
| — Manufacturing | 0.5% | 1.5% | +1.0pp |
| Services | 1.7% | 1.9% | +0.2pp |
| Total GDP | 1.6% | 2.0% | +0.4pp |
The large upward revision in mining/extraction (primarily oil and gas) is notable. Brazil is a net oil exporter, and the Middle East conflict-driven crude price surge is boosting export revenues — a rare case where the conflict has a positive direct impact on Brazil’s trade balance.
Demand-Side Drivers
- Household consumption: Upgraded from 1.4% to 2.1%
- Key drivers: minimum wage increase, income tax exemption expansion (monthly income up to BRL 5,000 now tax-free), and social benefit payments
- Gross Fixed Capital Formation (FBCF): Upgraded from 0.5% to 1.5%
- Partly driven by one-off oil platform imports
- However, FBCF as a share of GDP remains below historical averages, indicating structural underinvestment
Labor Market Overheating
- Unemployment: 5.4% (historic low)
- Real wages (PNAD survey): +5.4% YoY (April 2026 quarter)
- Formal job creation: ~82,000/month average (Feb–Apr 2026)
- Industrial capacity utilization (Nuci, FGV): 82.8% in May, above the ~80% historical average
These indicators suggest the economy is running above potential. The BCB’s output gap estimate for Q1–Q2 2026 is +0.5% and +0.4% respectively — both in positive territory, meaning demand is outpacing supply capacity.
Caution: Deceleration Signals for H2 2026
The April IBC-Br (BCB’s monthly economic activity proxy) rose only 0.5% MoM, leaving a statistical carry-over for Q2 of just 0.6% — well below Q1’s 1.3%. The lagged effects of high interest rates and elevated uncertainty from the Middle East conflict are likely to weigh on growth in H2 2026.
Deep Dive③:中東紛争・El Niño・財政リスクの複合ショック
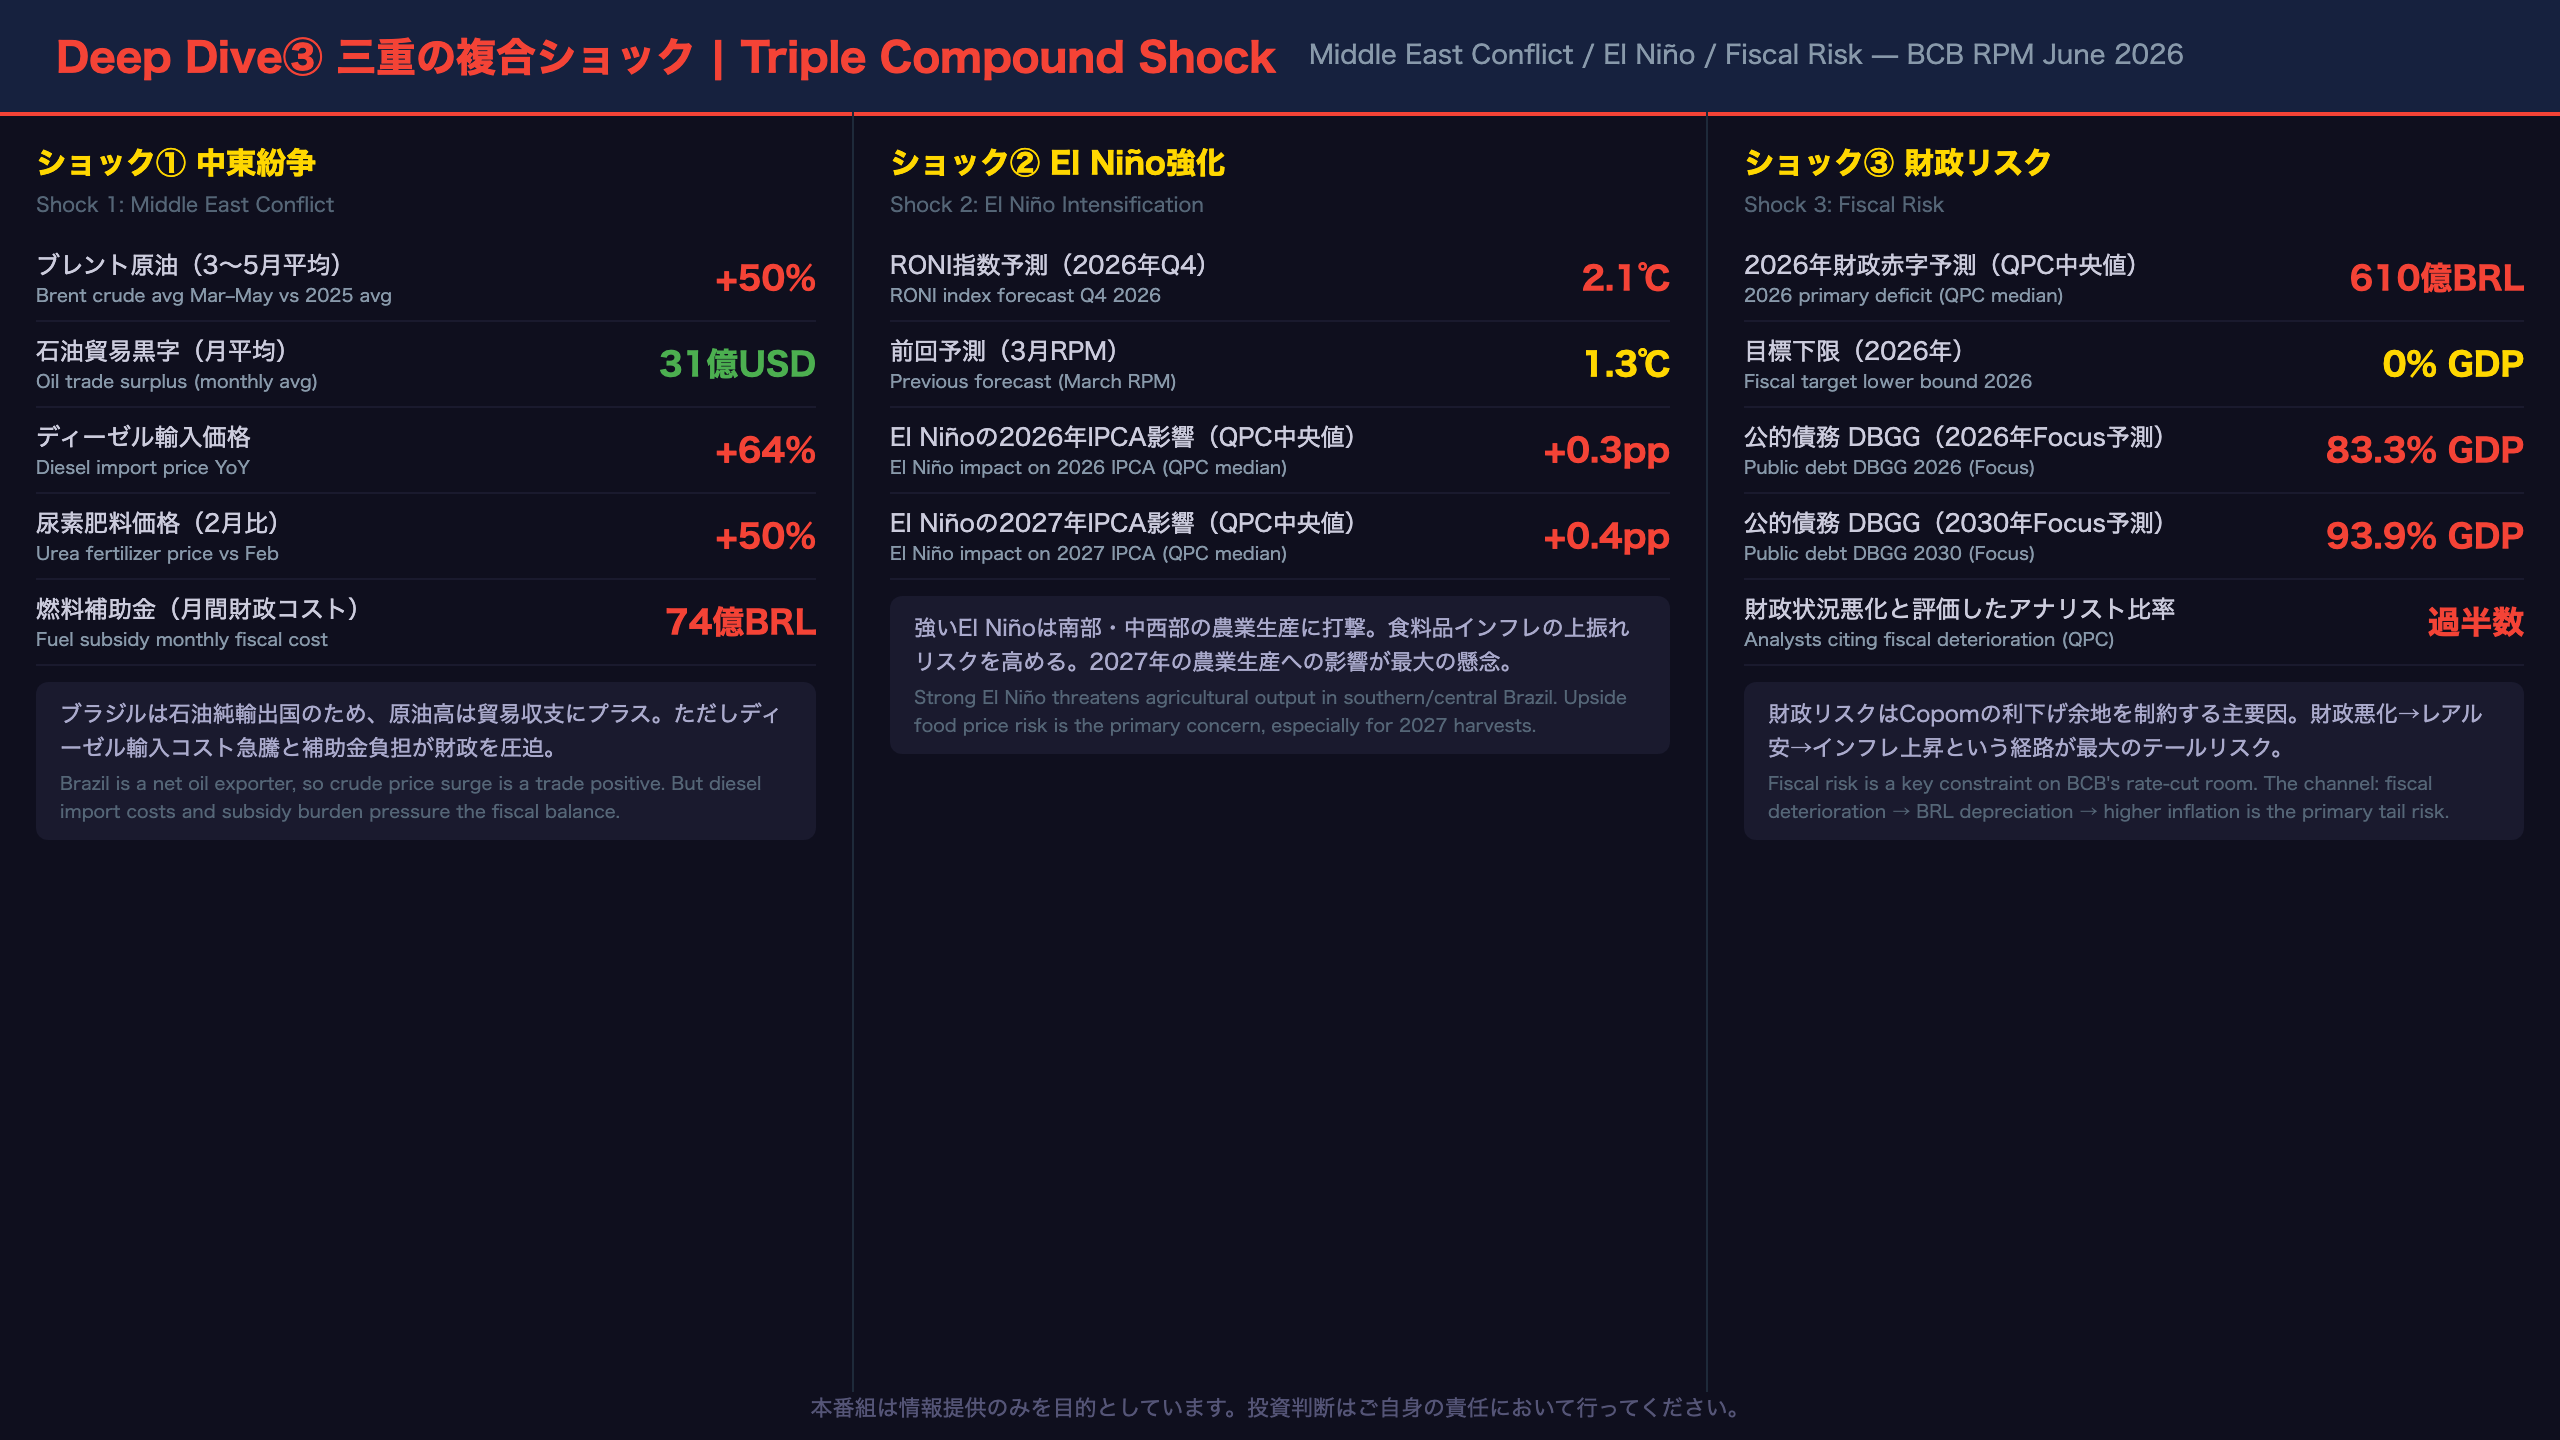
Triple Compound Shock: Middle East, El Niño, and Fiscal Risk
Shock 1: Middle East Conflict — Brazil’s Dual Role
Brazil occupies a unique position in the Middle East shock: it is both a net oil exporter (benefiting from higher prices) and a major importer of diesel and fertilizers (hurt by the same price surge).
Positive impacts:
– Oil trade surplus: Monthly average rose from ~USD 2.0bn in 2025 to ~USD 3.1bn in March–May 2026
– Export prices for crude: +28% YoY in the quarter through May
– Beef and soy export prices near 5-year highs
Negative impacts:
– Diesel import prices: +64% YoY (crack spread widening is the key driver)
– Fertilizer prices: Urea +50% from February, MAP phosphate +29.7%, potassium +9.7%
– Exports to the Middle East (poultry, corn) fell 18% in the March–May quarter
Government response (fiscal cost):
– Diesel subsidy: BRL 1.12/liter (MP 1.363)
– Gasoline subsidy: BRL 0.44/liter (MP 1.358)
– LPG subsidy: up to BRL 660mn
– Total monthly fiscal cost: ~BRL 7.4bn (~USD 1.5bn)
– Funded by: 12% oil export tax, 50% diesel export tax, tobacco IPI increase
Shock 2: El Niño Intensification
The BCB significantly upgraded its El Niño baseline scenario:
– March RPM projection: RONI index reaching 1.3°C by end-2026
– June RPM projection: RONI index reaching 2.1°C by Q4 2026
El Niño typically causes drought in Brazil’s northeast and reduced rainfall in the south/center-west agricultural belt, raising risks for soybean and corn yields. The BCB’s pre-meeting survey (QPC) estimates the median El Niño impact on 2026 IPCA at +0.3pp and on 2027 IPCA at +0.4pp.
Shock 3: Fiscal Deterioration
The central government’s primary surplus in January–April 2026 was BRL 9bn — down sharply from BRL 69bn in the same period of 2025. The main driver was a change in the payment schedule for court-ordered debt (precatórios), concentrated in March 2026.
Market consensus (QPC survey):
– 2026 primary deficit: BRL 61bn (right at the lower bound of the fiscal target)
– 2027 primary deficit: BRL 60bn (likely below the lower bound)
– Public debt (DBGG): Focus median projects 93.9% of GDP by 2030 and 99.8% by 2035 — with no stabilization in sight
The Copom explicitly states it “continues to monitor how domestic fiscal policy developments impact monetary policy and financial assets” — signaling that fiscal risk is a binding constraint on the pace of rate cuts.
インプリケーション:金融市場への含意
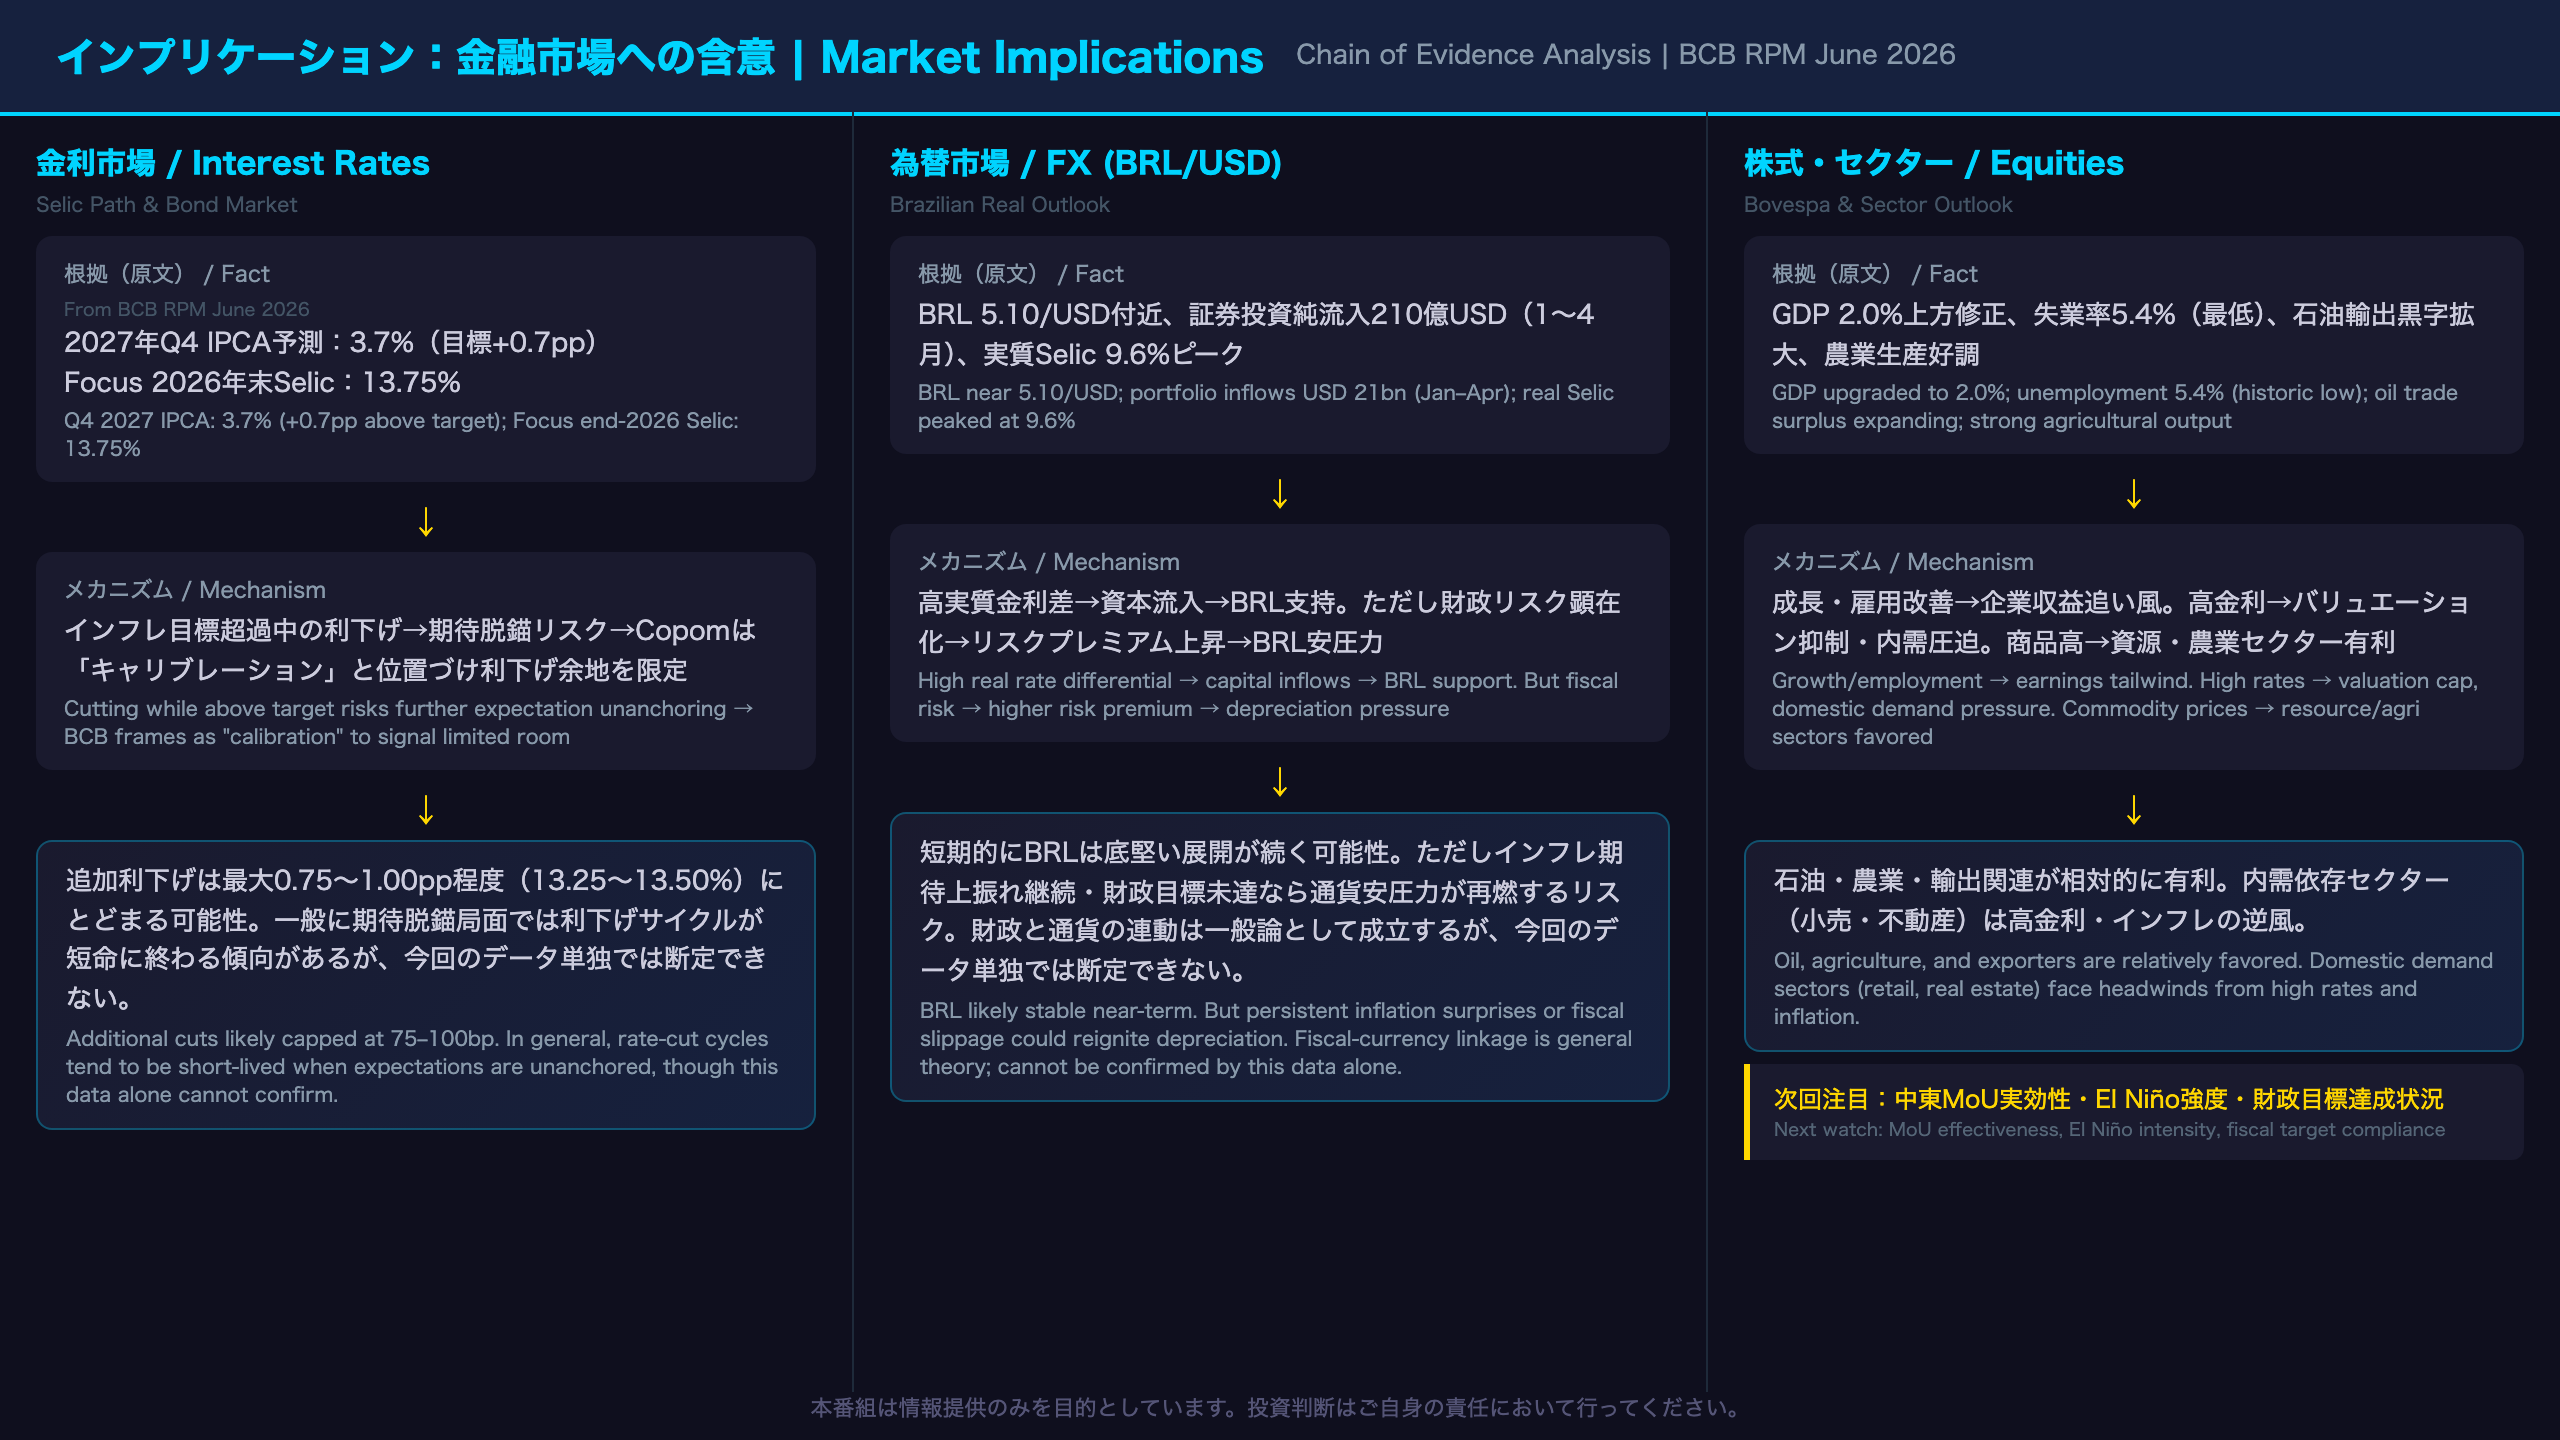
Market Implications: The Chain of Evidence
Interest Rate Market
Chain of evidence:
– Fact from report: Q4 2027 IPCA projection at 3.7% (+0.7pp above the 3% target); Focus end-2026 Selic median at 13.75%
– Economic mechanism: Cutting rates while inflation remains well above target risks further unanchoring expectations. The Copom acknowledges this by framing cuts as “calibration” rather than an easing cycle, signaling limited room for additional cuts
– Market implication: Additional cuts in 2026 are likely capped at 75–100bp (terminal rate ~13.25–13.50%). In general, rate-cut cycles tend to be short-lived when inflation expectations are significantly above target, though this data alone cannot confirm that outcome
Foreign Exchange (BRL/USD)
Chain of evidence:
– Fact from report: BRL near 5.10/USD (2.3% appreciation since March RPM); portfolio investment inflows of USD 21bn in Jan–Apr 2026 (best since 2015)
– Economic mechanism: The high real interest rate differential (ex-ante real Selic peaked at 9.6% in Q3 2025) is attracting capital inflows and supporting the BRL. However, rising fiscal risks (public debt trajectory, fiscal target miss risk) could increase risk premiums and trigger depreciation
– Market implication: BRL is likely to remain relatively stable in the near term, supported by the rate differential. However, if inflation expectations continue to rise or fiscal risks materialize, depreciation pressure could re-emerge. The fiscal-currency linkage is well-established in EM theory, but this data alone cannot determine the direction
Equity Market (Bovespa)
Chain of evidence:
– Fact from report: GDP upgraded to 2.0%, unemployment at historic low 5.4%, real wages +5.4% YoY
– Economic mechanism: Growth acceleration and employment strength support corporate earnings. However, the 14.25% Selic suppresses equity valuations and weighs on consumer discretionary and real estate demand
– Market implication: Oil (Petrobras), agriculture, and export-oriented sectors are positioned to benefit from the commodity price environment. Domestic demand-sensitive sectors (retail, real estate) face headwinds from high rates and inflation eroding real purchasing power
Key Thresholds for the Next Copom Meeting (~July–August 2026)
- If Q4 2027 IPCA projection exceeds 3.5%: rate cut pause becomes likely
- Effectiveness of the June 17 MoU ceasefire: if Brent falls back toward USD 80, inflation outlook could improve meaningfully
- El Niño intensity confirmation (RONI index actual readings)
- Fiscal target compliance for H1 2026
Disclaimer: This article is for informational purposes only. All investment decisions are made solely at your own risk.