📺 Watch the Full Video Analysis
This article was automatically generated by the NFC Market Live AI analysis system. (Updated: 2026-08-07 07:09 JST)
📄 Primary Source
Ministério do Desenvolvimento
https://balanca.economia.gov.br/balanca/publicacoes_dados_consolidados/tabelas/nota/Nota.pdf
A deep dive into Brazil’s July 2026 trade data from MDIC/SECEX. 📊
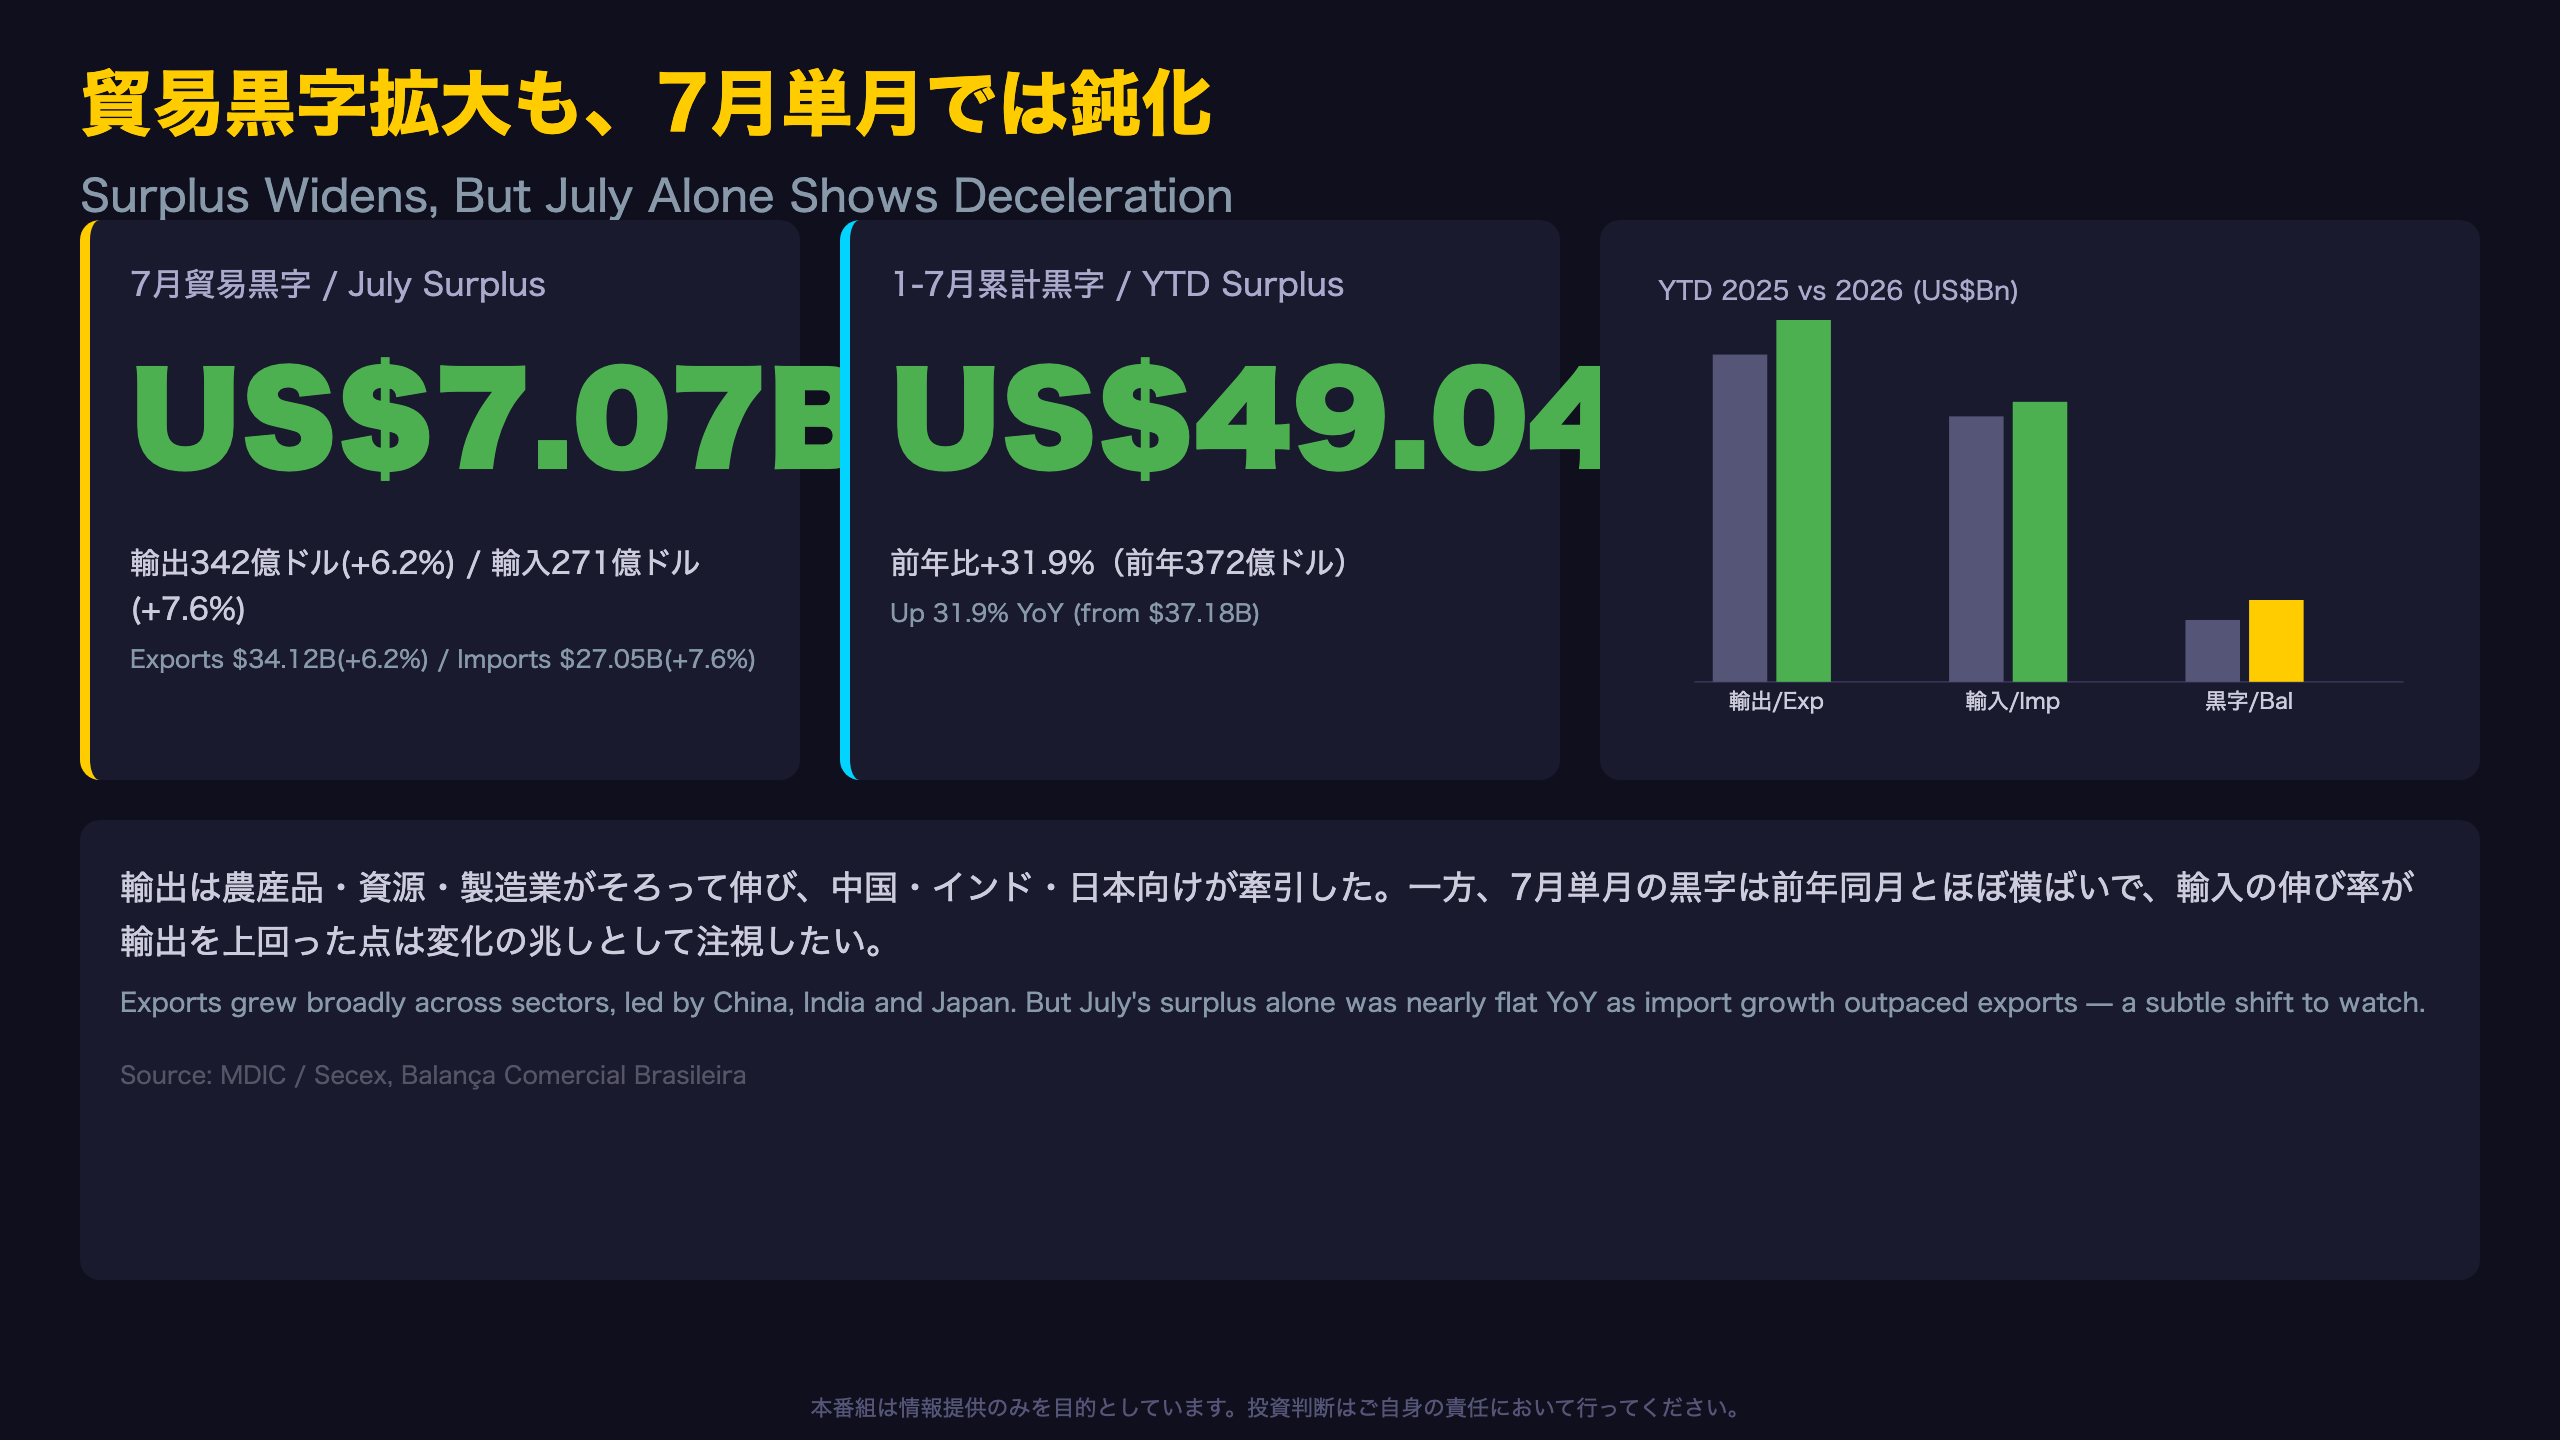
July’s surplus was $7.07B, with the Jan-Jul cumulative surplus at $49.04B, up 31.9% YoY.
📈 Exports to Asia surged, led by China, India and Japan.
⚠️ But July’s monthly surplus was nearly flat YoY, while US-Brazil trade fell double digits both ways.
💡 We break down the surplus momentum shift and what the US trade decline could mean for BRL, with balanced bull/bear analysis.
貿易黒字拡大も、7月単月では鈍化の兆し
Understanding MDIC/SECEX and Brazil’s Trade Reporting
Brazil’s trade balance is compiled monthly by SECEX, part of the Ministry of Industry, Trade and Services (MDIC). Unlike the U.S. Census Bureau’s trade release, Brazil publishes a weekly breakdown within each month, offering rare intra-month granularity.
A weekly lens reveals nuance
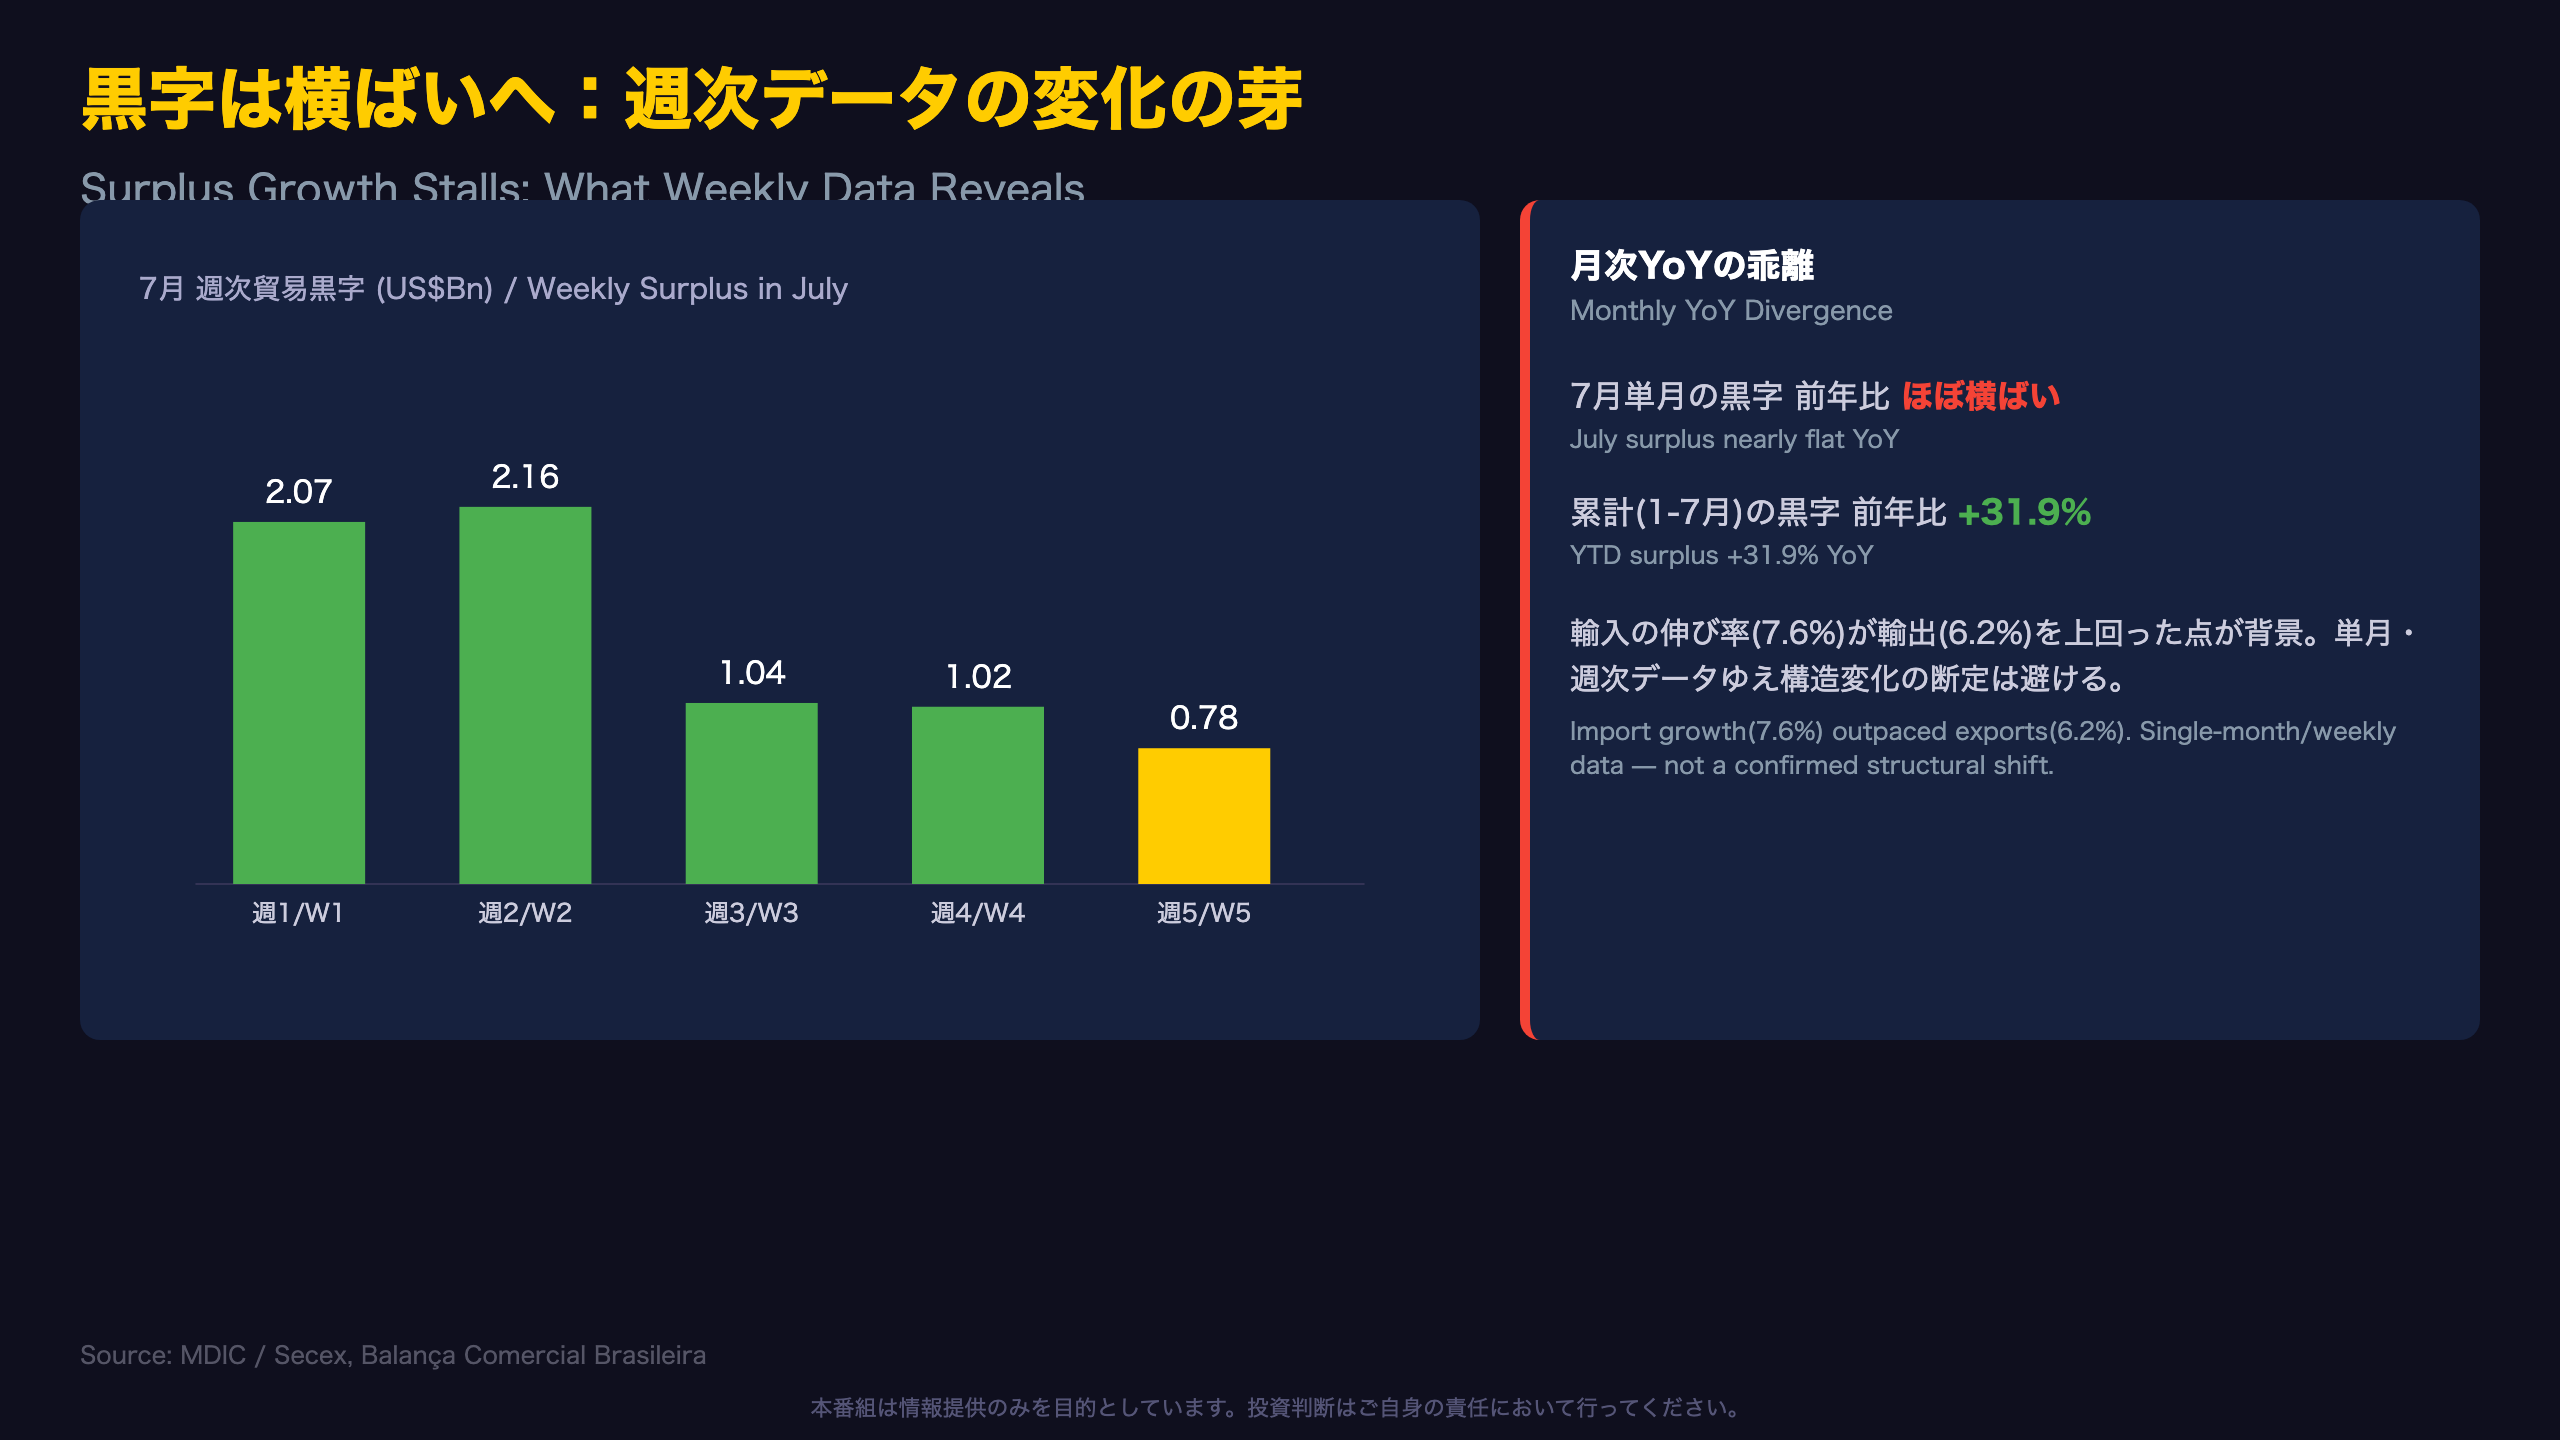
The July weekly table shows the surplus shrinking steadily: $2.07B, $2.16B, $1.04B, $1.02B, and $0.78B in week five. On a monthly basis, July’s $7.07B surplus was barely above July 2025’s implied $7.00B, even though exports and imports both grew 6-8% YoY. This divergence — strong YTD surplus growth (+31.9%) versus flat monthly growth — is the key nuance in this release.
International comparison
Brazil’s export base is more diversified than single-commodity peers: soybeans, crude oil, iron ore, beef and pulp all contributed, with the extractive sector (mining and crude) growing fastest at +21.3% YTD.
Market implications
A widening cumulative surplus is generally supportive of BRL through the current account, all else equal. But a stalling monthly pace, combined with sharply declining U.S. trade (-12.2% exports, -10.4% imports YTD), suggests investors should watch whether Brazil’s export engine is losing steam just as import demand accelerates. This is not a confirmed reversal from one month of data, but it warrants monitoring in August.
黒字は横ばいへ、週次データが示す変化の芽
Why the Monthly Surplus Barely Grew
Beneath the flat headline surplus lies accelerating energy trade on both sides of the ledger. Refined petroleum product exports (“óleos combustíveis”) jumped 63.0% YoY (+$530 million), while crude and refined fuel imports also grew, reflecting Brazil’s dual role as both a growing crude exporter and a persistent refined-product importer.
Reading the weekly data with caution
SECEX’s weekly breakdown — a granularity rarely available in other G20 trade releases — showed the surplus declining from $2.07B in week one to $0.78B in week five. Import settlement often clusters toward month-end in Brazil’s accounting, which could partly explain this. Five data points within one month is too small a sample to declare a structural shift.
Bull vs. bear framing
Bulls note both exports and imports rising simultaneously signals healthy trade activity, and $7.07B remains a historically solid monthly surplus. Bears highlight that import growth (7.6%) outpacing export growth (6.2%) for the first time this year could foreshadow margin compression on the surplus if the pattern persists — though this remains a single-month observation, not a confirmed trend.
輸出は資源主導で多角化進む
Brazil’s Export Mix: Commodities Still Dominate, But Diversifying
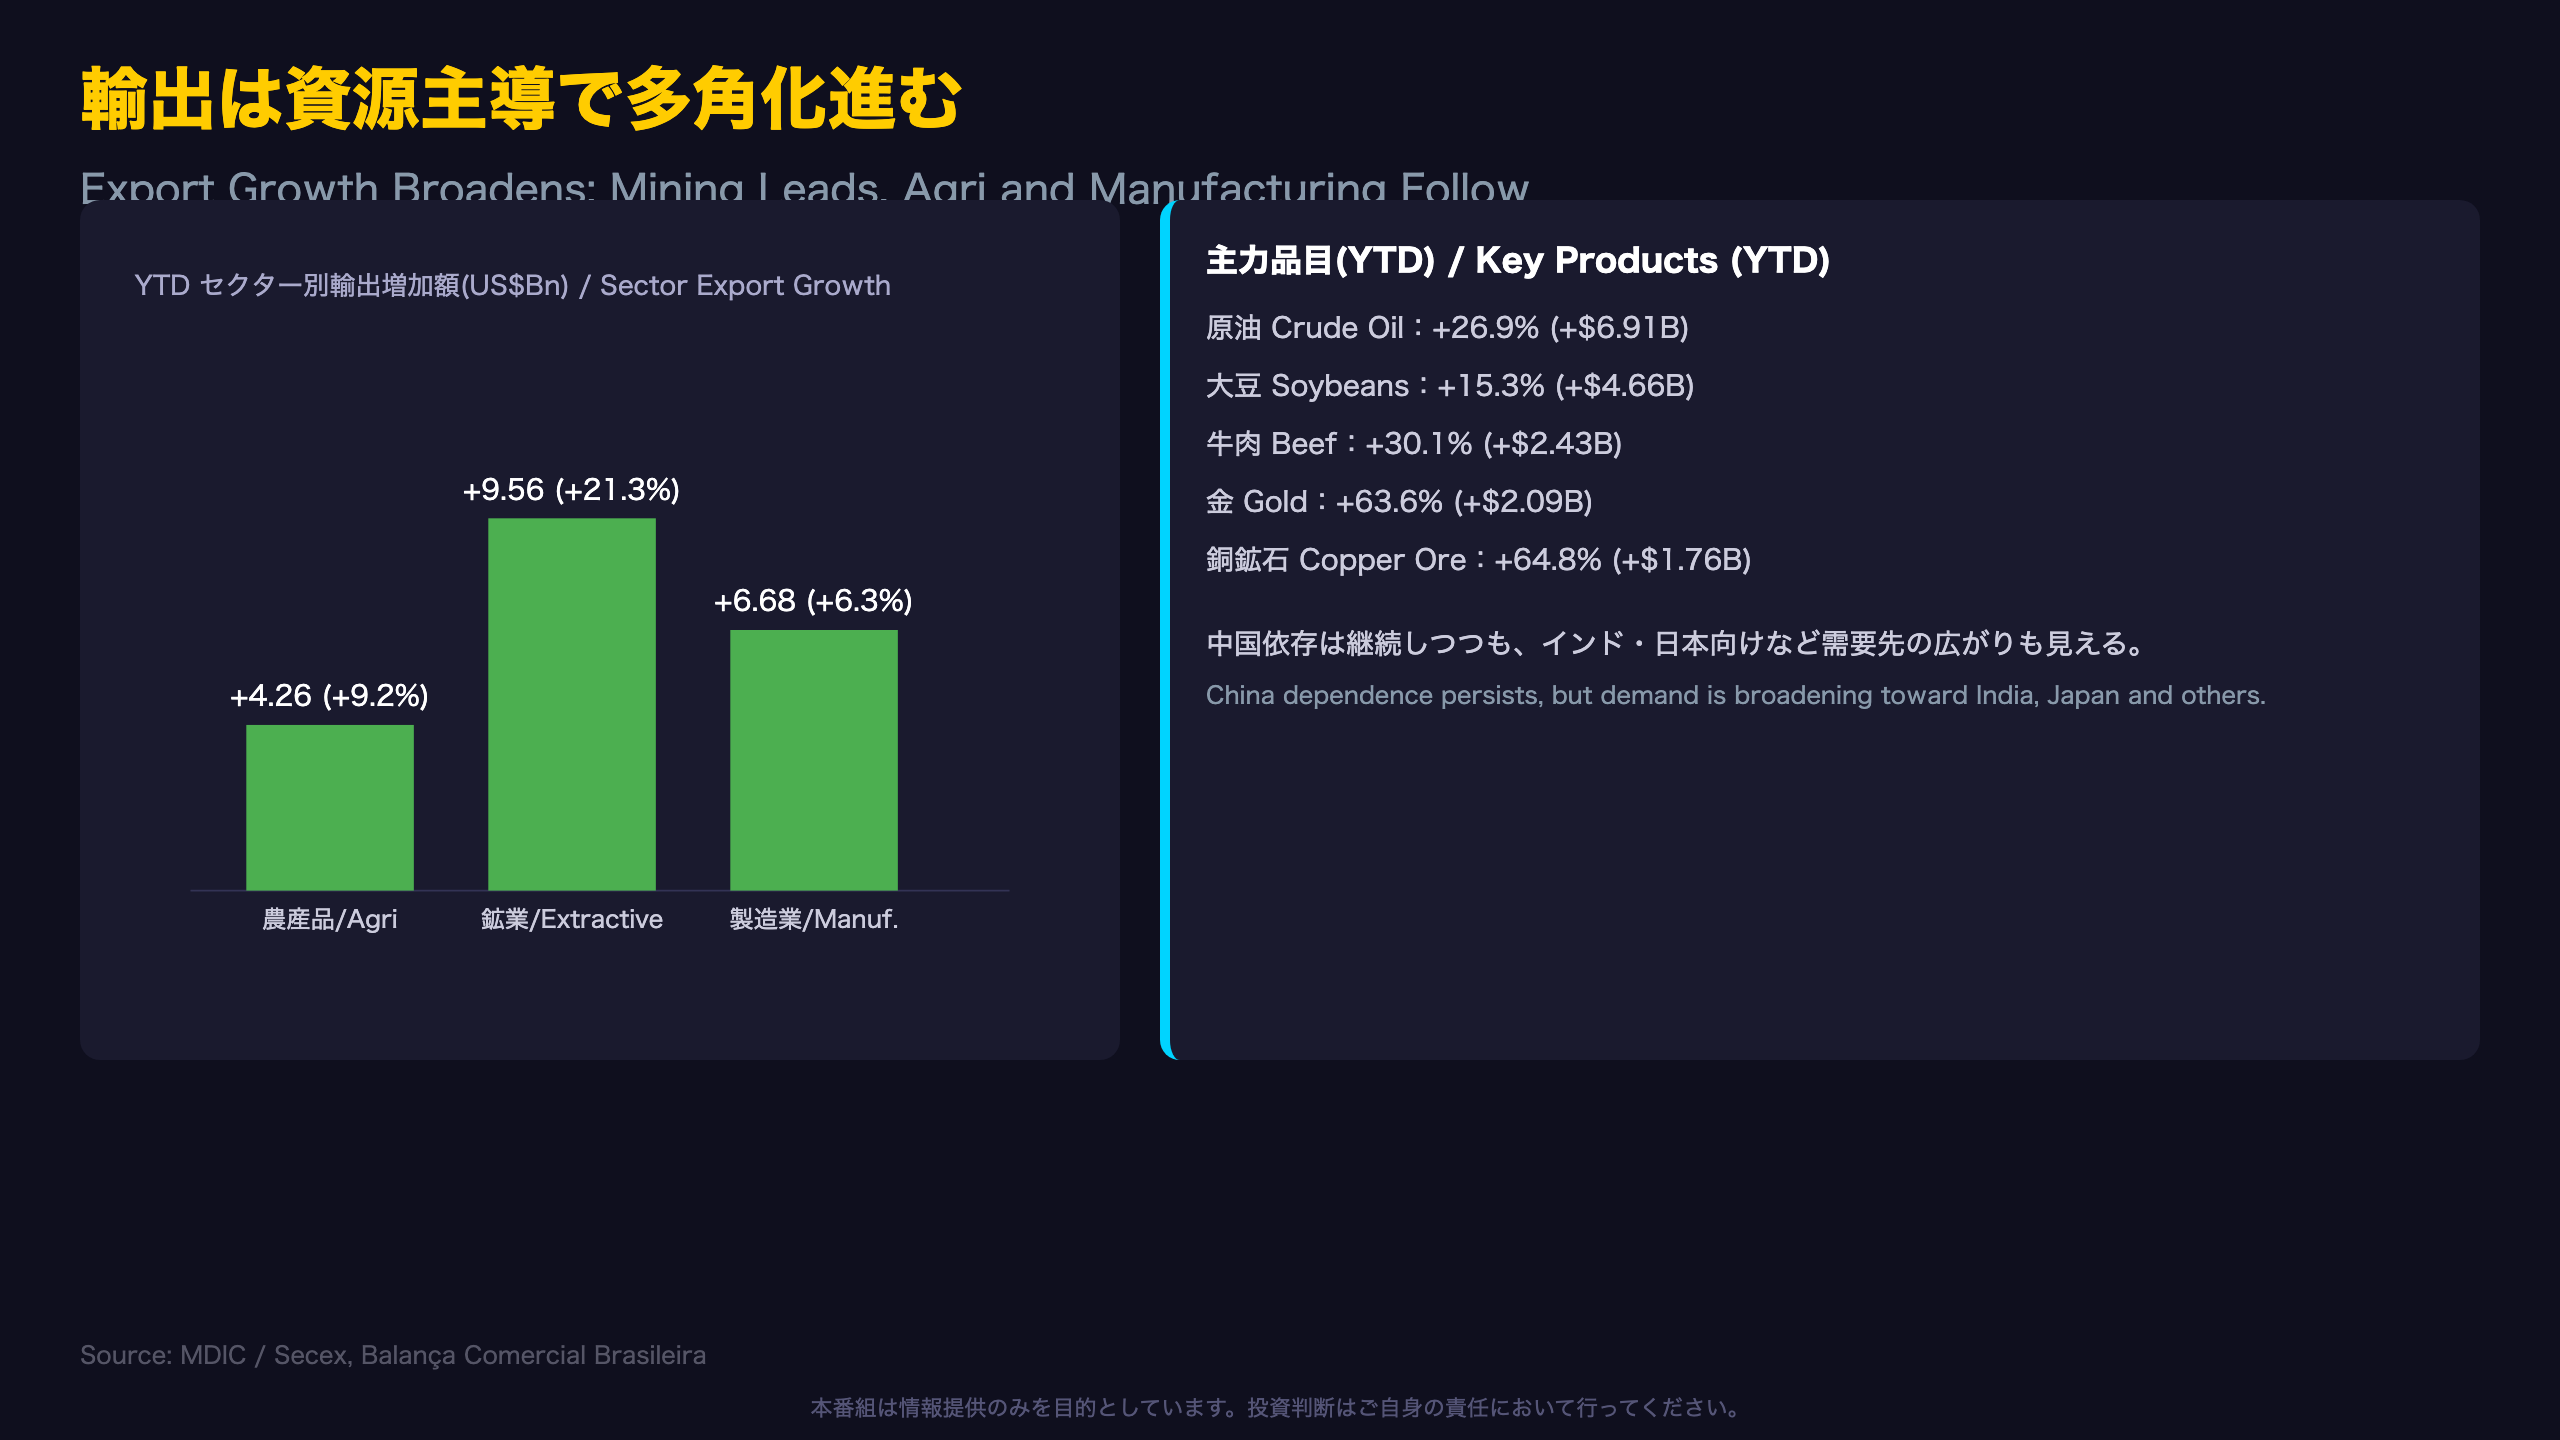
Brazil’s extractive sector grew fastest at +21.3% YTD, outpacing agriculture (+9.2%) and manufacturing (+6.3%). This might suggest a “re-commoditization” of exports. However, in dollar terms, agriculture still added $4.26 billion, with soybeans (+15.3%, +$4.66B) remaining the largest single export category.
Value-added products are quietly growing too
Within manufacturing, pulp/cellulose (+30.8% in July), poultry (+31.8% in July), and beef (+30.1% YTD, +$2.43B) point to Brazil’s role as an increasingly sophisticated processor of its own agricultural output, not merely a raw commodity exporter.
China concentration risk remains structural
China-bound exports rose 19.7% YTD (+$11.3B), still the largest destination by far. Crude oil exports to China alone jumped 48.2% in July (+$1.1B). Brazil’s export trajectory remains closely tied to Chinese demand cycles — a key macro risk factor for FX and commodity traders.
What to watch next
August data will show whether the seasonal soybean shipment peak is tapering, and whether crude oil can sustain its role as primary growth driver.
資本財・半導体輸入が急増、内需回復のシグナルか
South Korea’s Import Surge: A Standalone Data Point
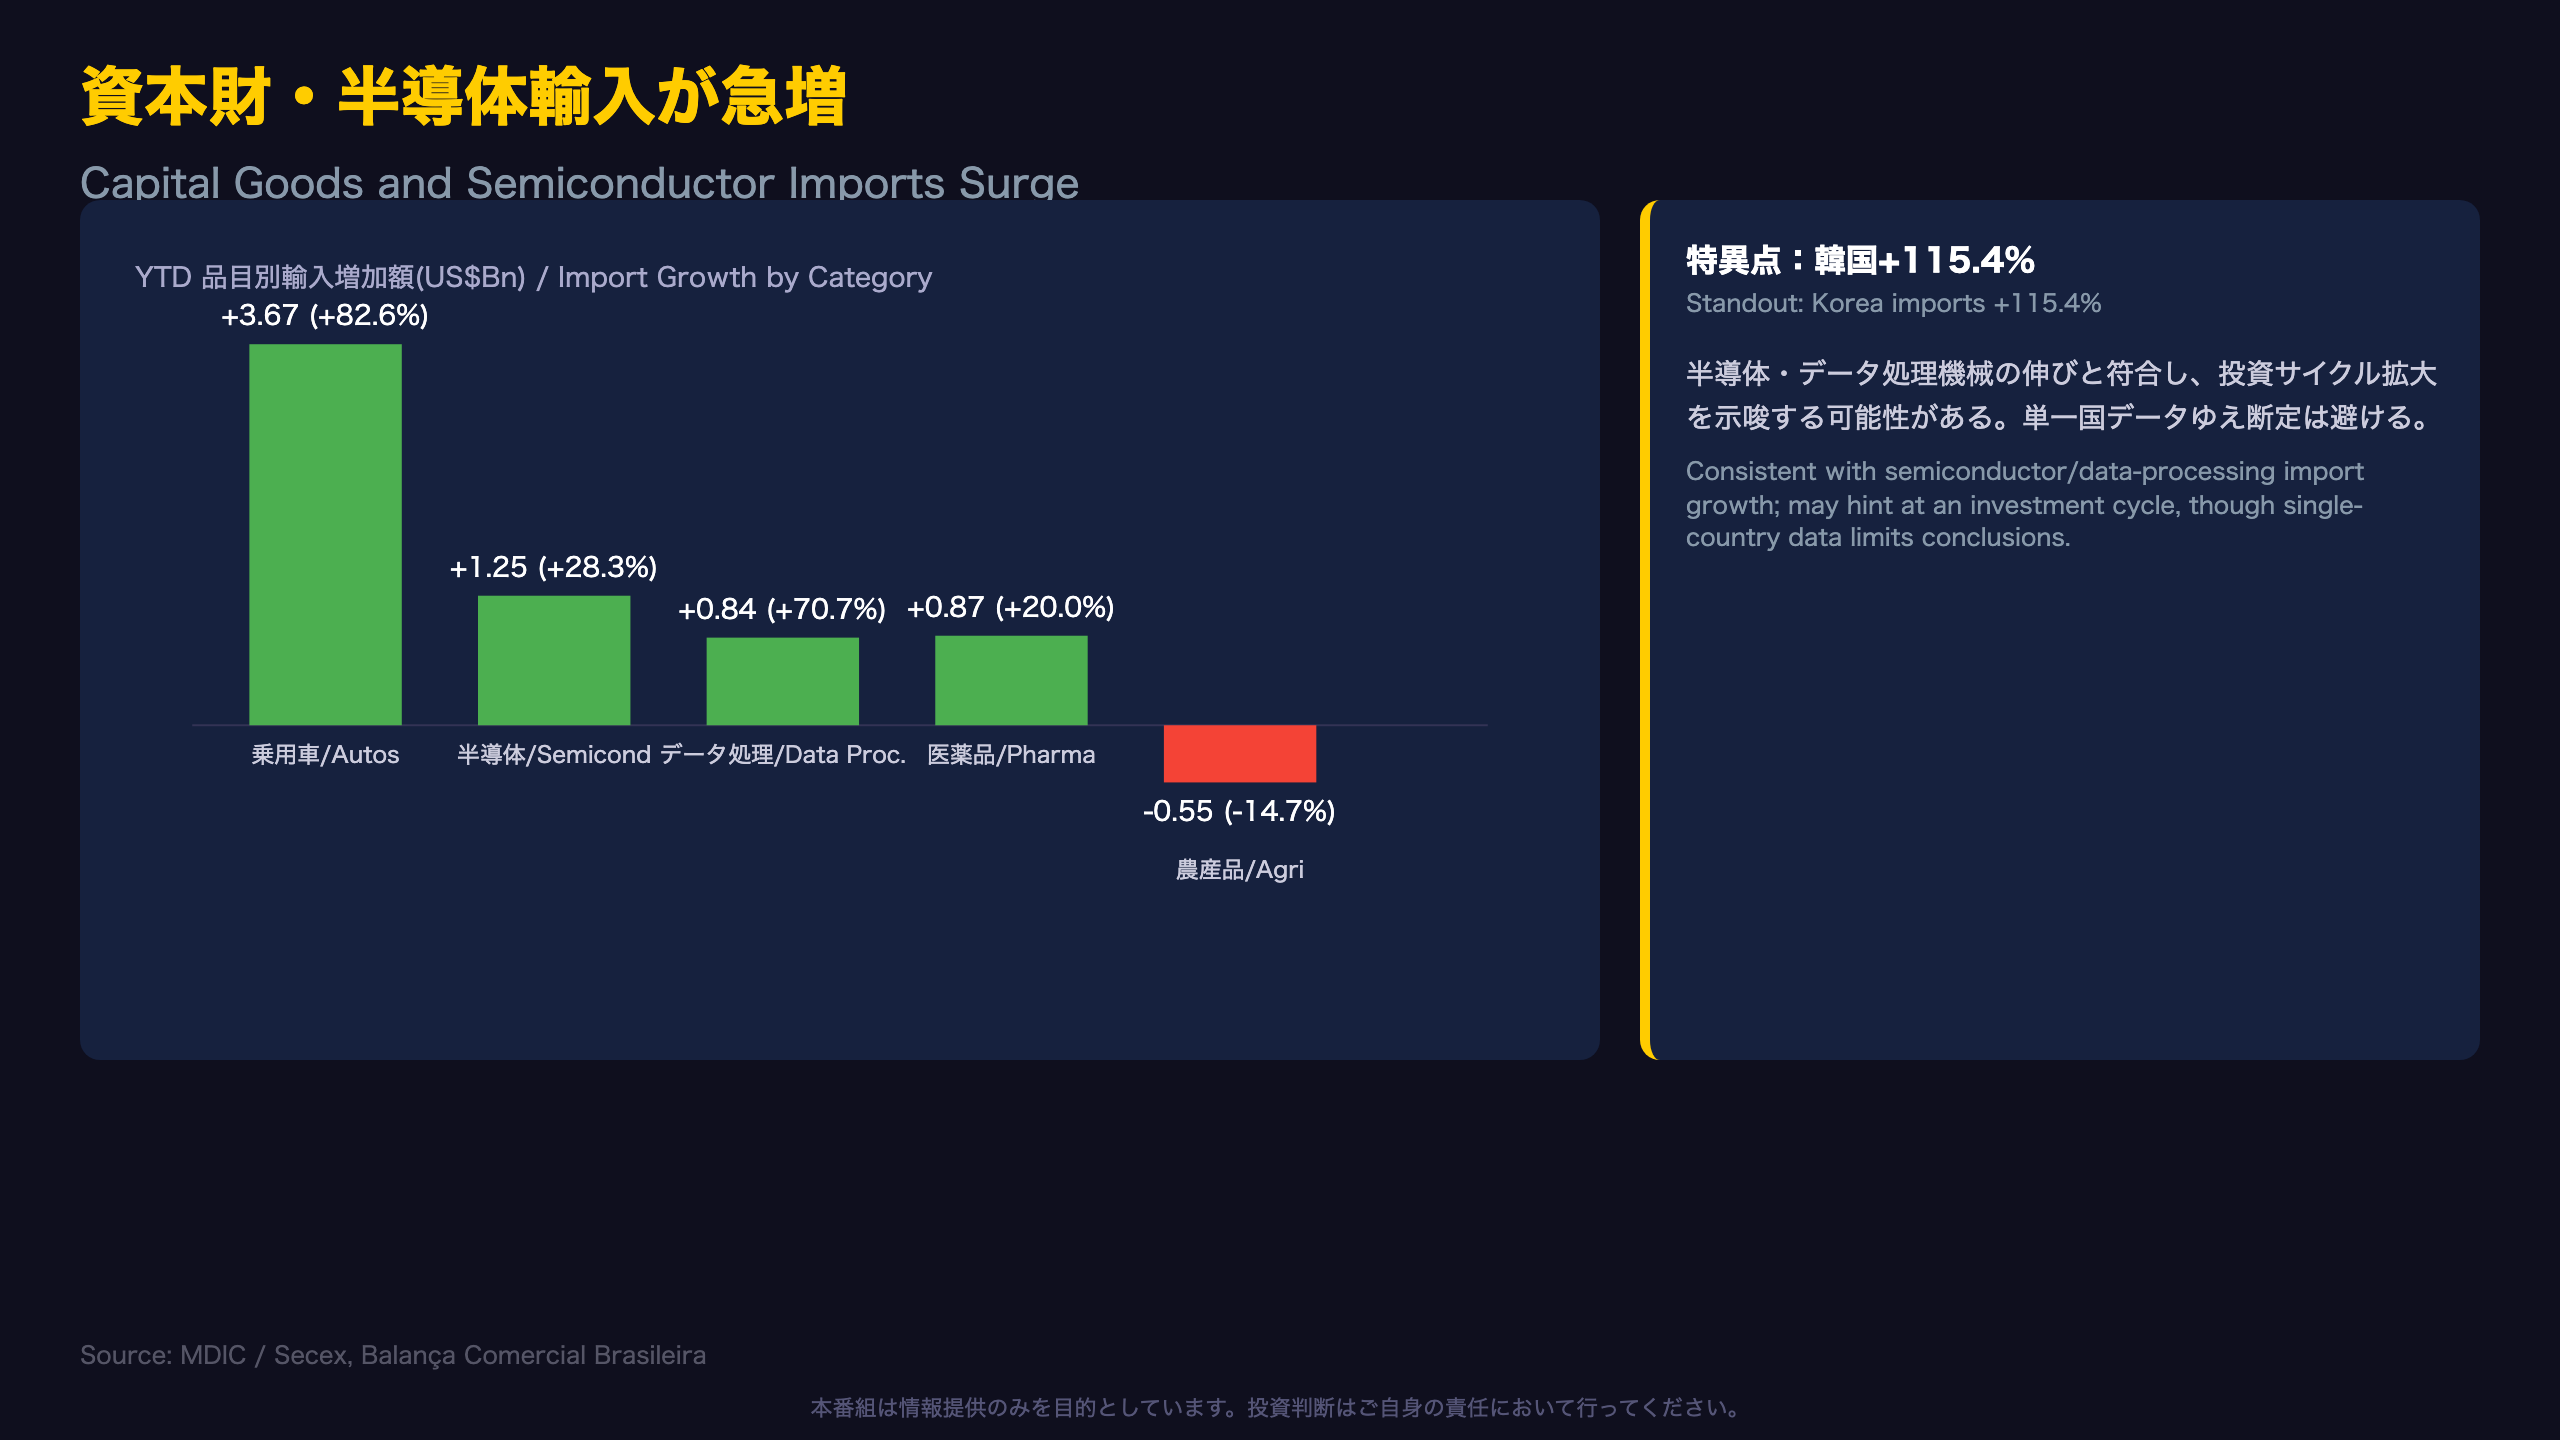
Imports from South Korea rose an extraordinary 115.4% year-to-date (+$3.6 billion), the largest percentage jump among Brazil’s major partners. This aligns with the surge in semiconductor components (+28.3% YTD) and data processing machines (+70.7% YTD), potentially reflecting data center buildouts or electronics demand. However, this is a single-country observation and should not yet be read as a structural investment cycle shift.
The 82.6% jump in passenger vehicle imports
The report doesn’t break vehicle imports down by country, but total imports from Asia rising 12.92% YTD is broadly consistent with reports of Asian automakers expanding into Brazil. This remains circumstantial rather than confirmed here.
A counter-trend: shrinking agricultural imports
While overall imports rose, agricultural imports fell 14.7% (-$550 million) — a notable counter-trend possibly reflecting domestic substitution, though a single sector’s decline isn’t sufficient to confirm a structural pattern.
Forward look
Whether the capital-goods import boom is durable or a one-off procurement wave will become clearer as Asia’s import share trends are tracked over coming months.
アジア向け輸出が急伸、対米貿易は双方向で縮小
Why US-Brazil Trade Is Shrinking on Both Sides
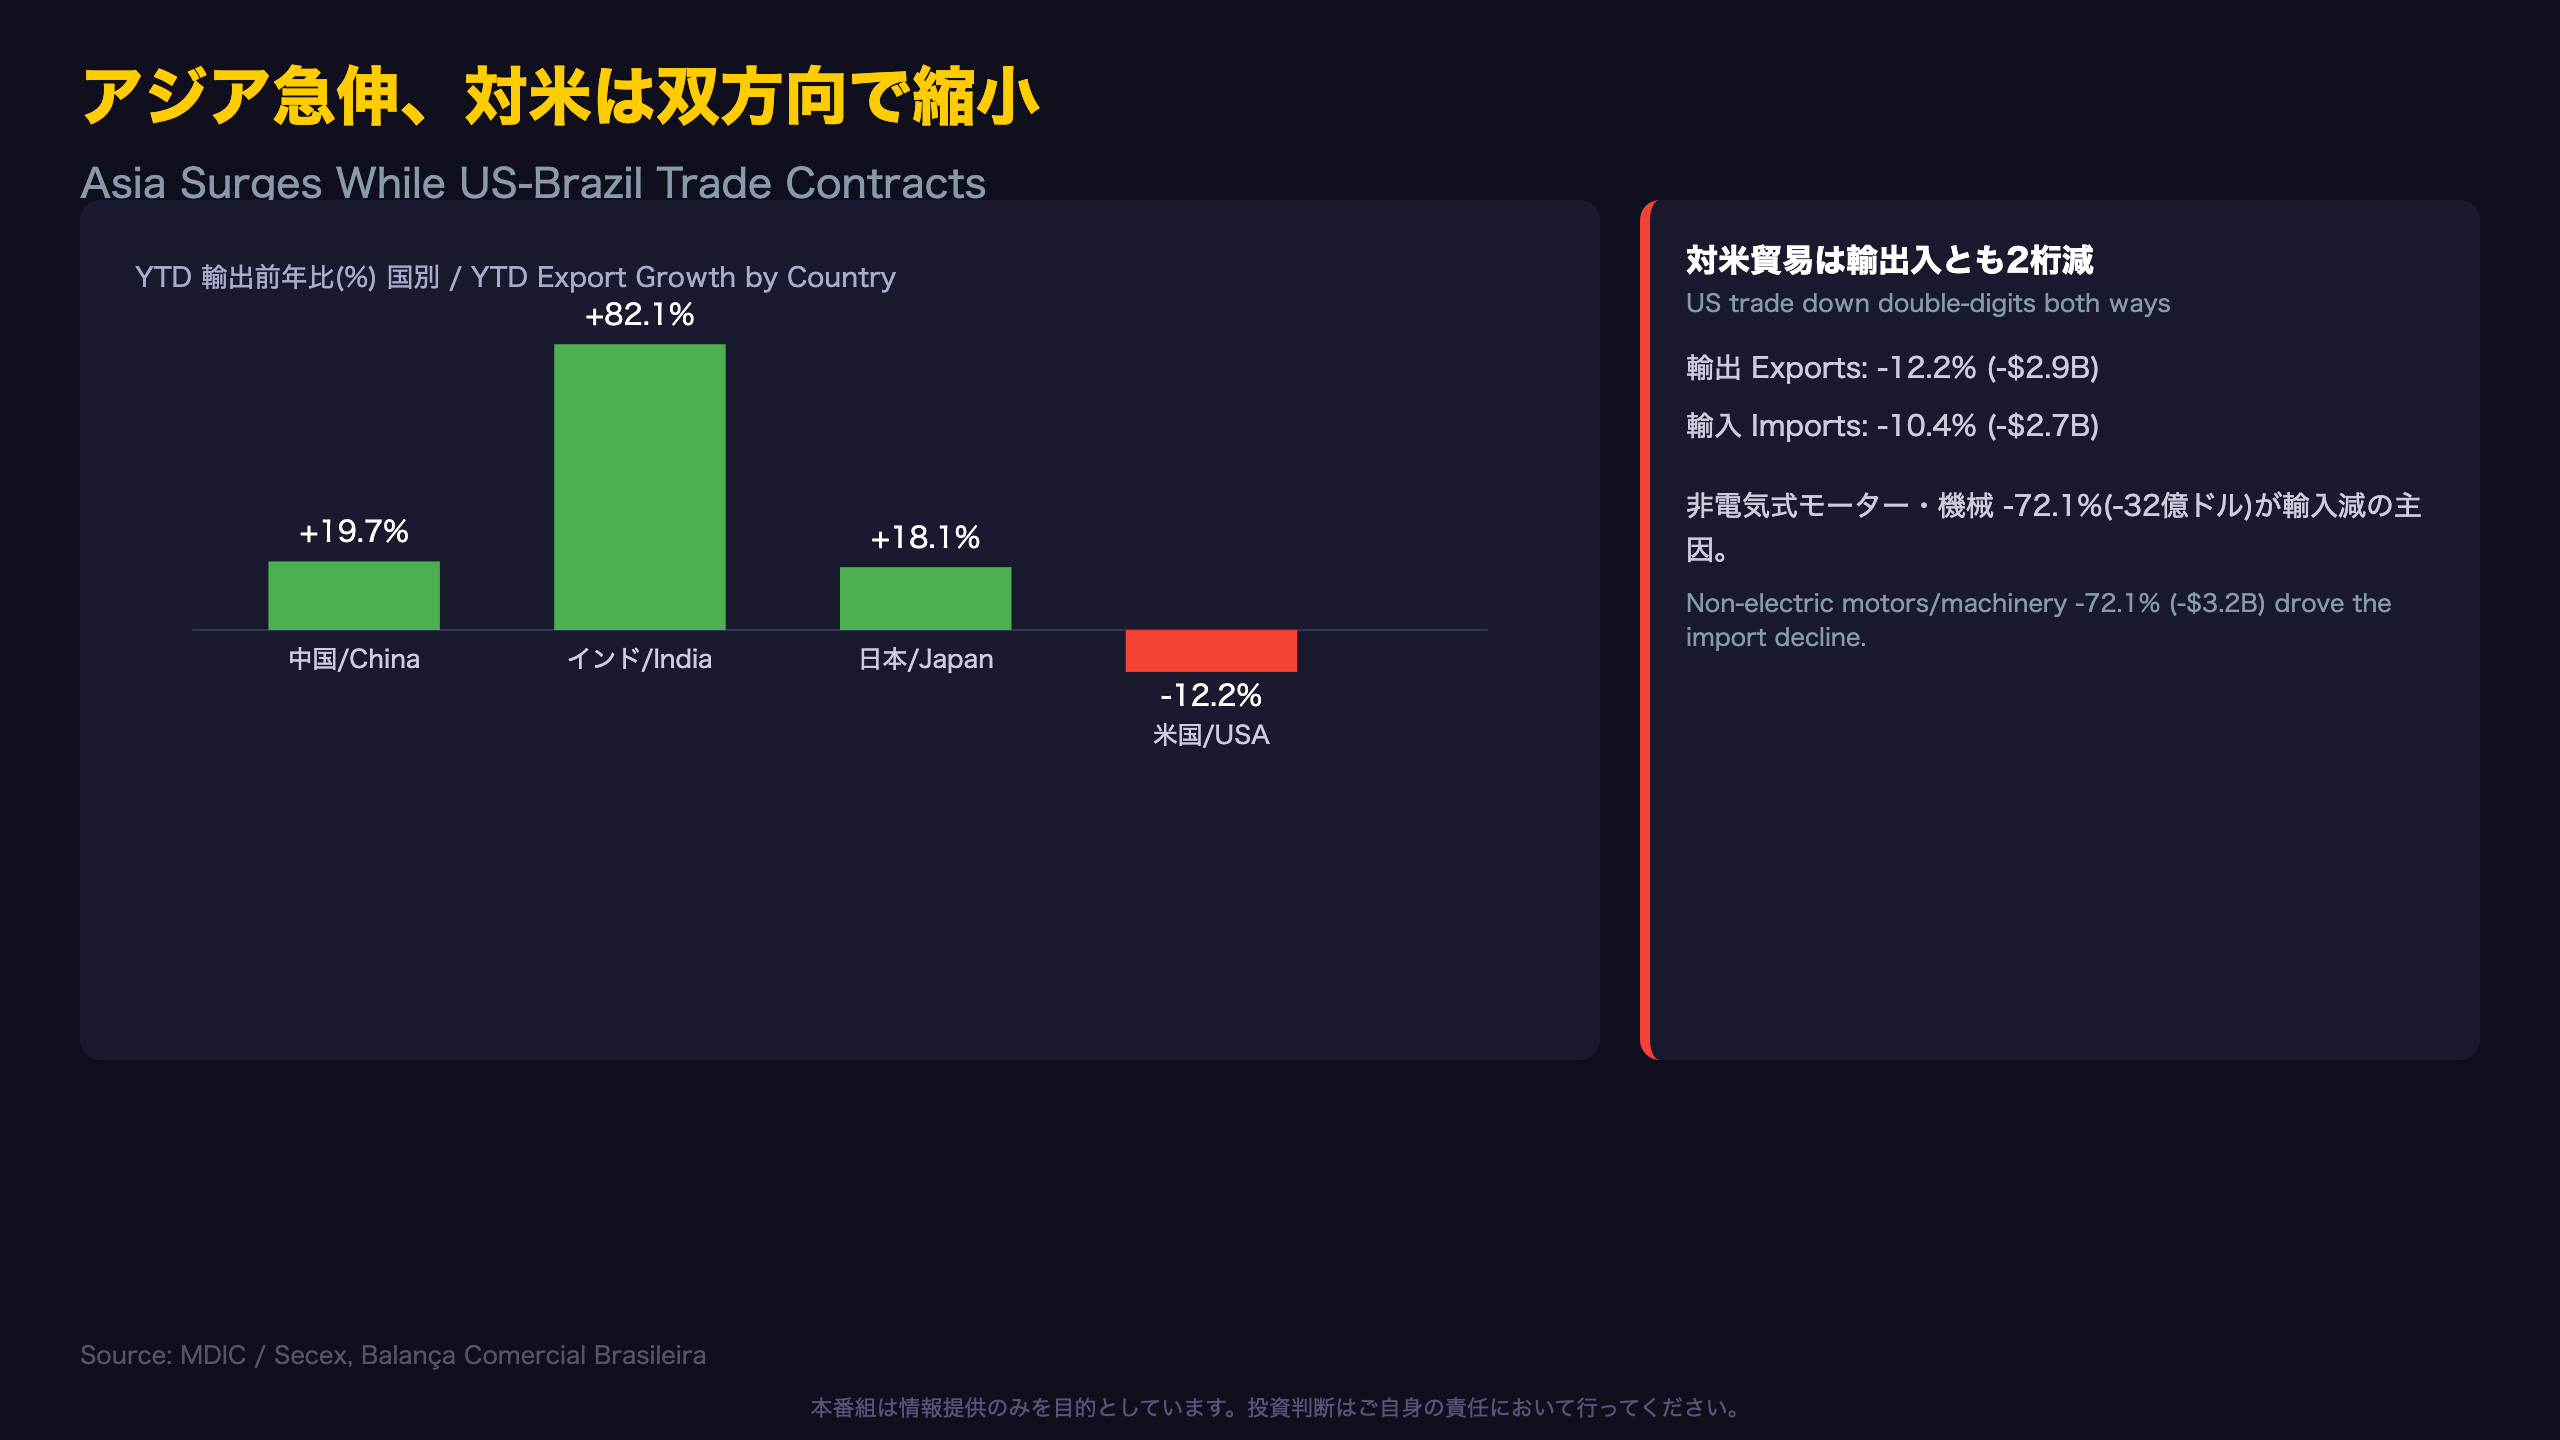
Exports to the United States fell 12.2% year-to-date (-$2.9 billion), driven by steep declines in aircraft and parts (-72.3% in July alone, -$400 million), green coffee (-31.0%), and alumina (-29.9%). Imports from the U.S. also fell 10.4% (-$2.7 billion), with non-electric motors and machinery plunging 72.1% (-$3.2 billion) — one of the largest single-category swings in the entire report. The report itself doesn’t specify a cause, but tariff actions or trade friction are plausible factors, though unconfirmed by the data alone.
Asia’s broadening demand base
While China remains Brazil’s largest partner, accelerating exports to India (+82.1%), Singapore (+25.0%), and Japan (+18.1%) show demand diversifying across Asia, partially reducing China concentration risk.
Relevance for Japanese investors
Exports to Japan rose 18.1% YTD (+$500 million) and accelerated to 44.7% in July alone (+$200 million). The report doesn’t detail the specific product mix, but this is consistent with broader strength in Brazilian resource and agricultural exports.
A geopolitical lens
Whether the US-Brazil trade contraction reflects a temporary dip or a structural “de-risking” trend will become clearer with more data.
為替・市場へのインプリケーション
Structuring the Evidence Chain
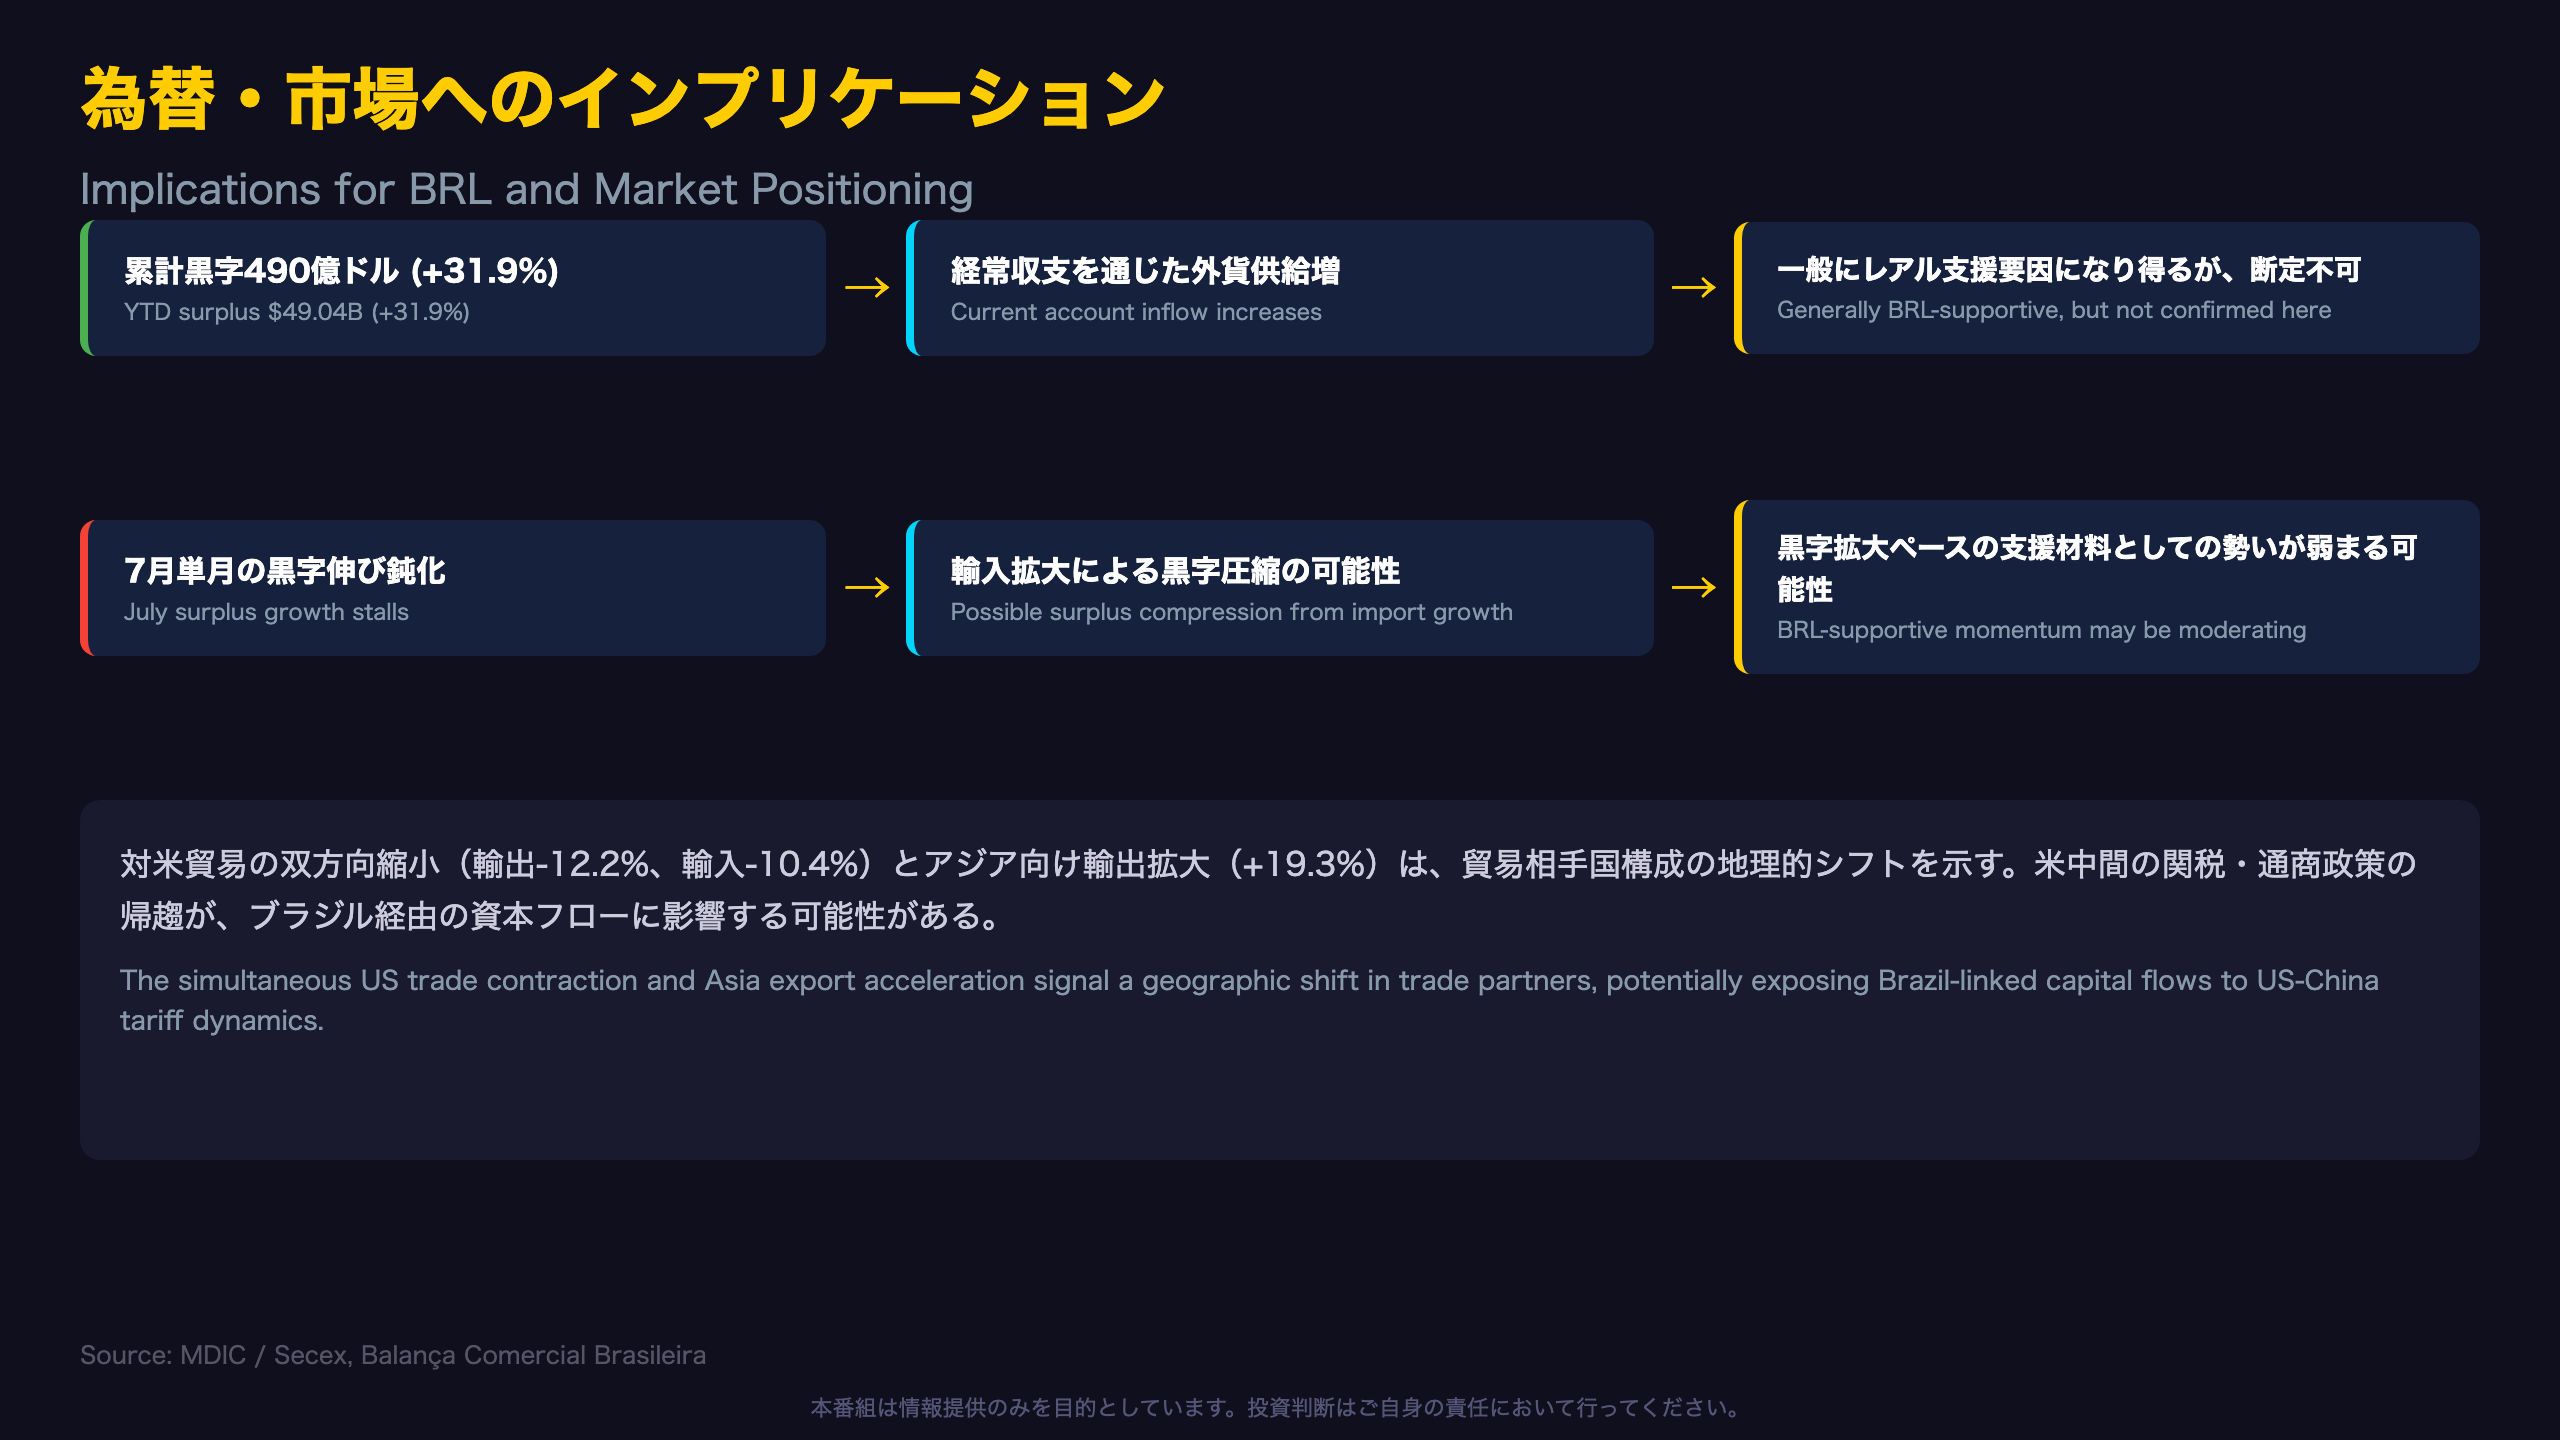
A widening trade surplus is generally understood to support a currency through the current account channel. The January-July cumulative surplus of $49.04 billion, up 31.9% year-on-year, provides a potentially favorable data point for BRL. However, this is a general macroeconomic mechanism, not a guaranteed outcome — capital account flows, interest rate differentials, and global risk appetite can all outweigh trade balance effects on actual currency movements.
A short-term inflection point
The near-flat year-on-year surplus in July alone suggests the pace of trade balance improvement may be decelerating. Whether this reflects a seasonal pattern or a structural shift tied to domestic demand recovery will only become clear with more data.
A geopolitical reshuffling of trade flows
The simultaneous contraction in U.S.-Brazil trade (exports -12.2%, imports -10.4%) alongside accelerating exports to Asia (+19.3%) signals a changing composition of Brazil’s trading partners. This means U.S.-China tariff policy could increasingly influence capital flows through Brazil and commodity pricing.
What investors should watch
This report alone cannot predict the direction of USD/BRL. The next data point to watch is August’s release, alongside developments in U.S. trade policy toward Brazil.
Disclaimer: This article is for informational purposes only. All investment decisions are made solely at your own risk.