📺 Watch the Full Video Analysis
This article was automatically generated by the NFC Market Live AI analysis system. (Updated: 2026-07-28 02:48 JST)
📄 Primary Source
Banco Central do Brasil
https://www.bcb.gov.br/content/focus/focusmarketreadout/R20260724.pdf
Deep dive into Banco Central do Brasil’s weekly Focus Market Readout, a survey of 130+ market participants that BCB itself uses as policy input.
📊 Selic rate year-end forecasts frozen across all four horizons (2026-2029), with the 2029 figure unchanged for 12 straight weeks.
📉 2026 IPCA forecast fell to 5.12% for a 4th consecutive week; August’s monthly forecast turned negative at -0.14%.
⚠️ 2027 GDP growth was downgraded to 1.60% for a 3rd straight week.
💰 BRL/JPY carry trade analysis: Selic 14.00% vs BOJ 0.84% — a 13+ point rate gap.
We balance the resilience story against the quiet growth downgrade.
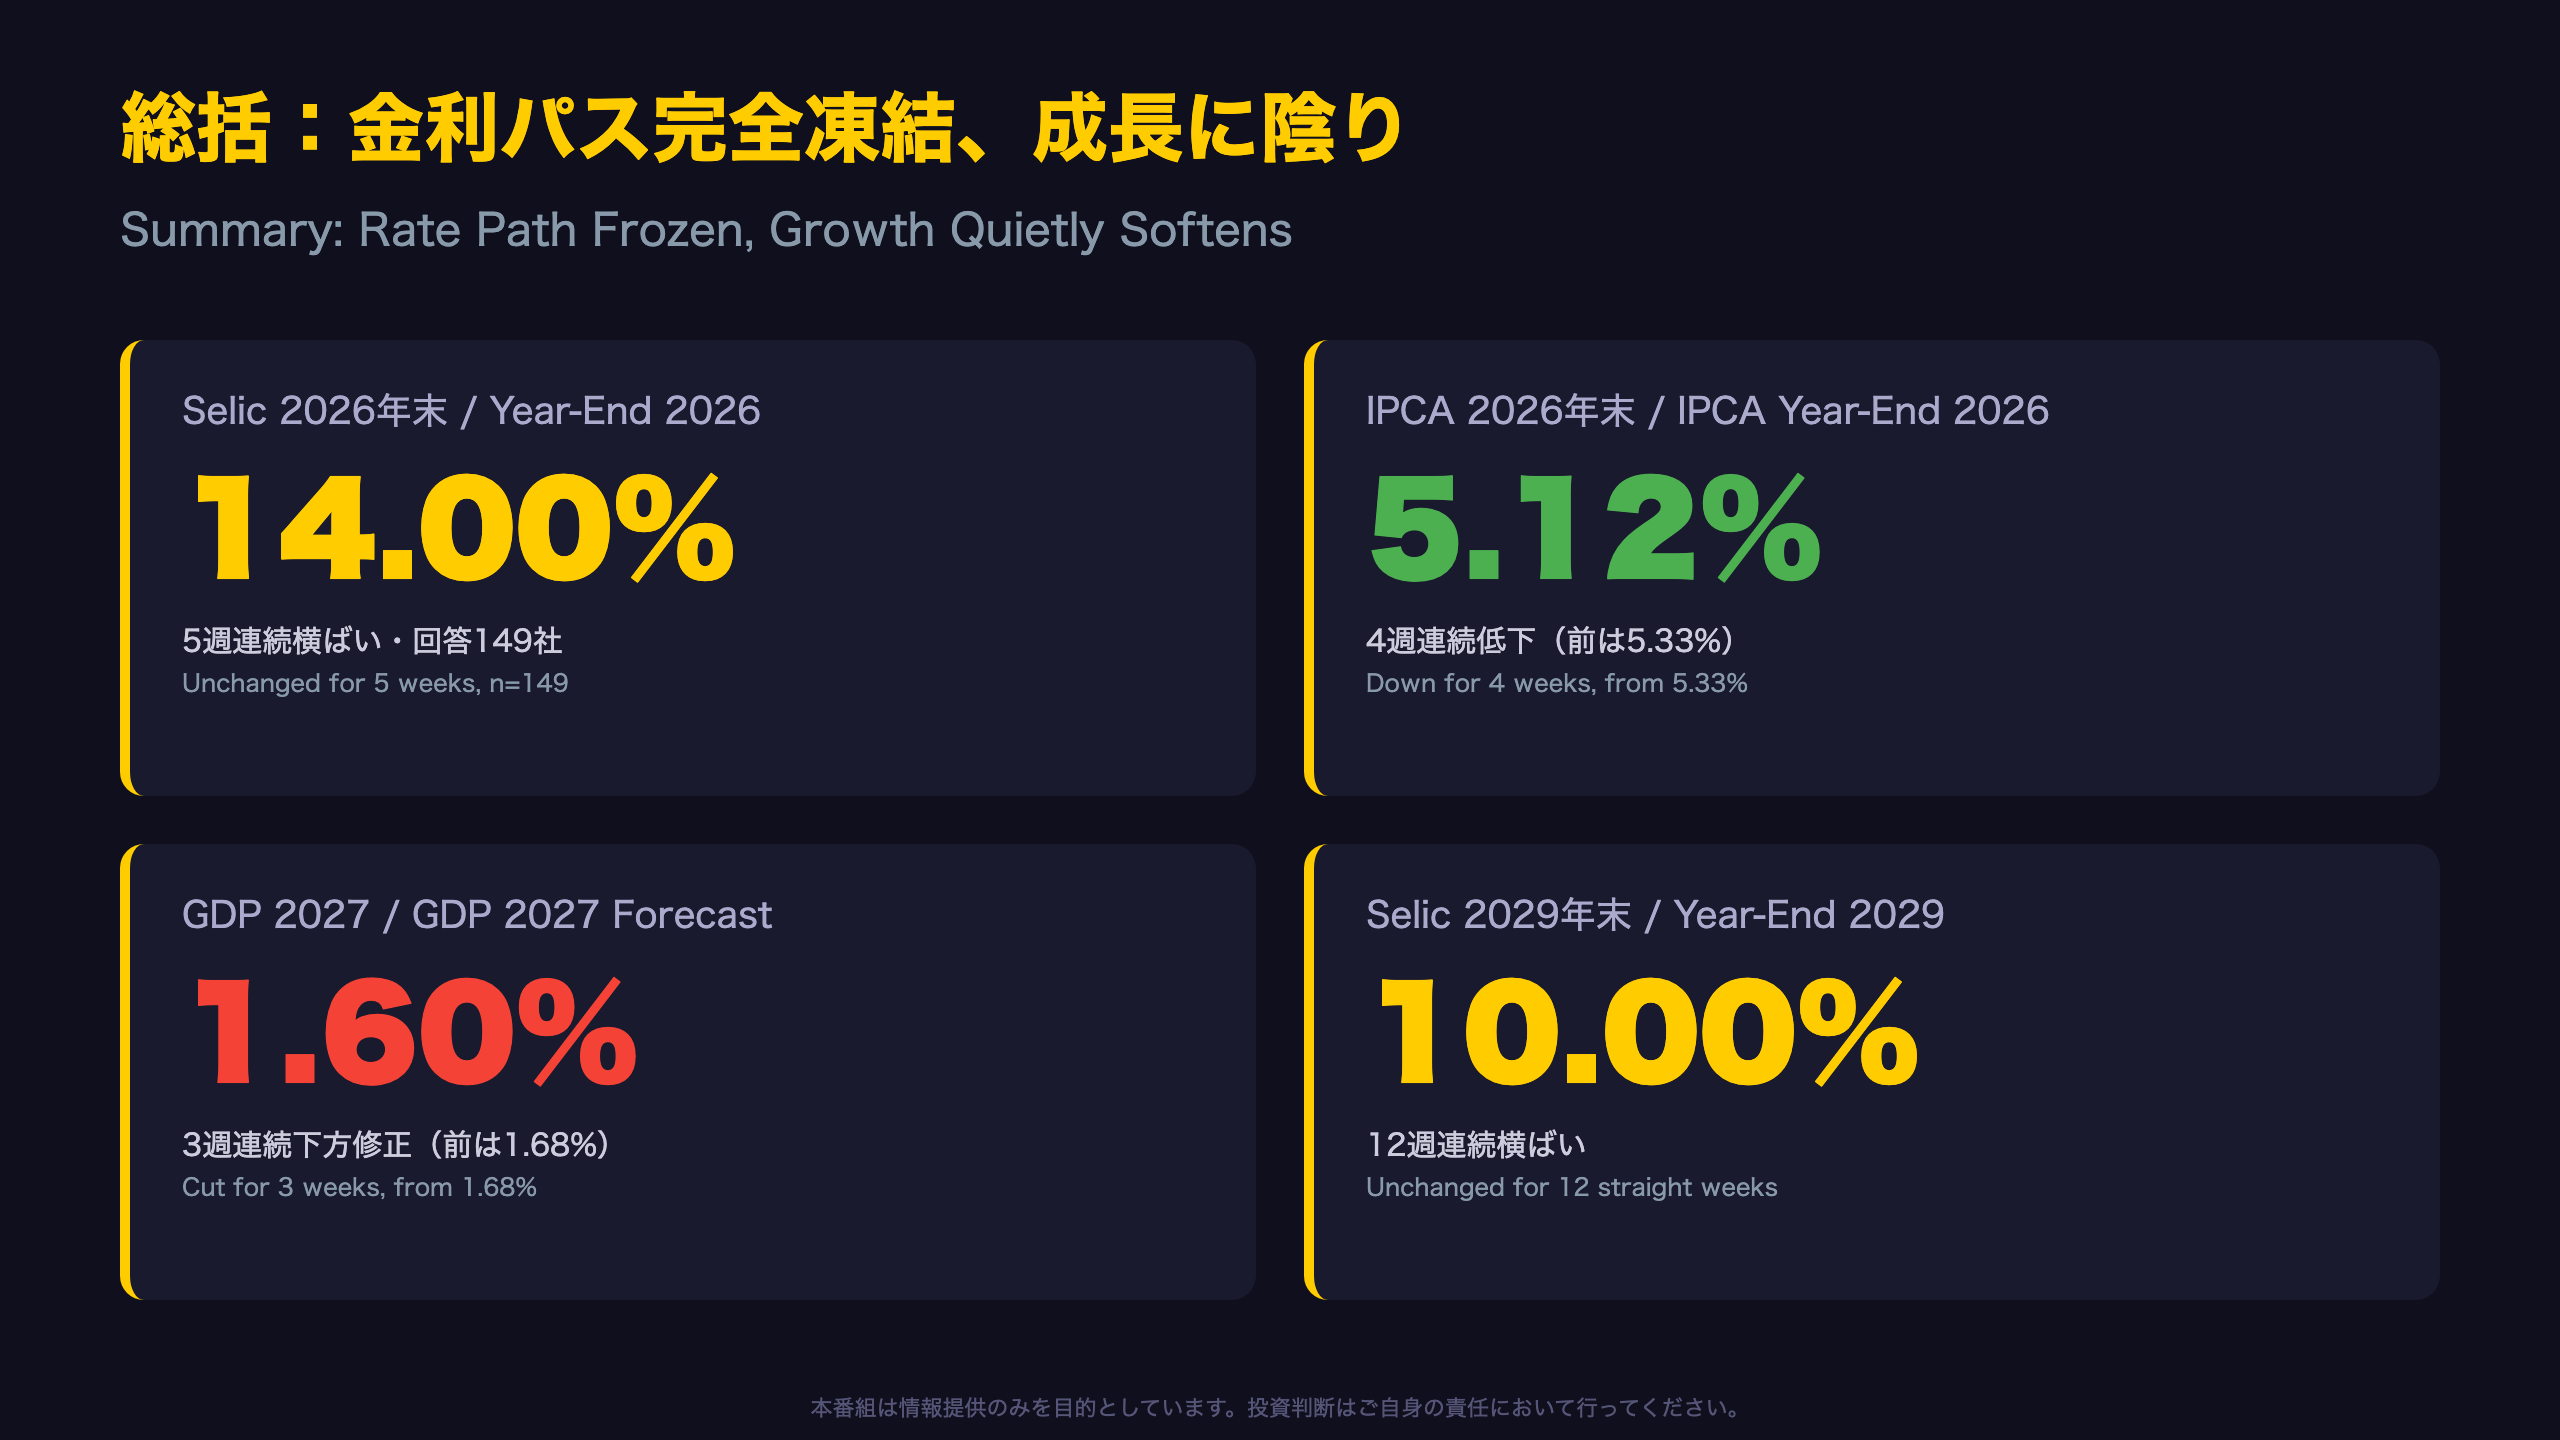
総括:金利パス完全凍結、成長には静かな陰り
Why This Week’s Snapshot Matters
Brazil’s Focus Market Readout is not just a private-sector average — it is the official survey compilation that Banco Central do Brasil’s Monetary Policy Committee (COPOM) itself references when setting the Selic target rate. That makes today’s data a window into how the central bank likely reads the market’s mood.
Key Numbers
- Selic year-end 2026: 14.00% (unchanged for 5 straight weeks, n=149)
- Selic year-end 2029: 10.00% (unchanged for 12 straight weeks)
- IPCA year-end 2026: 5.12% (down for a 4th straight week, from 5.33% four weeks ago)
- GDP 2027: 1.60% (cut for a 3rd straight week, from 1.68%)
The report explicitly tracks “trend since the previous Focus Market Readout,” with the number of consecutive weeks in parentheses — arguably the single best gauge of how entrenched market consensus really is.
Balancing the Narrative
On the resilience side, the multi-week stability of Selic forecasts across four separate year-end horizons suggests strong market confidence in BCB’s policy credibility — a rare feat for an emerging-market central bank. On the caution side, the persistent three-week downgrade in 2027 GDP is a consistent, not one-off, signal of fading growth momentum.
Looking Ahead
The next Focus Market Readout is due July 31, 2026. Watch whether the monthly IPCA forecast reversal (from -0.14% in August to +0.50% in September) actually materializes — that would be the key test of whether disinflation is broad-based or seasonal.
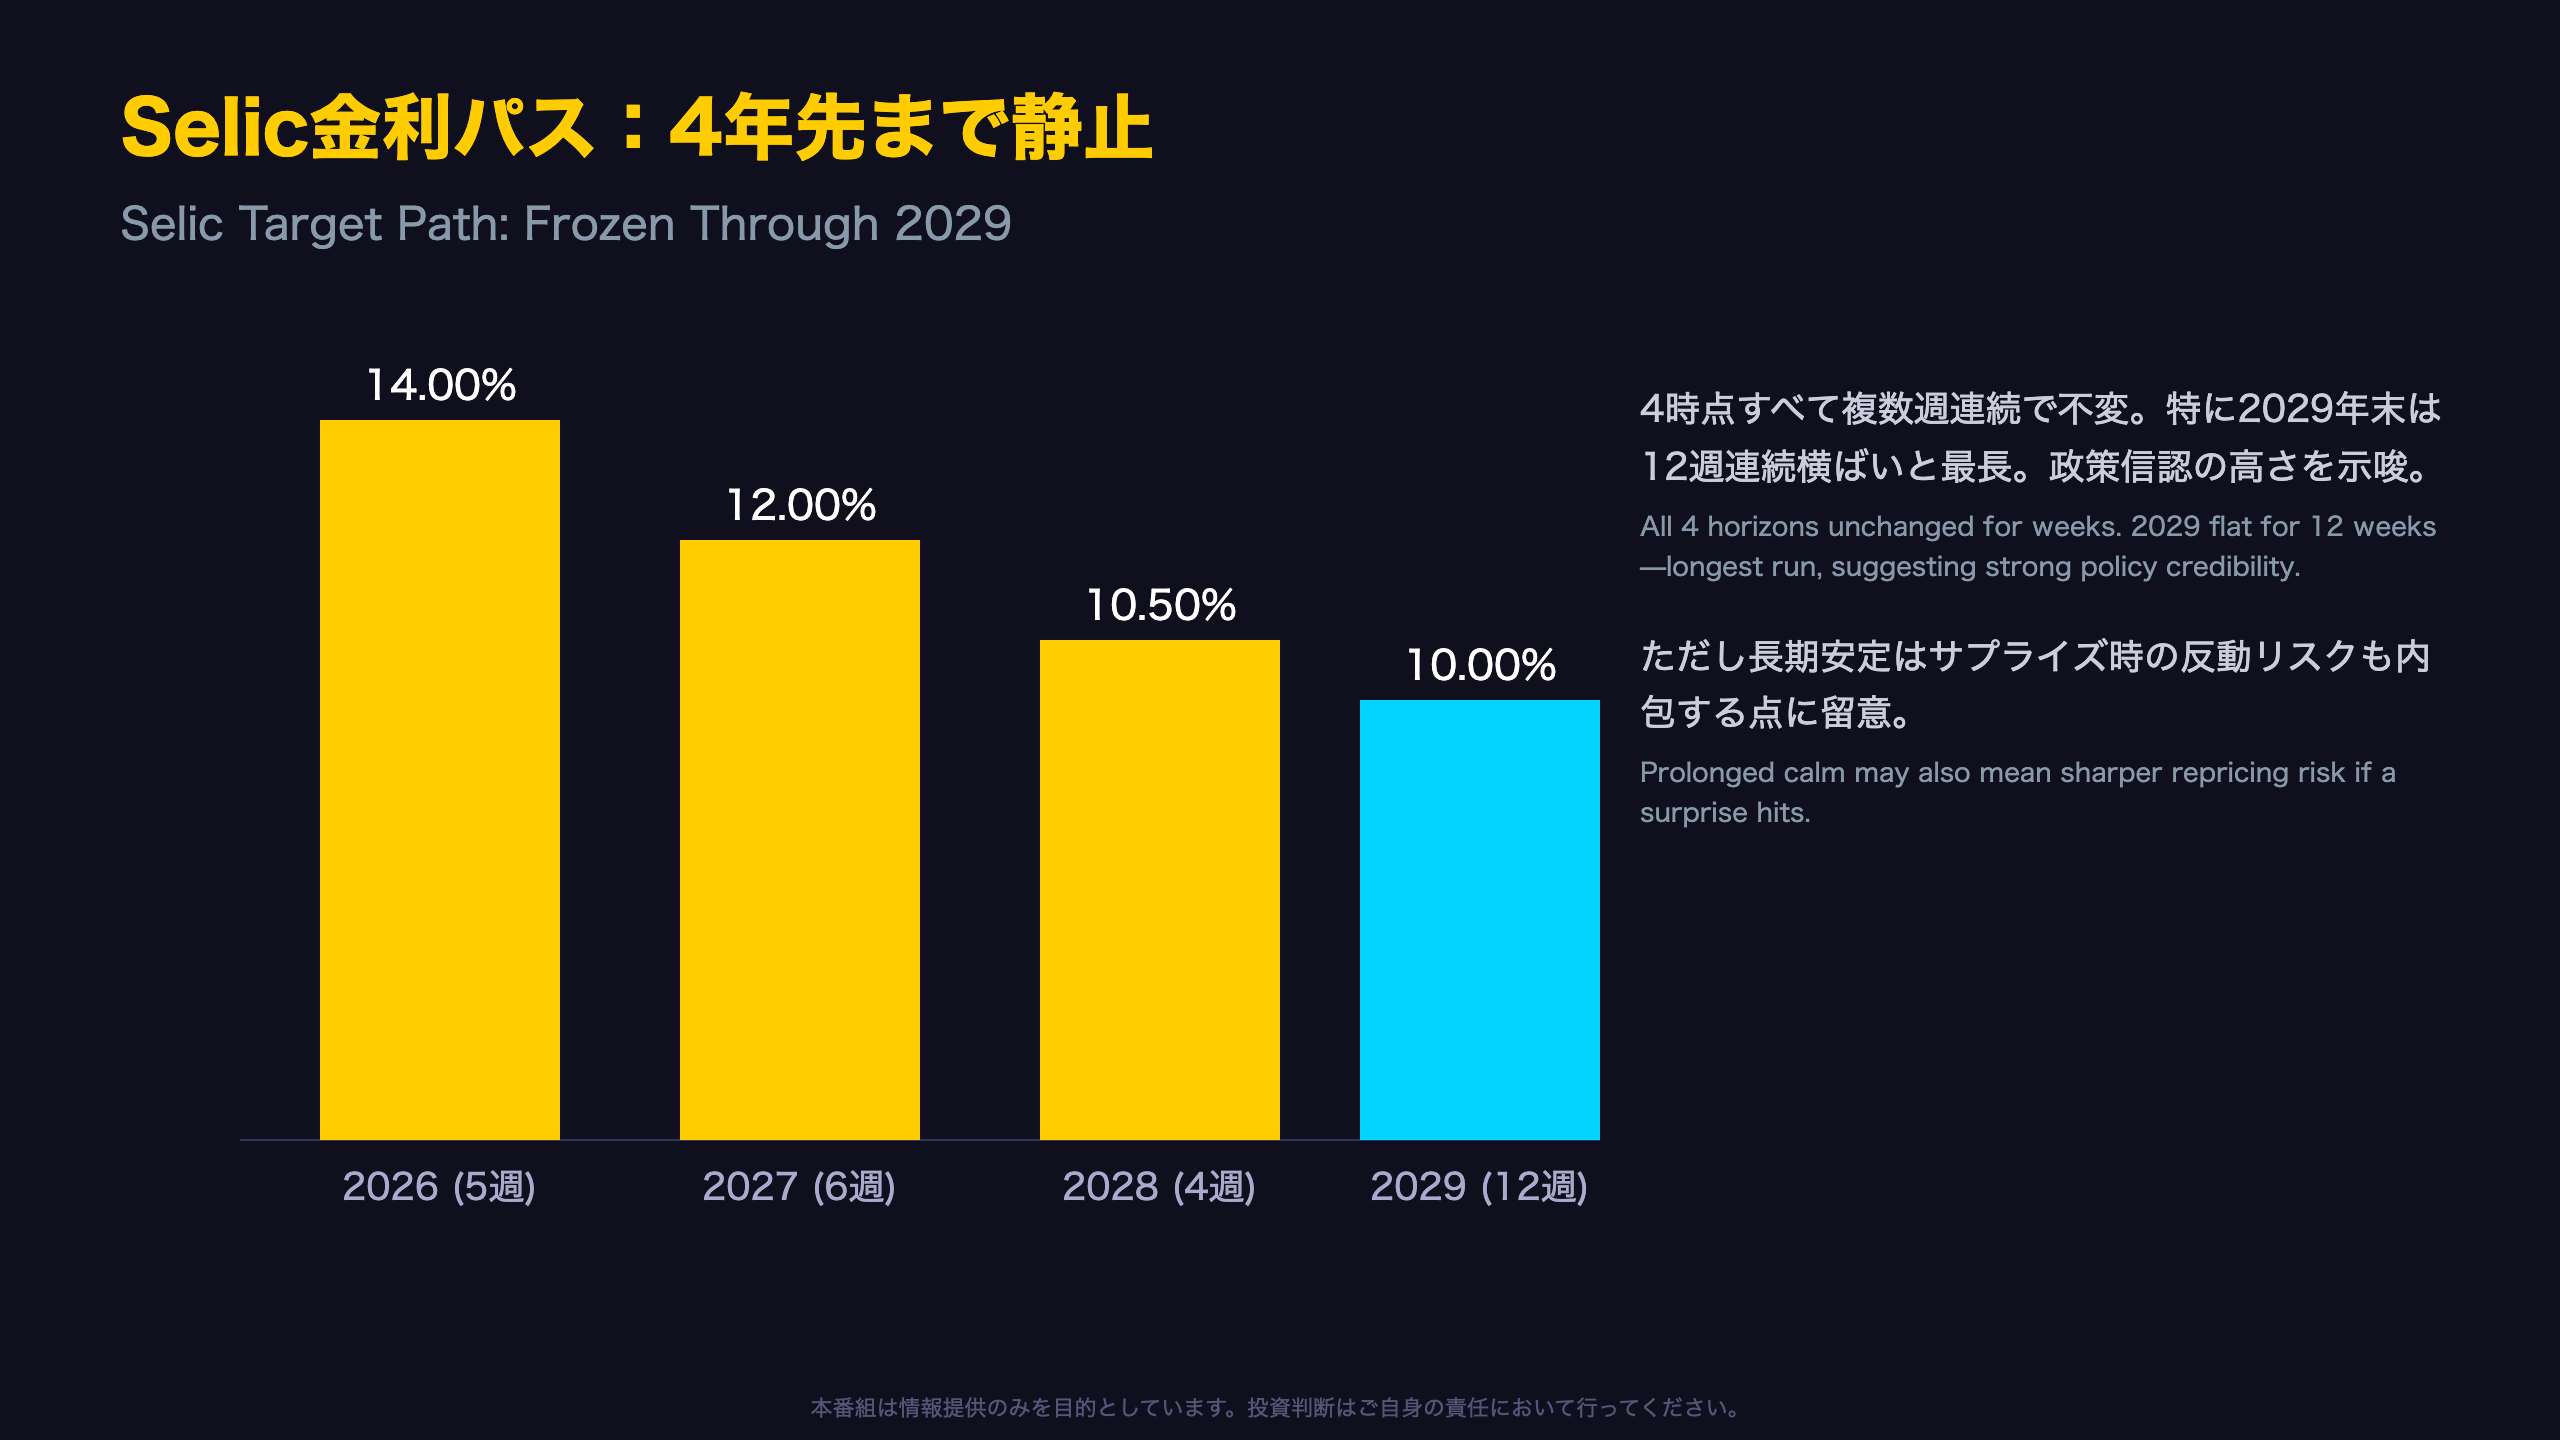
Selic金利パス:4年先まで完全に静止
Reading the Selic “Freeze” in Numbers
| Year-End | Forecast | Weeks Unchanged | Respondents (30d) |
|---|---|---|---|
| 2026 | 14.00% | 5 | 149 |
| 2027 | 12.00% | 6 | 144 |
| 2028 | 10.50% | 4 | 122 |
| 2029 | 10.00% | 12 | 112 |
Across the four horizons, the market is pricing in over 400 basis points of cumulative easing through 2029 — yet none of these levels have budged in recent weeks. Because this is a multi-week pattern rather than a single data point, a Level-B “suggests” framing is appropriate here, not a definitive claim.
Why So Sticky?
Even the narrower sample of respondents from just the last five business days (91-112 firms) produces medians identical to the 4-week-ago and 1-week-ago figures. That convergence across both new and existing respondents suggests this stability is not an artifact of survey turnover — it appears to be genuine consensus.
The Flip Side
However, one could argue that such prolonged multi-horizon stability builds up latent repricing risk: if COPOM’s next meeting or an inflation print surprises, the unwind could be sharper precisely because expectations have been so anchored for so long. Stability should not be conflated with the absence of risk.
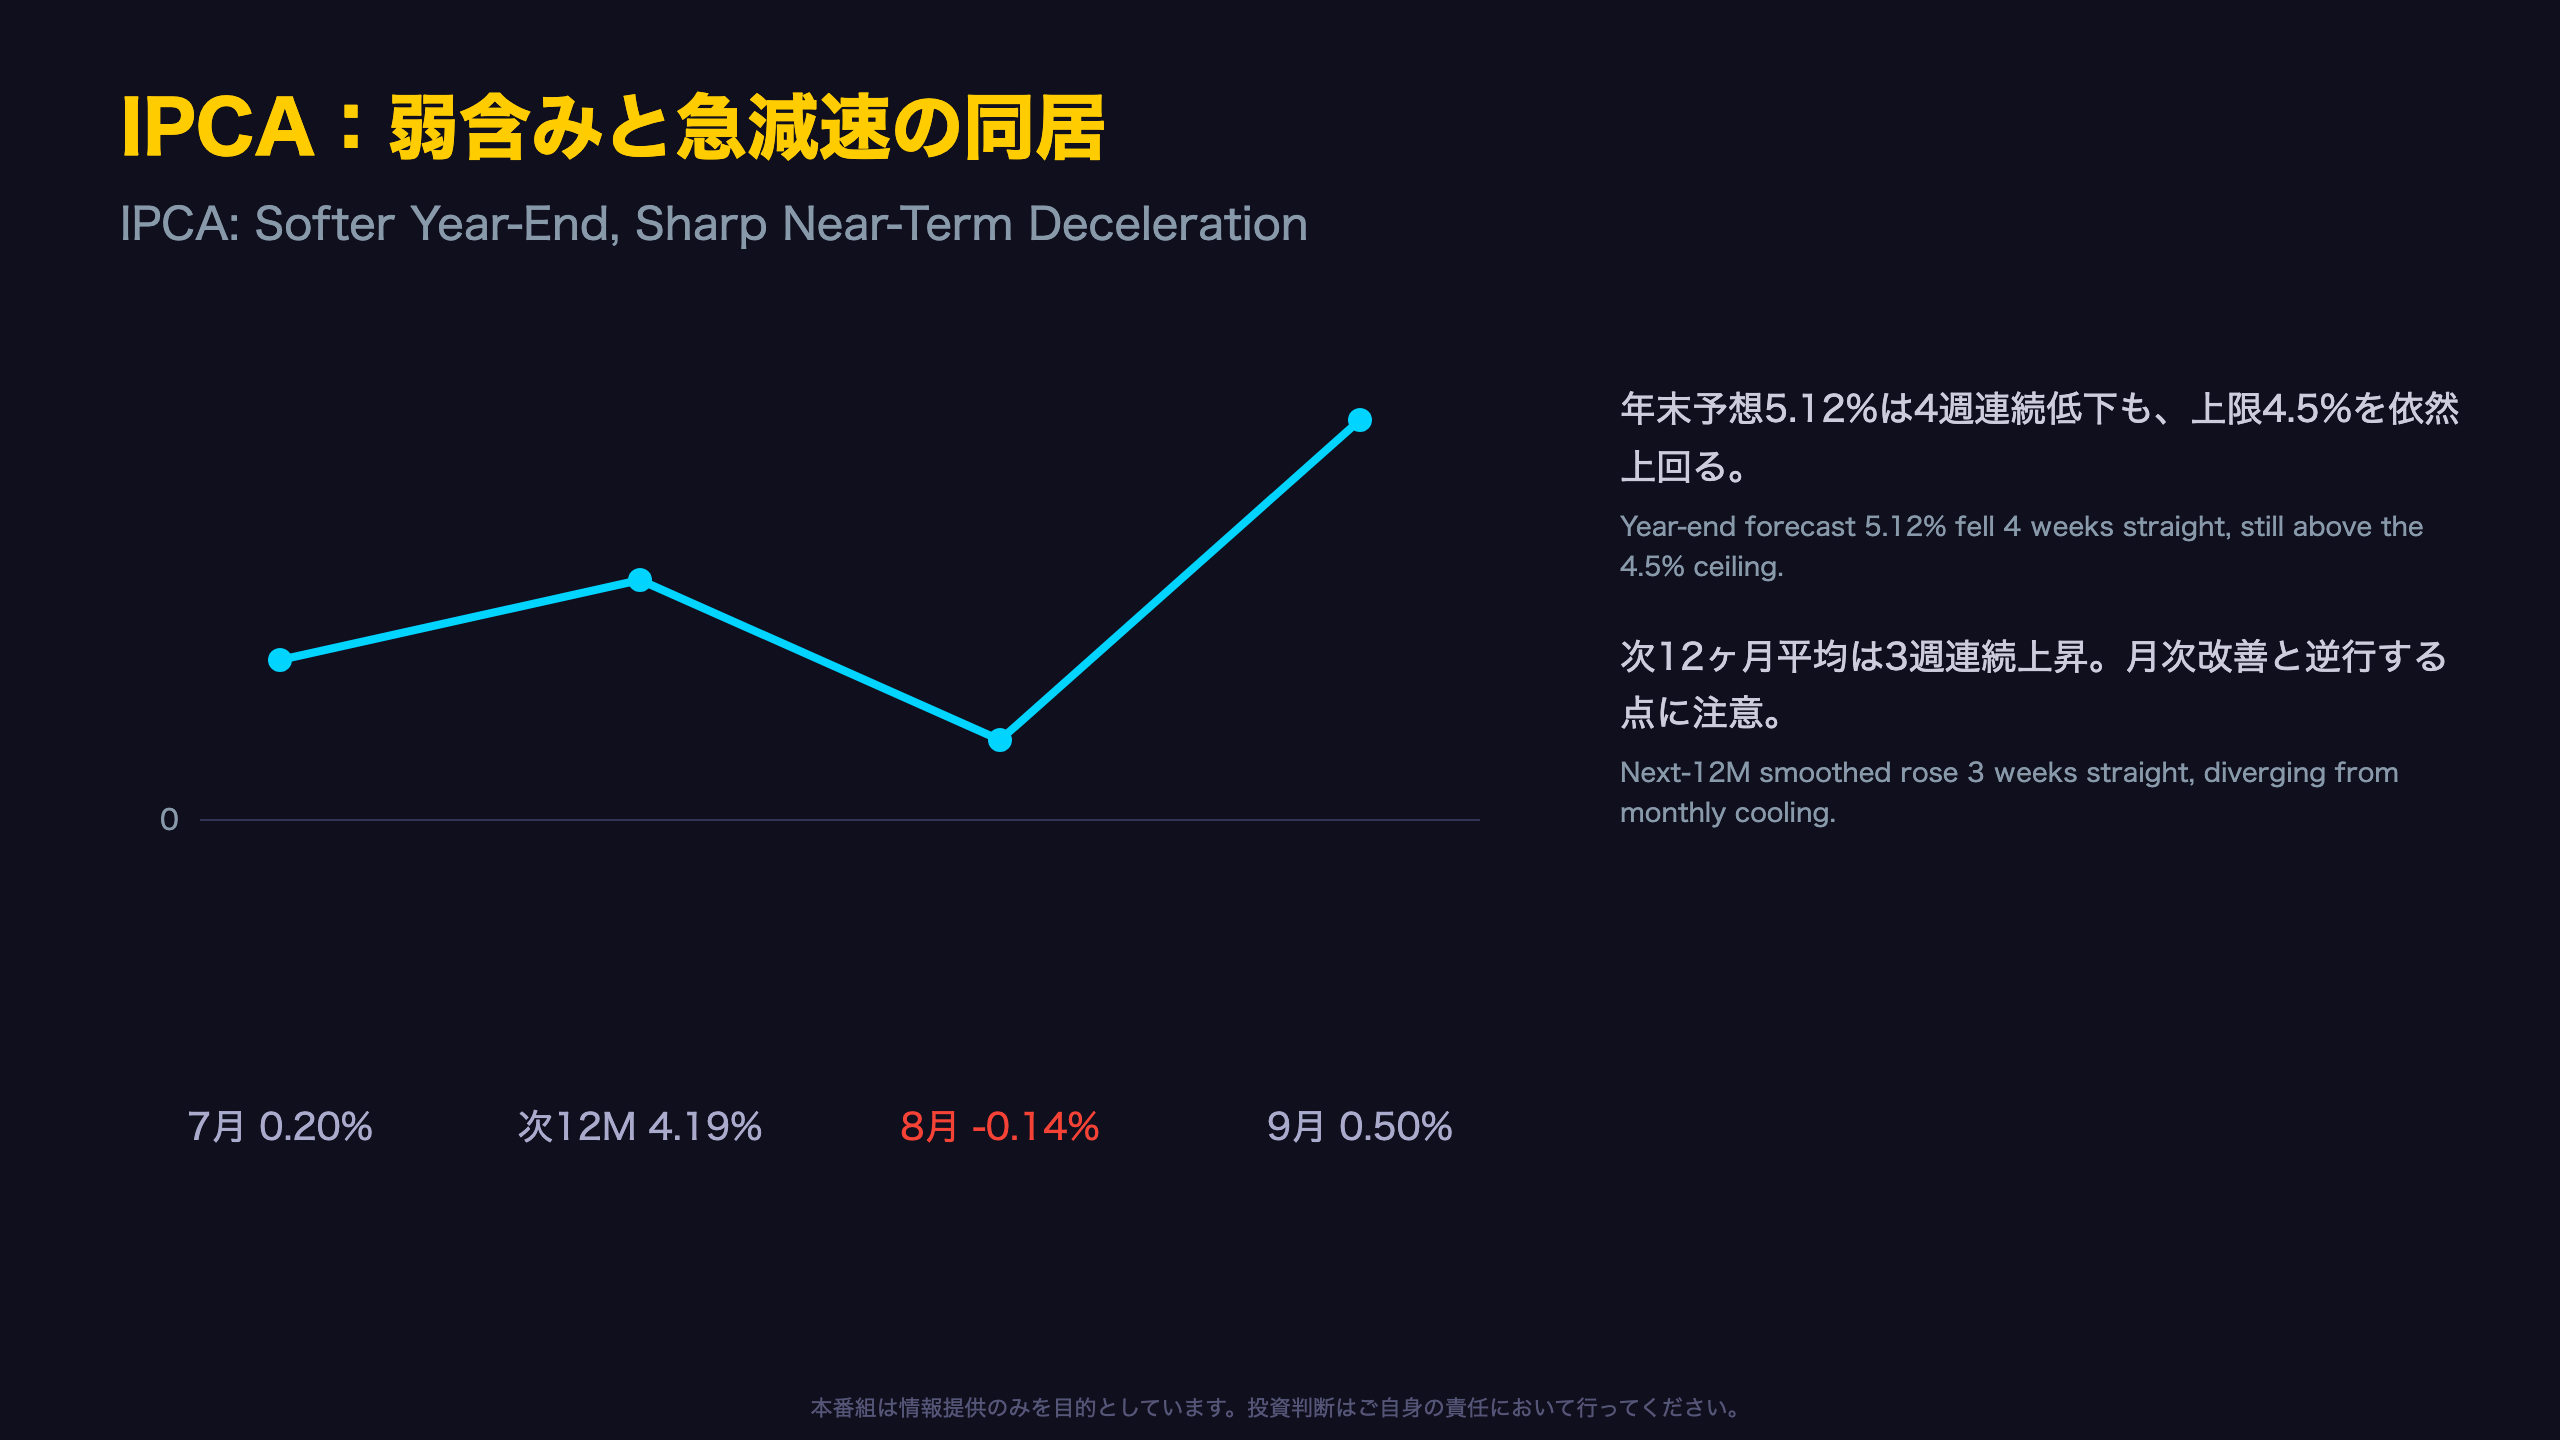
IPCA:年末の弱含みと目先の急減速
Unpacking IPCA’s Two Faces
Year-End Basis (Level A: explicitly stated)
- 2026: 5.12% (down from 5.33% four weeks ago, down for a 4th straight week)
- 2027: 4.22% (up from 4.17%, rising for a 1st week)
- 2028: 3.80% (rising for 2 weeks)
- 2029: 3.50% (unchanged for 47 straight weeks)
BCB’s inflation target is 3.0%, with a tolerance band of 1.5%-4.5%. The 2026 year-end forecast of 5.12% remains above the 4.5% ceiling — the target is not yet within reach.
Monthly Basis (Level A)
- July: 0.20% (down from 0.26% last week)
- August: -0.14% (negative territory, part of a 7-week downtrend)
- September: 0.50% (rising for a 10th straight week)
The shift to negative territory in August’s monthly forecast could partly reflect seasonal regulated-price adjustments or one-off factors (Level C caveat) — a single month’s data cannot confirm a structural disinflation trend on its own.
The Overlooked Metric: Next-12-Month Smoothed
The smoothed next-12-month forecast has actually risen to 4.19% for a third straight week — moving in the opposite direction of the near-term monthly improvement. This divergence suggests the market may be treating August’s negative print as transitory while remaining wary of renewed inflation pressure over a full-year horizon — an important nuance often missed when headlines focus only on the year-end figure.
GDP2027:3週連続下方修正の重み
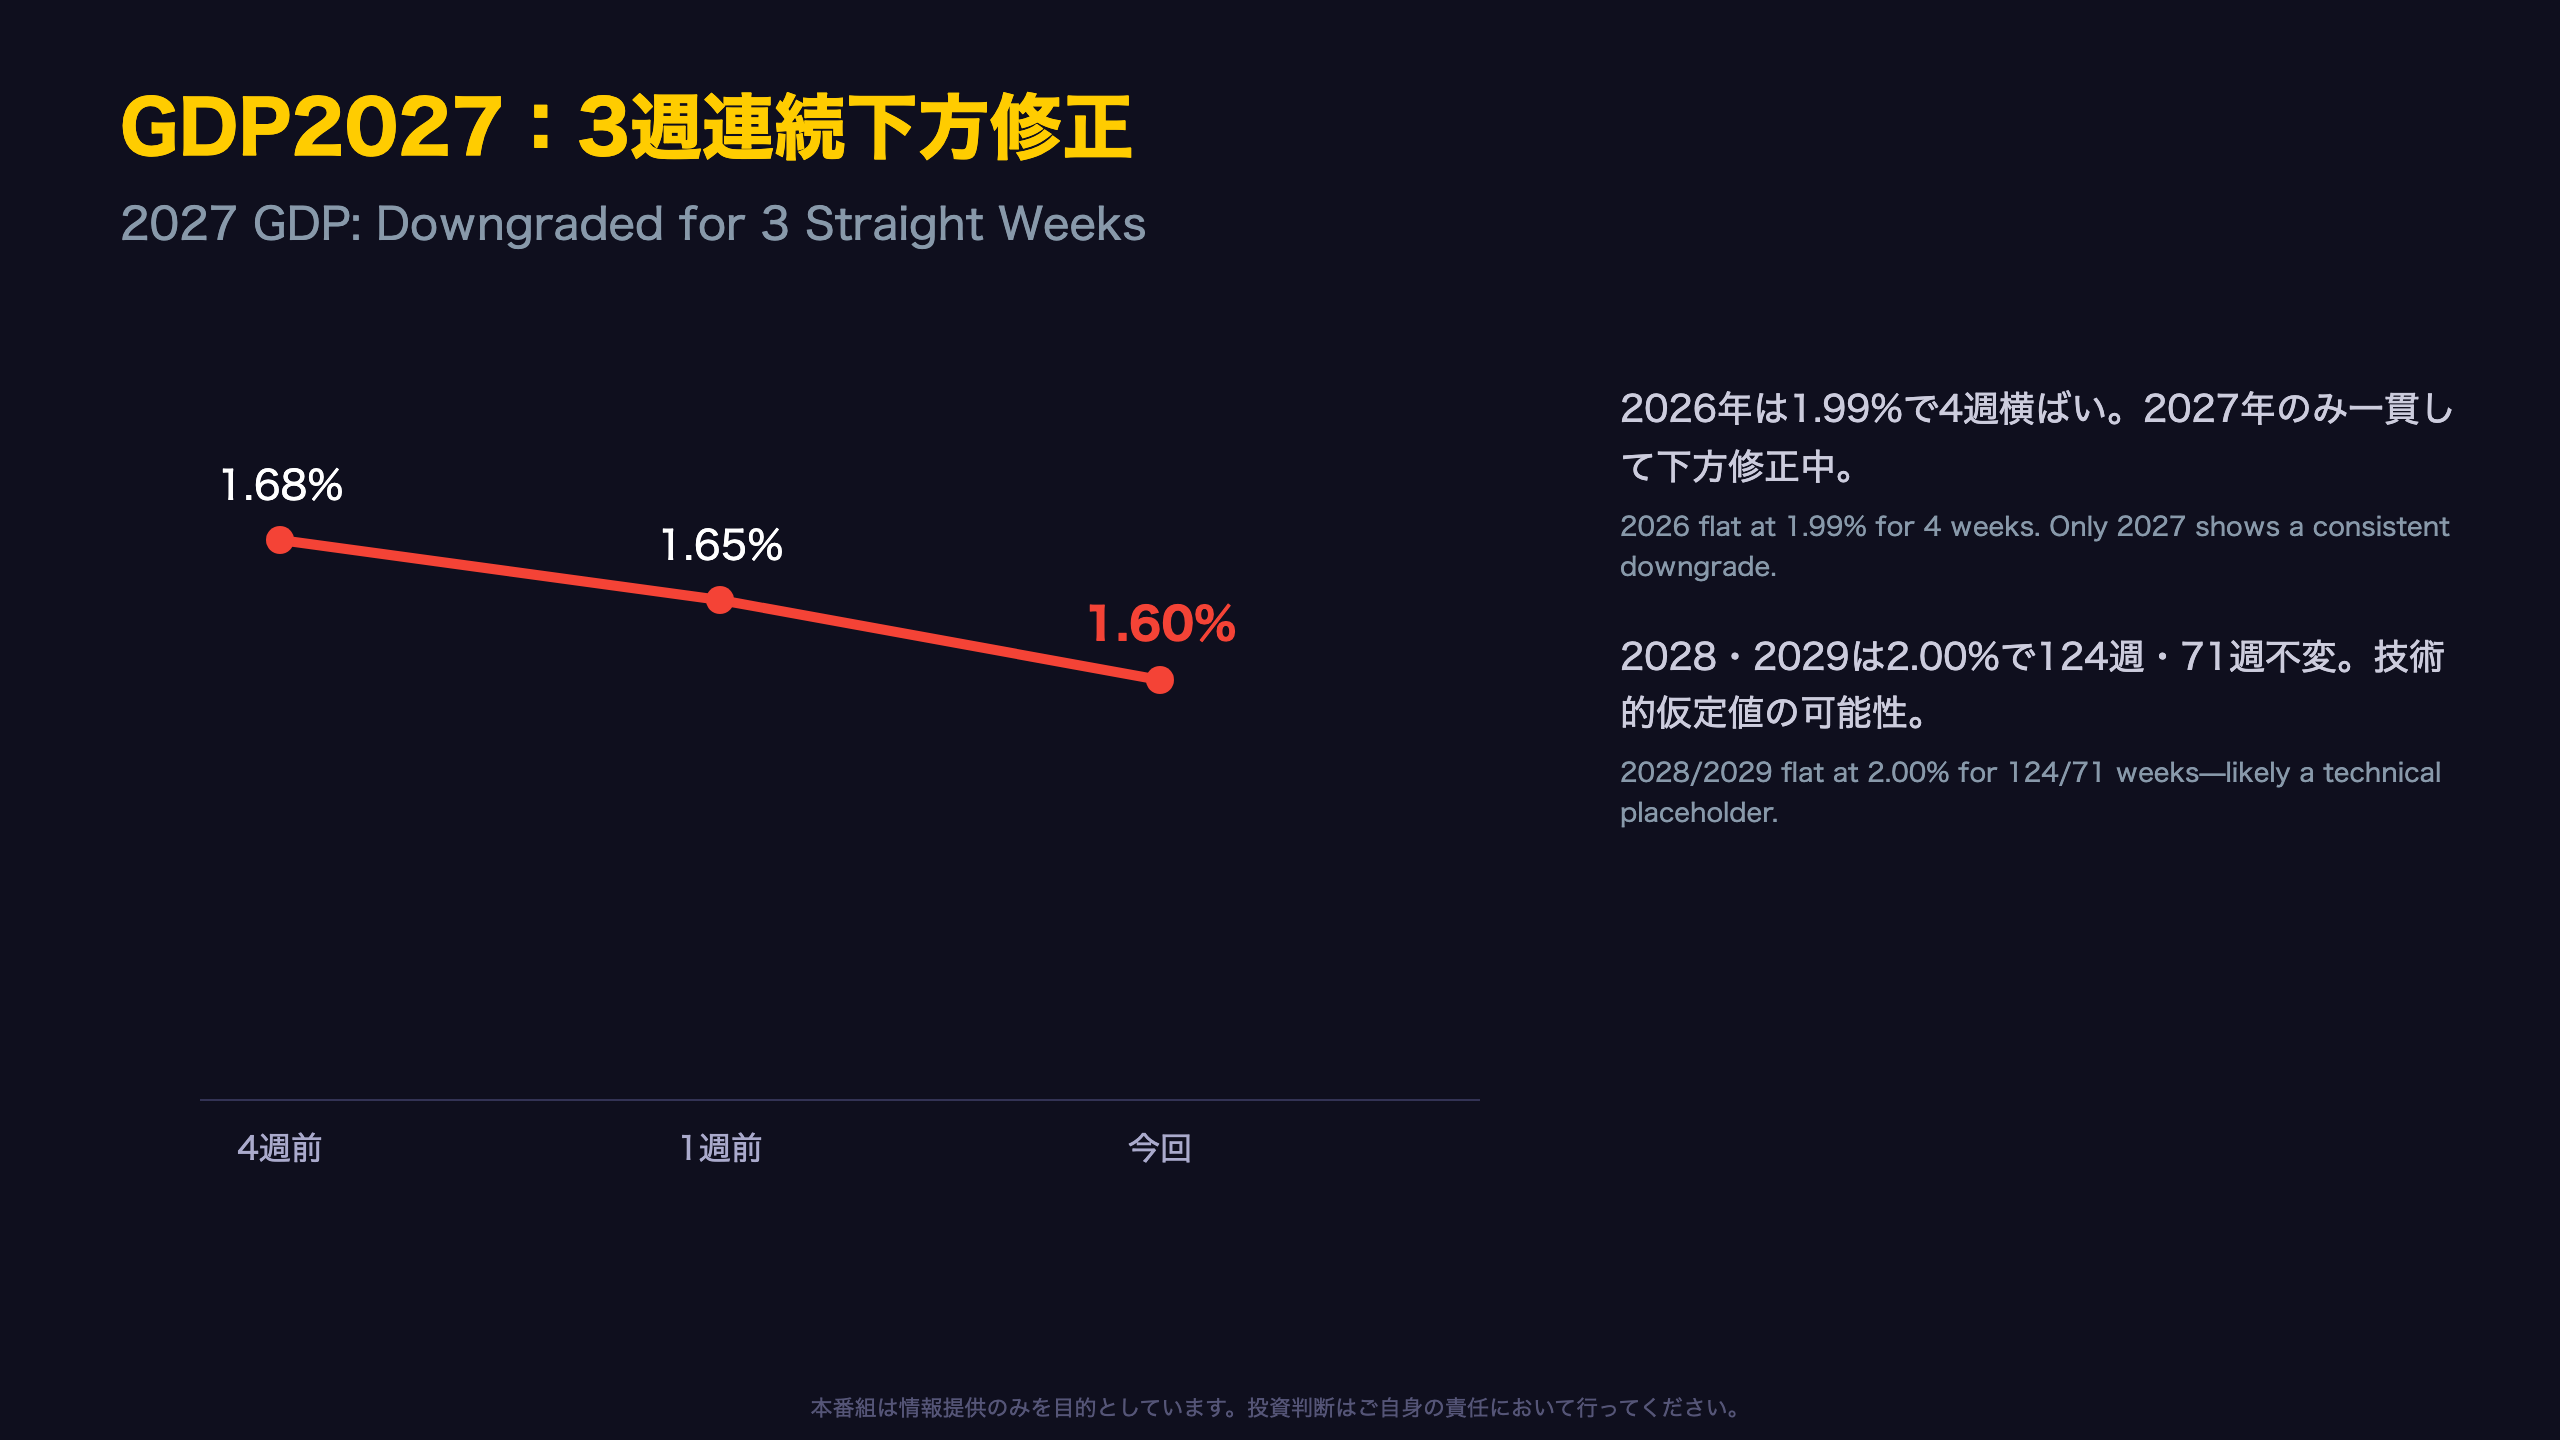
Testing the Persistence of GDP Downgrades
| Horizon | 4wk ago | 1wk ago | Now | Trend |
|---|---|---|---|---|
| 2026 | 1.99% | 1.99% | 1.99% | Flat (4wk) |
| 2027 | 1.68% | 1.65% | 1.60% | Down (1wk, part of ongoing downgrade) |
| 2028 | 2.00% | 2.00% | 2.00% | Flat (124wk) |
| 2029 | 2.00% | 2.00% | 2.00% | Flat (71wk) |
The fact that only the 2027 figure has been downgraded for three consecutive weeks meets a Level-B confidence threshold — this reads as a consistent trend, not single-month noise.
Why 2028-2029’s “Freeze” Is Different
A 124-week and 71-week unchanged streak is qualitatively different from Selic’s multi-week stability. Numbers static for that long likely reflect a mechanically-held long-run potential growth assumption rather than an updated read on current conditions (Level C caveat) — treat these two figures as technical placeholders, not fresh signals.
Connection to Fiscal and Inflation
A GDP downgrade could feed through to tax revenue assumptions underlying the fiscal balance forecasts (detailed in the next slide covering the primary result). However, this single dataset alone cannot establish a direct causal link to the fiscal trajectory.
貿易収支・FDI:上方修正が続く外的緩衝材
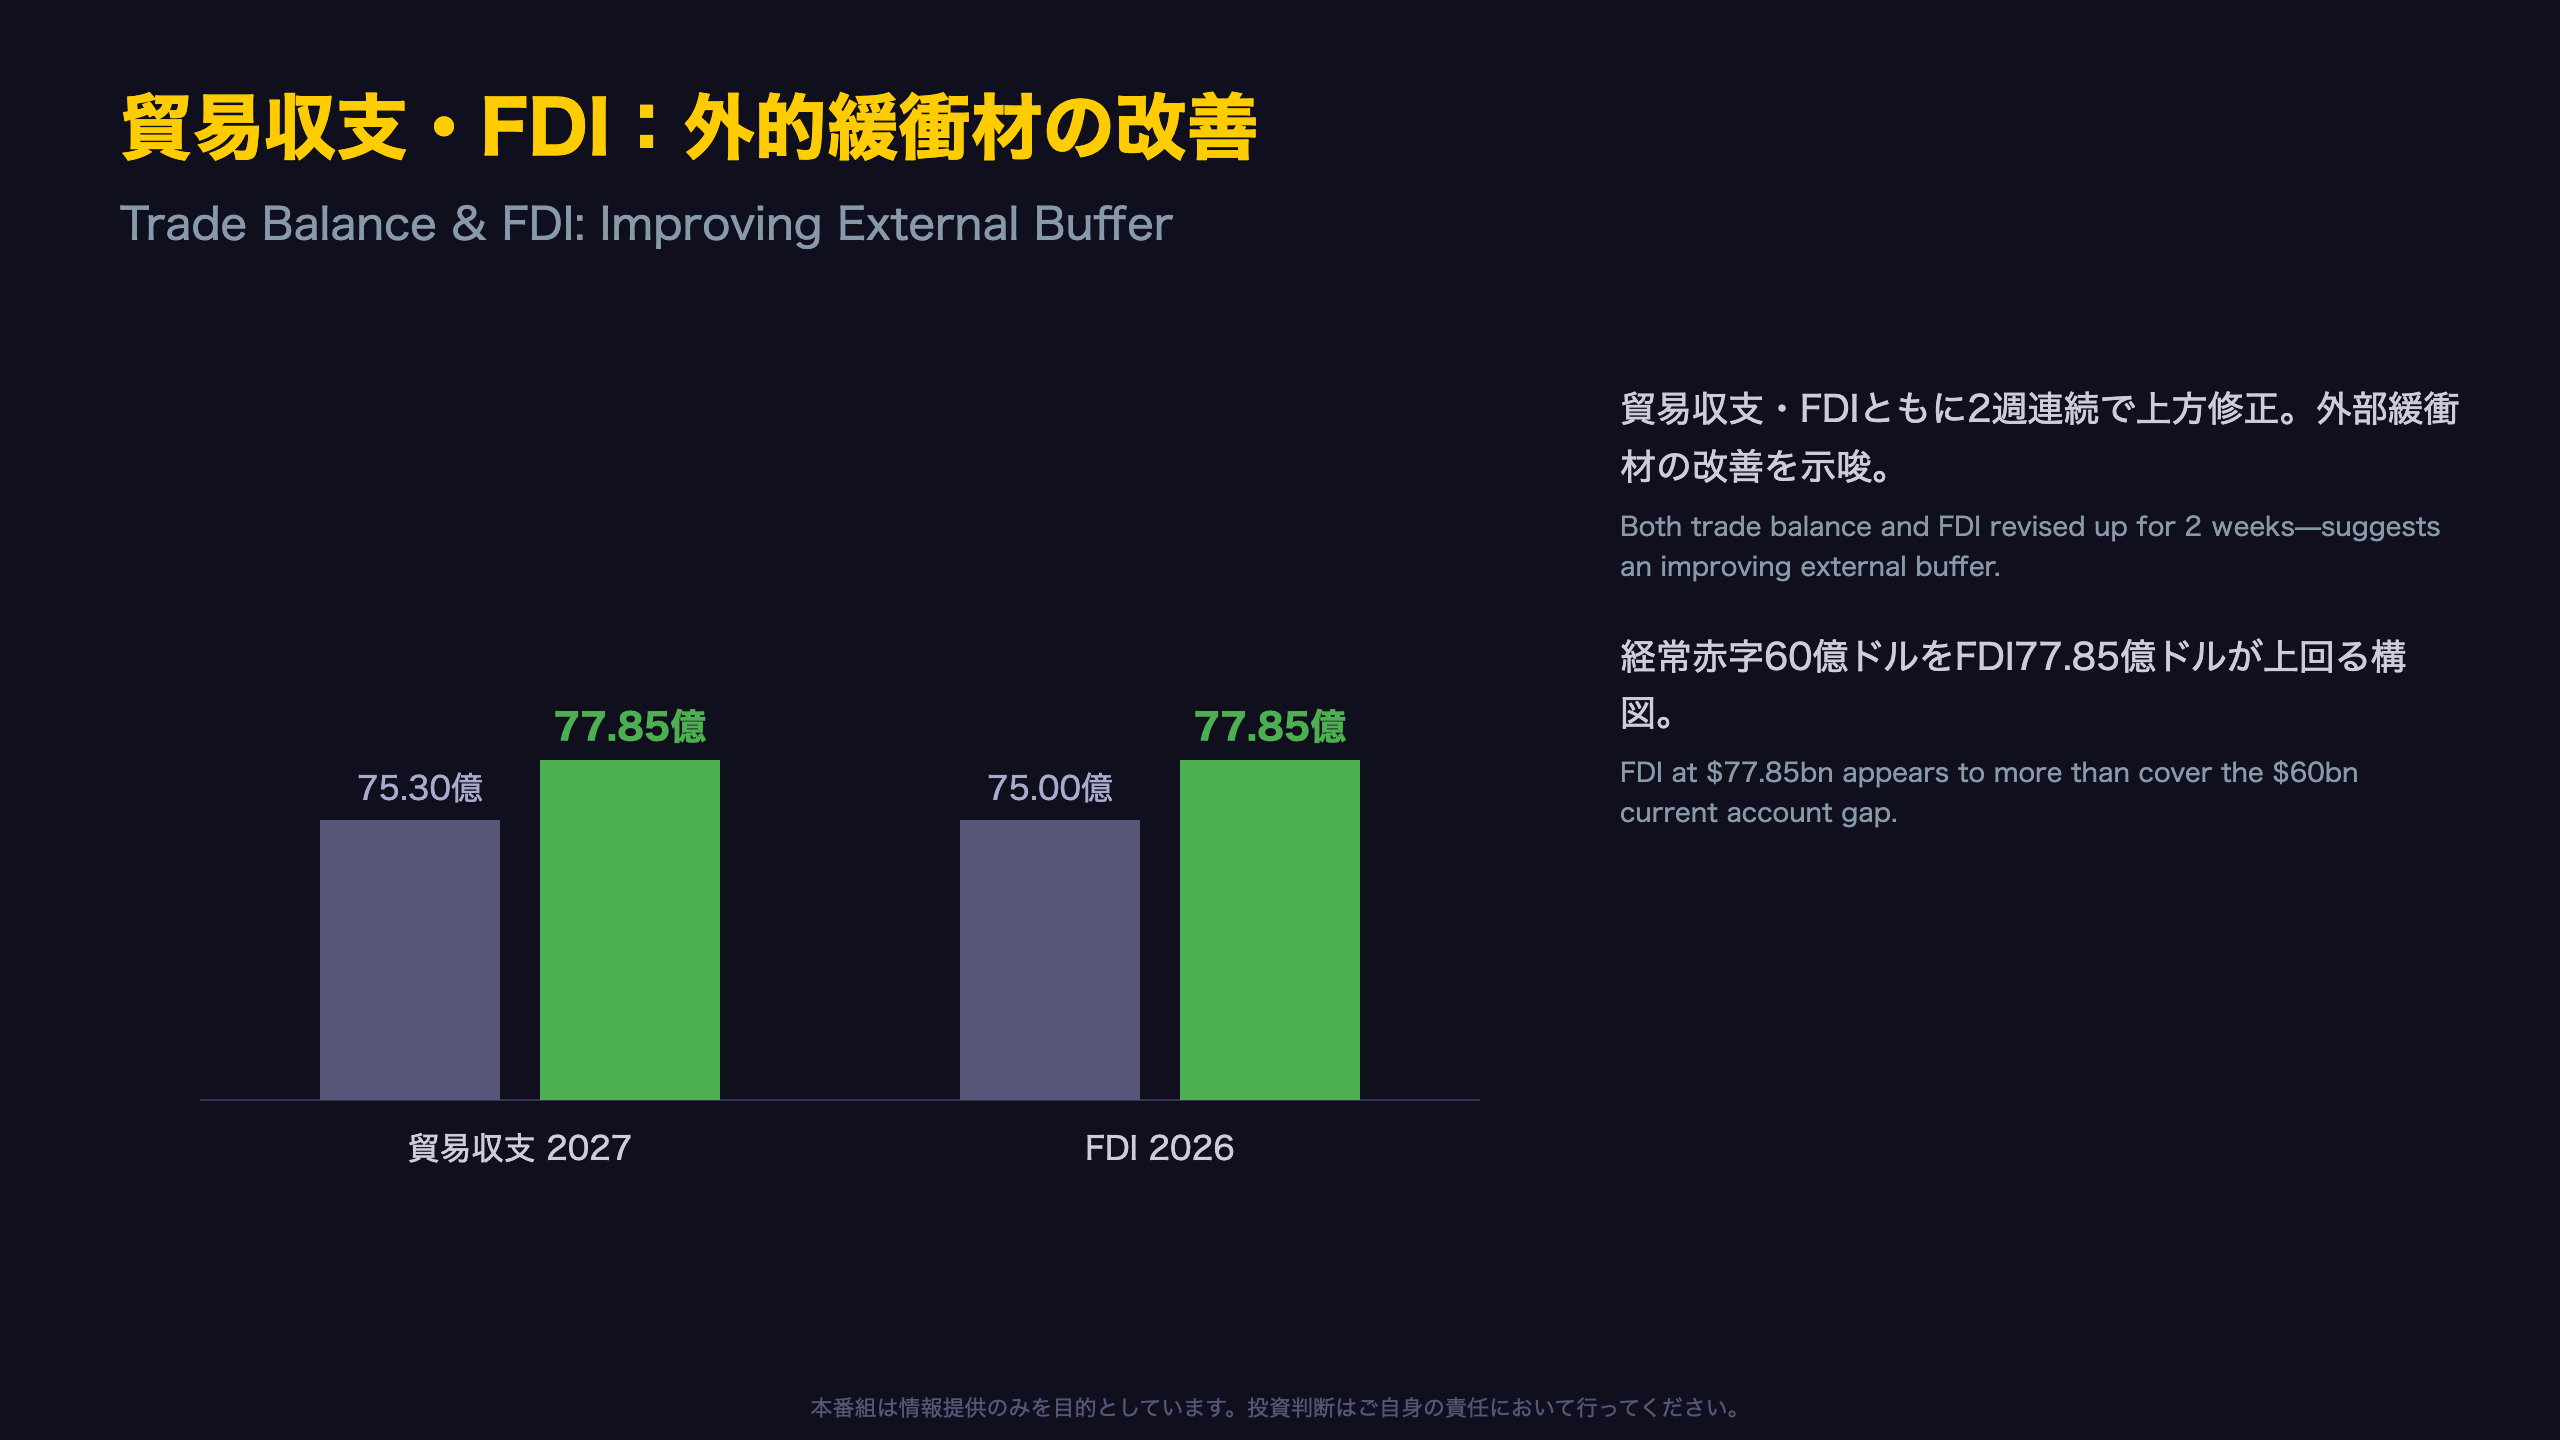
Stress-Testing the External Buffer
| Indicator | 4wk ago | Now | Change |
|---|---|---|---|
| Trade Balance 2027 | $75.30bn | $77.85bn | +$2.55bn |
| FDI 2026 | $75.00bn | $77.85bn | +$2.85bn |
| Current Account 2026 | -$60.25bn | -$60.00bn | +$0.25bn (improved) |
Both trade balance and FDI forecasts have been revised upward for two consecutive weeks — a pattern consistent enough to warrant a Level-B “suggests improvement” framing rather than dismissing it as noise.
Current Account vs. FDI — A Rough Balance Check
Brazil’s 2026 current account deficit is projected at $60.00 billion, while FDI inflows for the same year are forecast at $77.85 billion. On a simple arithmetic basis, FDI inflows appear more than sufficient to cover the current account gap, suggesting the capital account may face limited near-term vulnerability — a genuinely constructive data point for BRL bulls.
Caveats Worth Noting
These remain survey medians, not realized flows, and there is no guarantee they will materialize as projected. Additionally, while 2028-2029 trade balance and FDI forecasts also trend upward, uncertainty naturally increases the further out the horizon extends, so these longer-dated figures should be weighted more cautiously.
財政:赤字幅は安定も高水準が継続
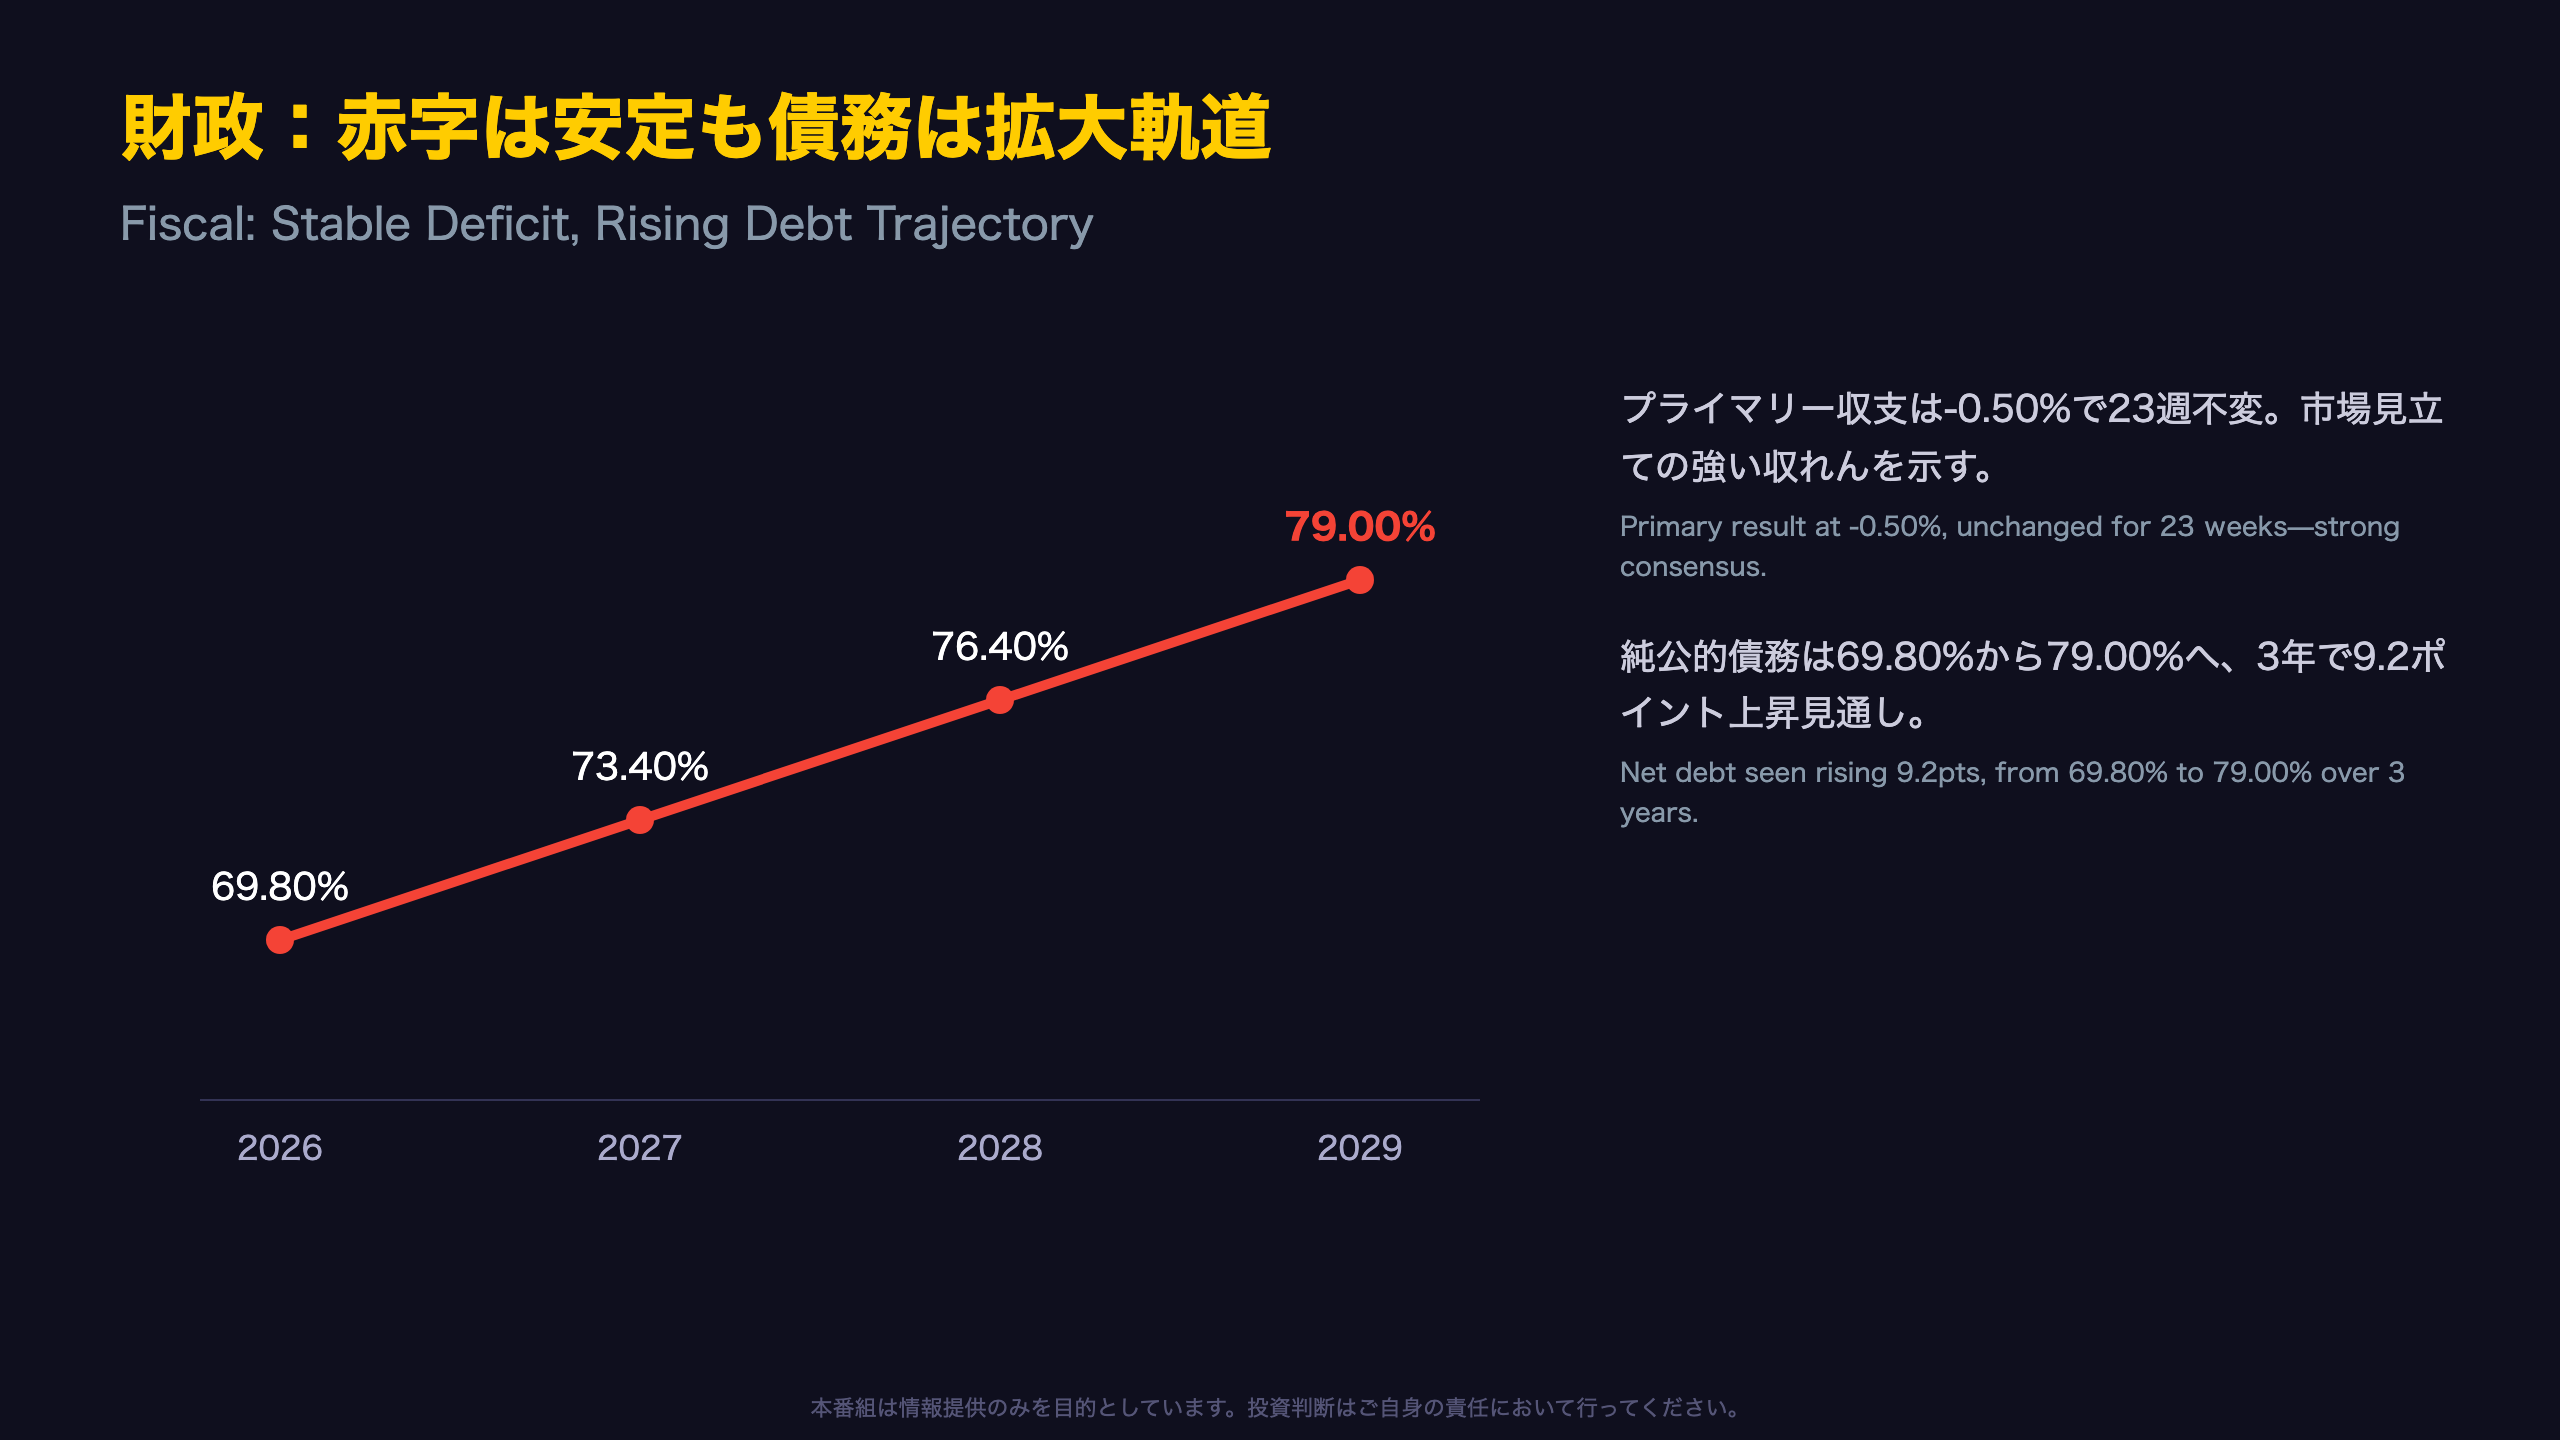
Tracing the Fiscal Path Over Time
| Year | Net Public Debt (% GDP) | Primary Result | Nominal Result |
|---|---|---|---|
| 2026 | 69.80% | -0.50% (unchanged 23wk) | -8.70% |
| 2027 | 73.40% | -0.40% (unchanged 18wk) | -8.20% |
| 2028 | 76.40% | -0.25% | -7.70% |
| 2029 | 79.00% | -0.16% (unchanged 1wk) | -7.20% |
Net public debt is projected to rise from 69.80% to 79.00% of GDP over three years — a 9.2 percentage-point increase directly stated in the original data, qualifying as a Level-A fact.
What a “23-Week Freeze” in the Primary Result Really Means
The 2026 primary result forecast has sat at exactly -0.50% of GDP for 23 consecutive weeks — a stability rivaling the Selic path itself, and a sign that market views on Brazil’s fiscal trajectory have converged strongly. But the flip side is that no fresh fiscal information appears to be feeding into the forecast at all.
An Alternative Read
One could read the improving trend in the nominal result (from -8.70% moving toward -7.20% by 2029) as encouraging. However, the primary result remains persistently negative, suggesting interest payment burdens are likely a major driver of the nominal gap — though this causal link is not explicitly stated in the source data and should be treated as a Level-C inference grounded in general fiscal-accounting logic, not a confirmed fact from this report.
BRL/JPYキャリー:14.00%対0.84%の金利差
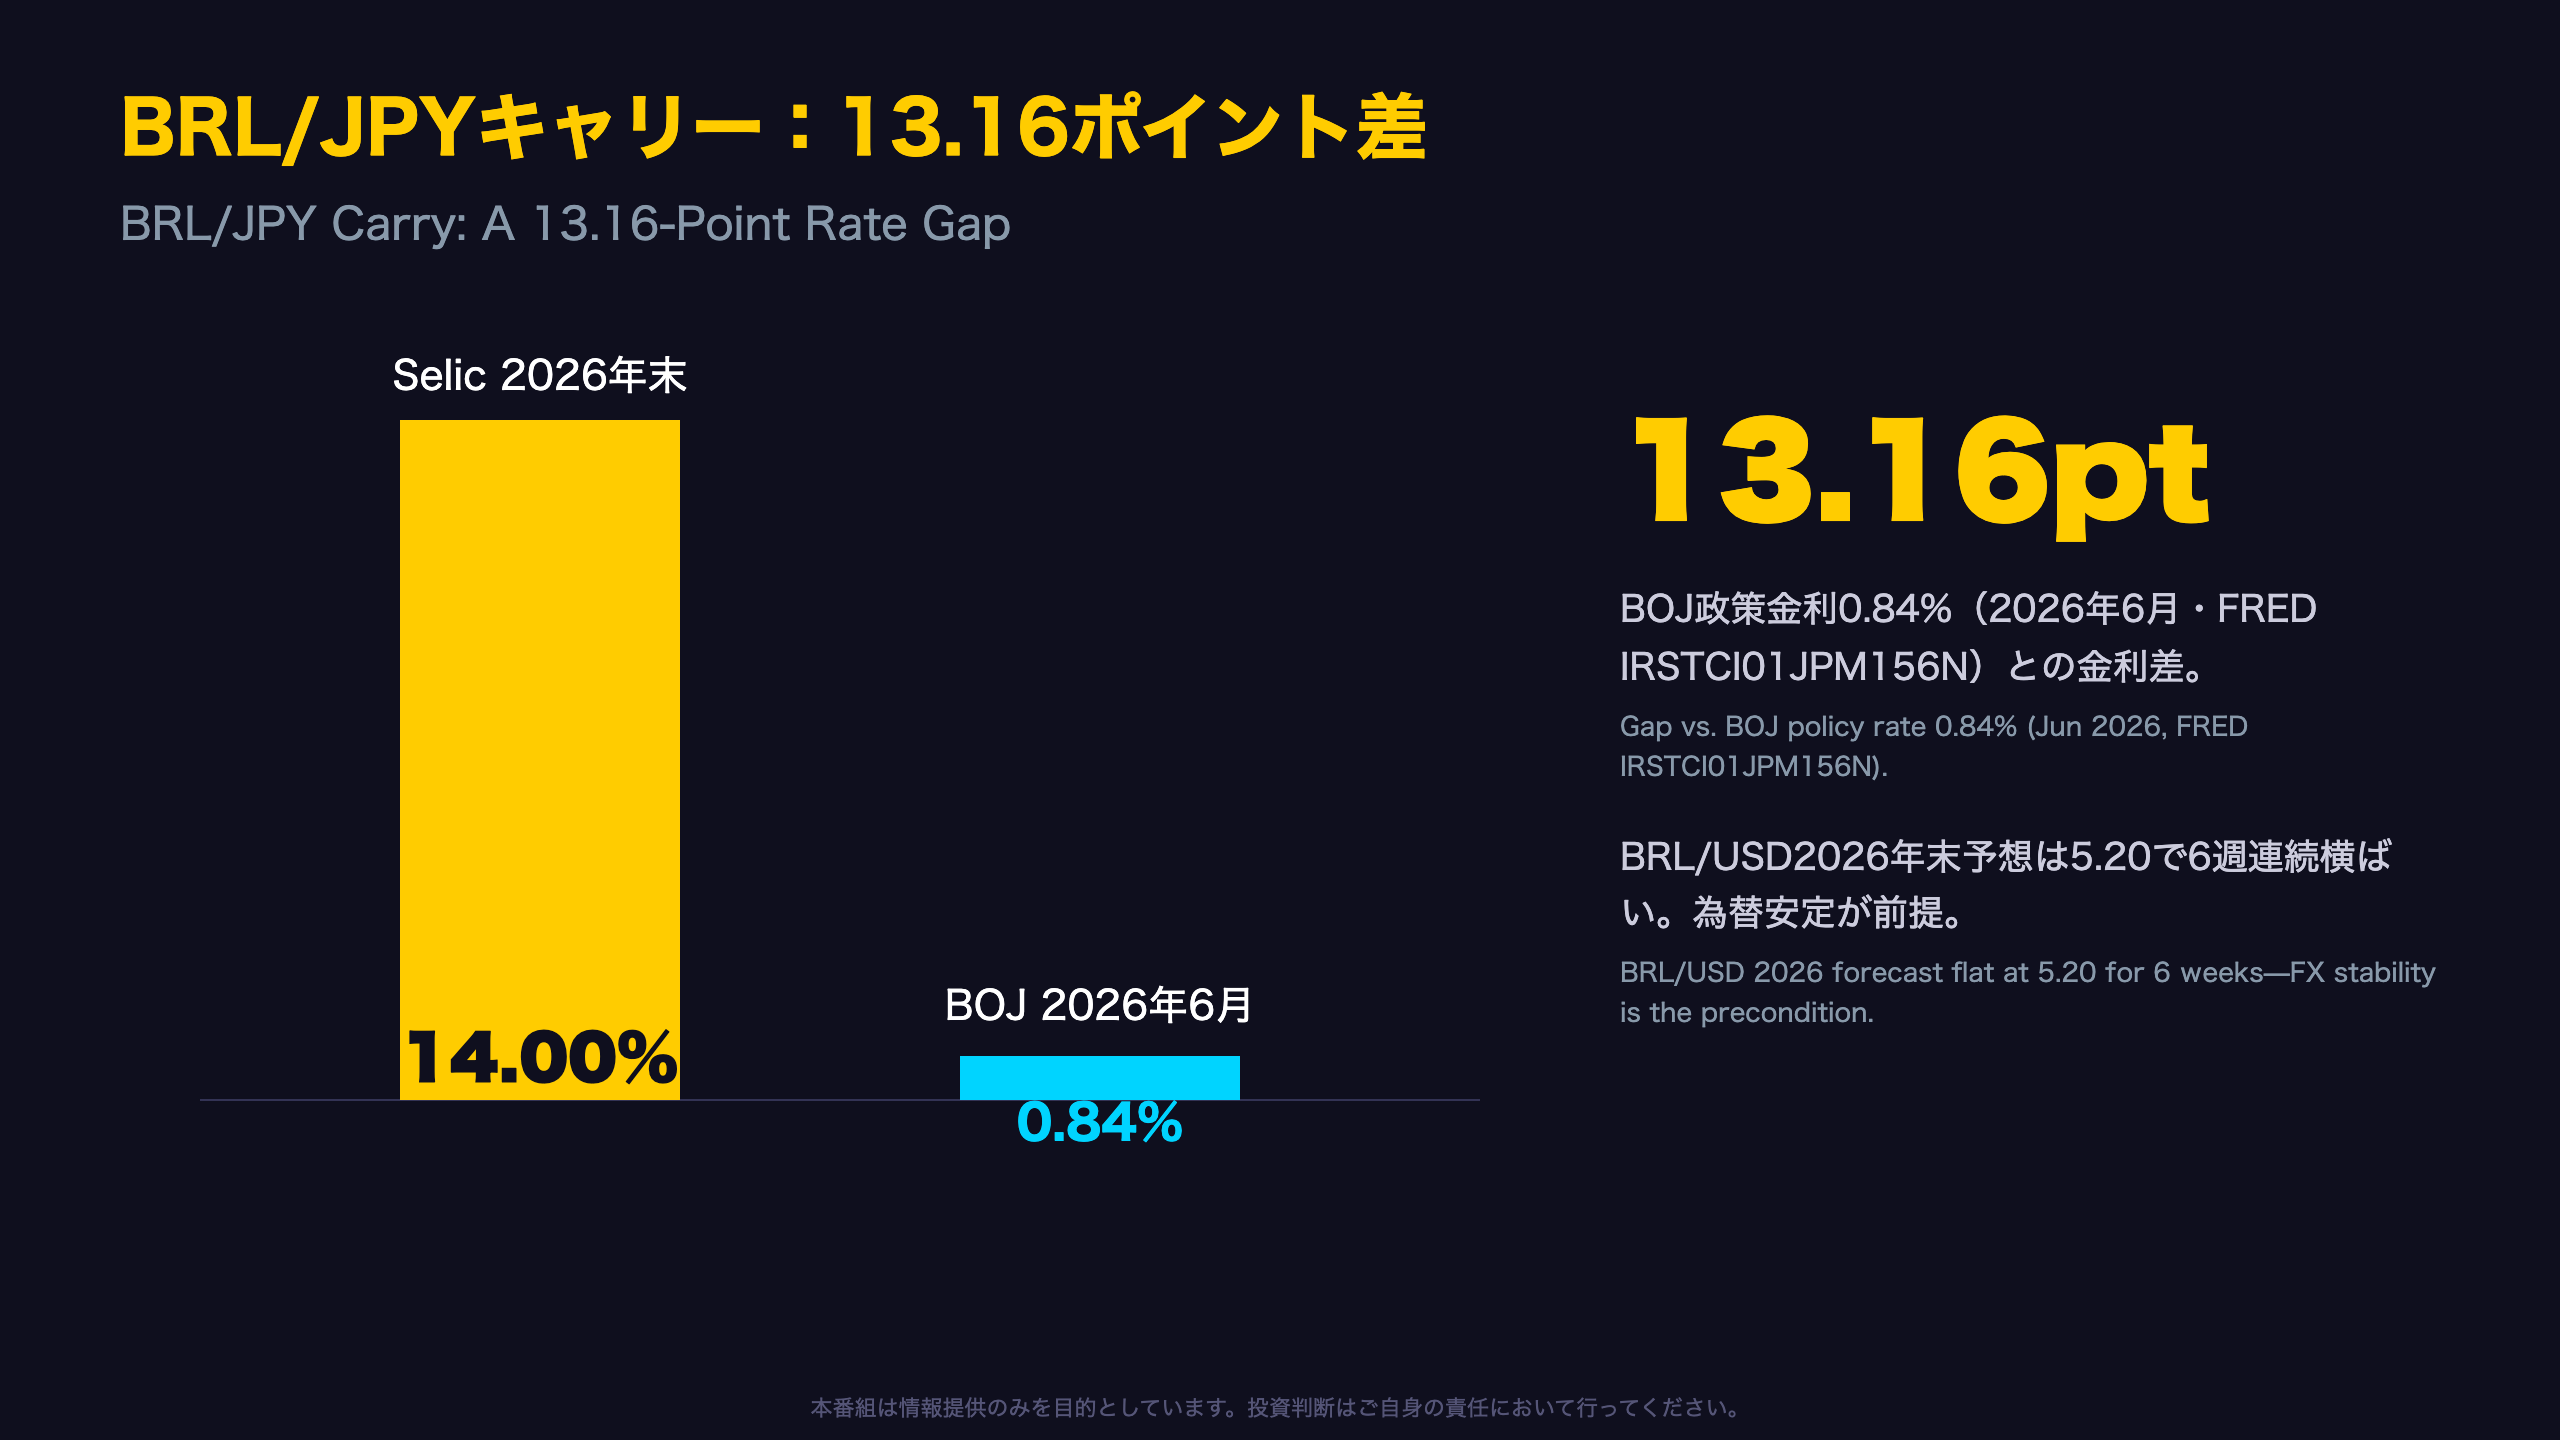
Breaking Down the Carry Trade Math
- Selic 2026 year-end forecast: 14.00% (unchanged for 5 weeks)
- BOJ policy rate: 0.84% (as of June 2026, FRED series IRSTCI01JPM156N)
- Rate differential: 13.16 percentage points
- BRL/USD 2026 year-end forecast: 5.20 (unchanged for 6 straight weeks, n=120)
Context for International Readers
Japan’s policy rate, tracked via the FRED IRSTCI01JPM156N series, remains near-zero by global standards even after the Bank of Japan’s gradual normalization steps — a stark contrast to Brazil’s still-restrictive Selic target. This dynamic has made BRL one of the more actively discussed carry-trade destinations among yen-funded strategies in recent years.
The Stability Precondition
Carry trade success hinges not just on the rate gap but on FX stability. Notably, this week’s Focus Readout shows the BRL/USD year-end 2026 forecast frozen at 5.20 for six consecutive weeks — signaling the market currently does not anticipate a sharp real depreciation in the near term.
Risks Have Not Disappeared
At the same time, Brazil’s nominal fiscal result remains deeply negative at -8.70% of GDP, and net public debt is on a rising medium-term trajectory (see previous slide). It is generally understood that rising fiscal risk can amplify emerging-market currency volatility, though this single Focus Readout dataset alone cannot pinpoint the timing or magnitude of any such event.
Implications for Japanese Investors
For Japanese retail investors holding Brazilian government bonds or BRL-denominated assets, a rate gap exceeding 13 points is an attractive yield pickup — but a single adverse FX move can erase months of carry income. With the Selic path already frozen across multiple years, further widening of the differential looks unlikely from here; the swing factor going forward may increasingly be BRL’s own exchange-rate stability rather than the rate gap itself.
インプリケーション:金利安定とリスクの両立
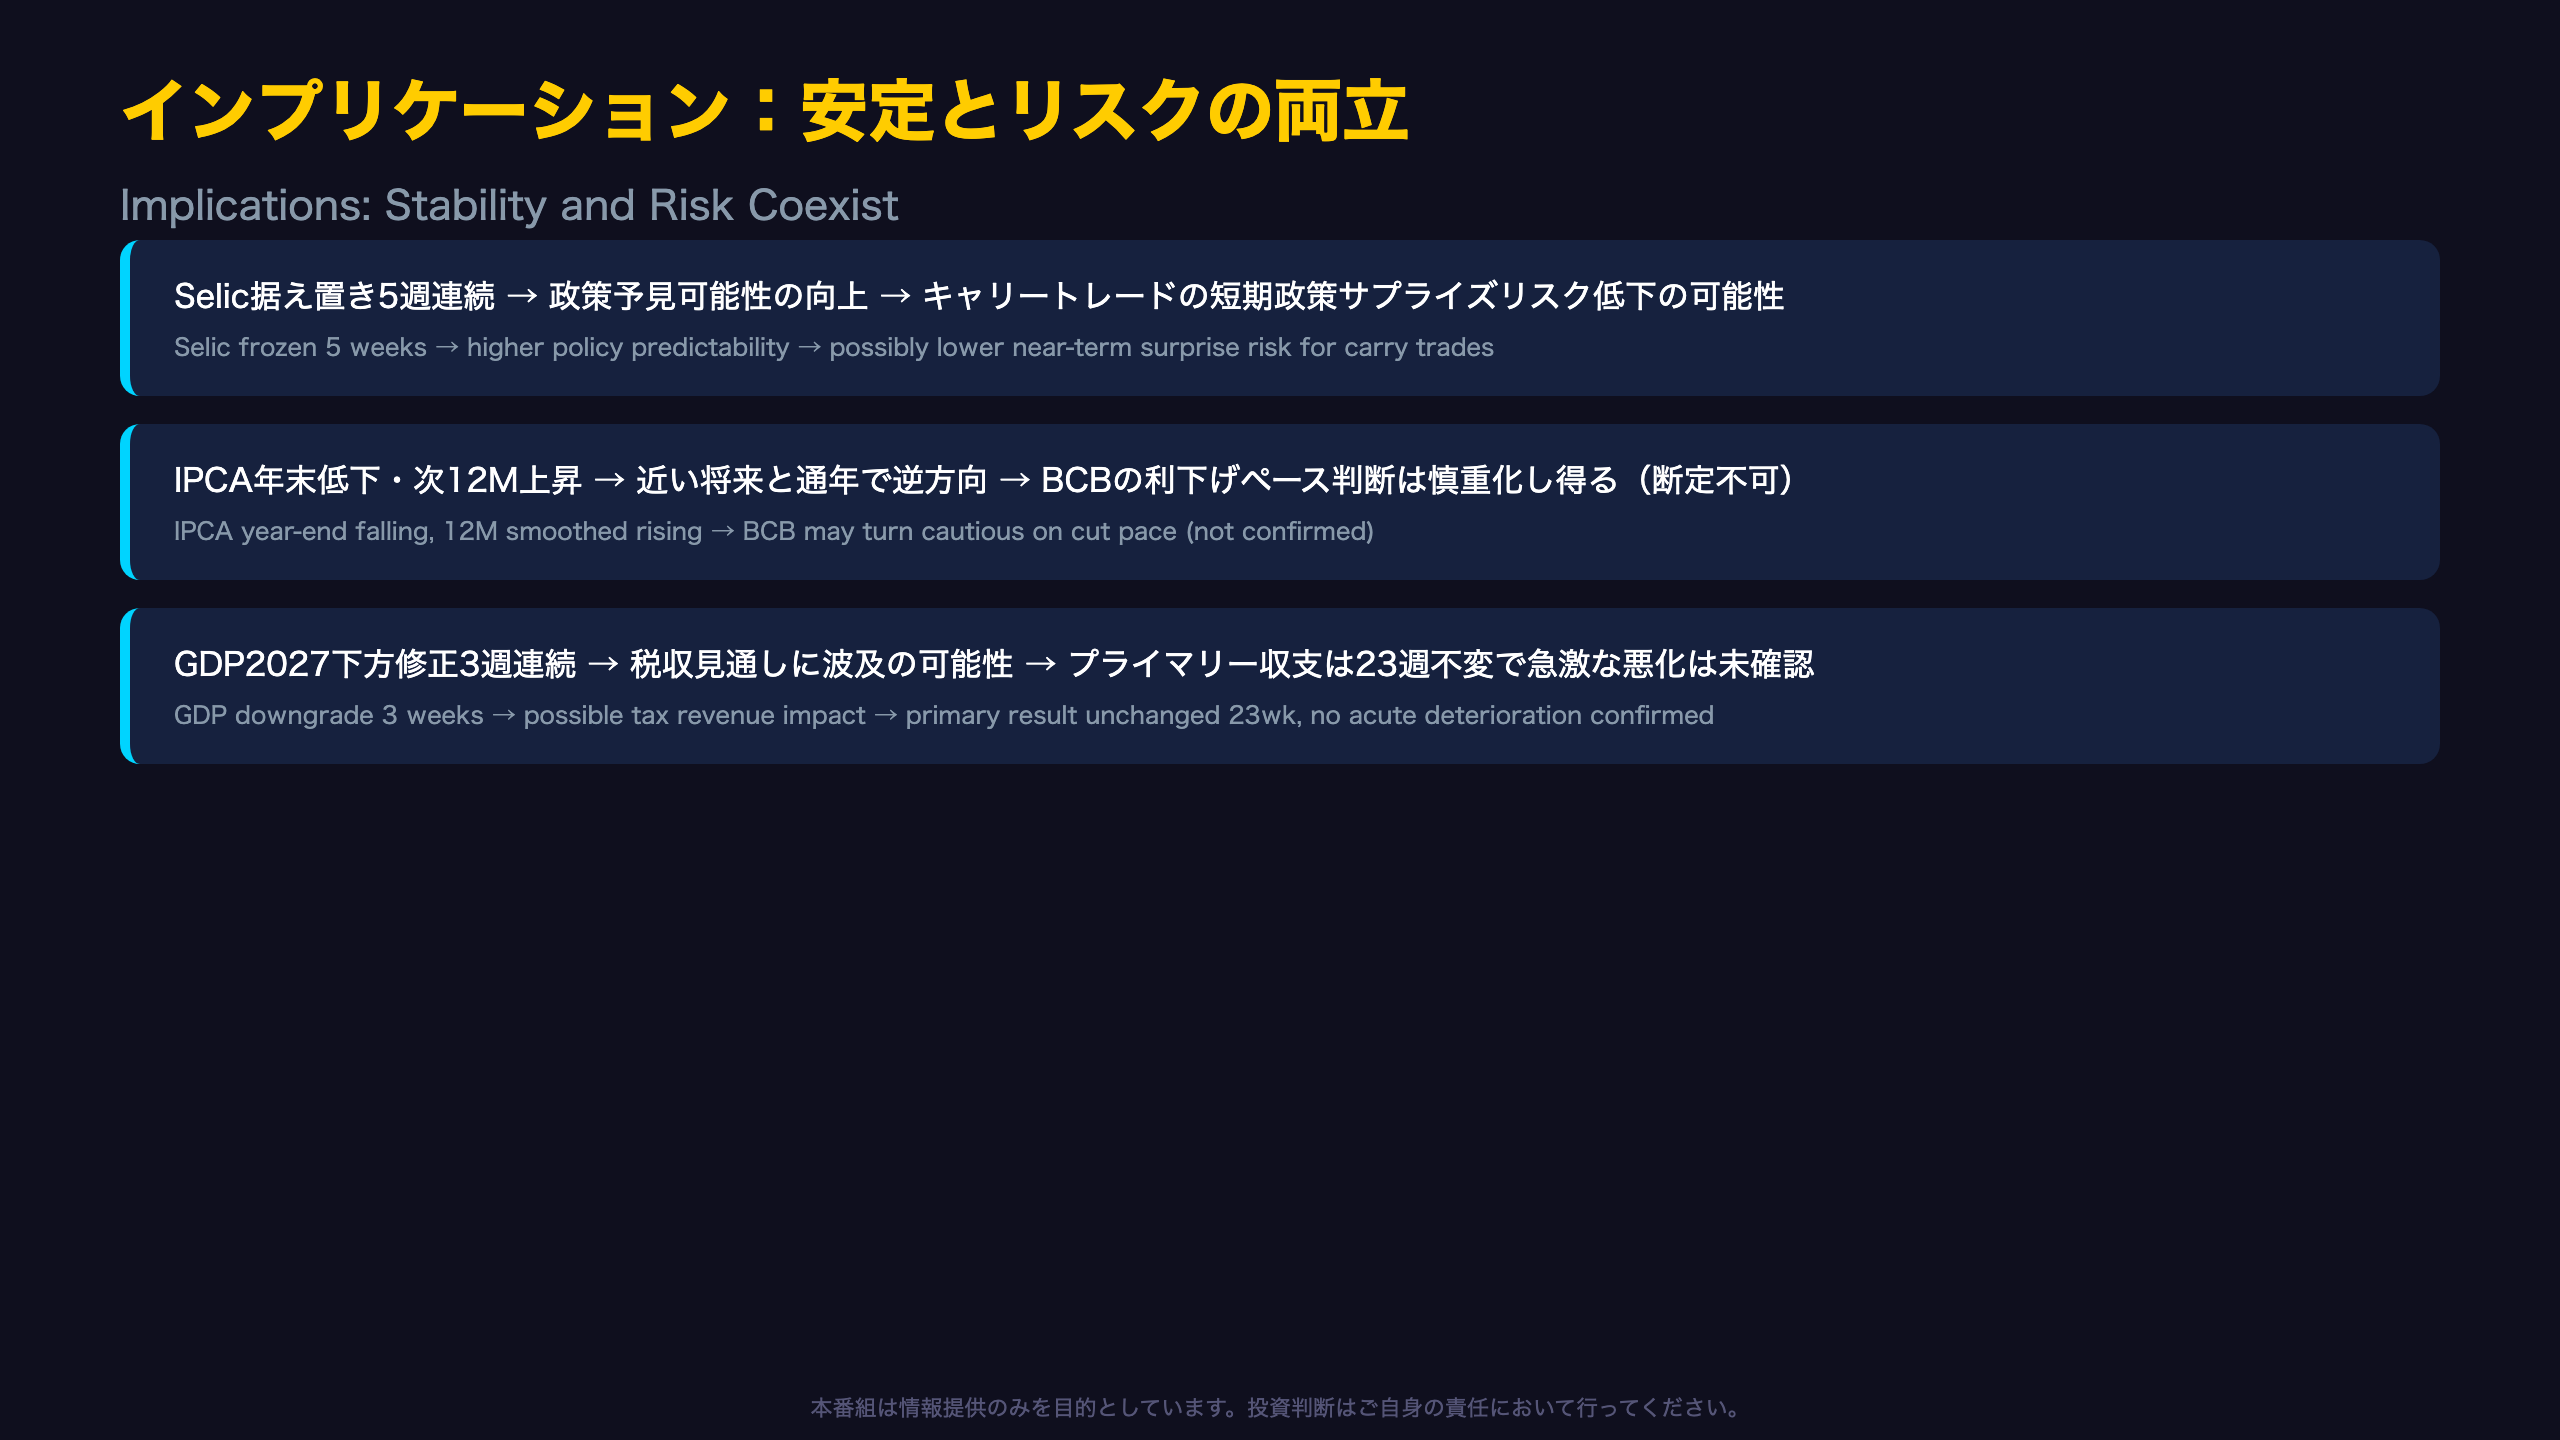
This Week’s Implications, Traced Through Chains of Reasoning
Chain 1: Rate Path Stability
“Year-end Selic forecasts stayed unchanged across all four horizons (2026-2029) for multiple weeks” → “policy predictability rises, lowering position-adjustment costs for market participants” → “this could be read as reducing near-term policy-surprise volatility risk for BRL-denominated carry trades.”
Chain 2: Inflation’s Dual Nature
“2026 year-end IPCA fell to 5.12% for a 4th straight week, while the next-12-month smoothed forecast rose to 4.19% for a 3rd straight week” → “near-term cooling coexists with annual-basis stickiness” → “it is generally believed this kind of divergence could make BCB more cautious about the pace of future rate cuts, though this dataset alone cannot confirm the specific outcome of the next COPOM meeting.”
Chain 3: Growth Softening Meets Fiscal Overhang
“2027 GDP was downgraded from 1.68% to 1.60% over three consecutive weeks” → “weaker growth expectations can feed through to the fiscal balance via lower tax revenue assumptions” → “it is generally believed that fiscal deterioration concerns can widen sovereign spreads, though the primary result itself has stayed unchanged for 23 weeks, and this data does not show an acute near-term fiscal risk materializing.”
Bottom Line
This week’s Focus Readout combines the resilience of a stable policy and FX path with the caution of softening growth and a large fiscal deficit. For Japanese investors, the takeaway is to enjoy the rate-gap appeal while continuously monitoring whether the underlying assumption of FX stability itself remains intact.
Disclaimer: This article is for informational purposes only. All investment decisions are made solely at your own risk.