This article was automatically generated by the NFC Market Live AI analysis system. (Updated: 2026-08-20 10:37 JST)
📄 Primary Source
Australian Bureau of Statistics
https://www.abs.gov.au/statistics/labour/employment-and-unemployment/labour-force-australia/latest-release
📊 The Australian Bureau of Statistics released June 2026 Labour Force data.
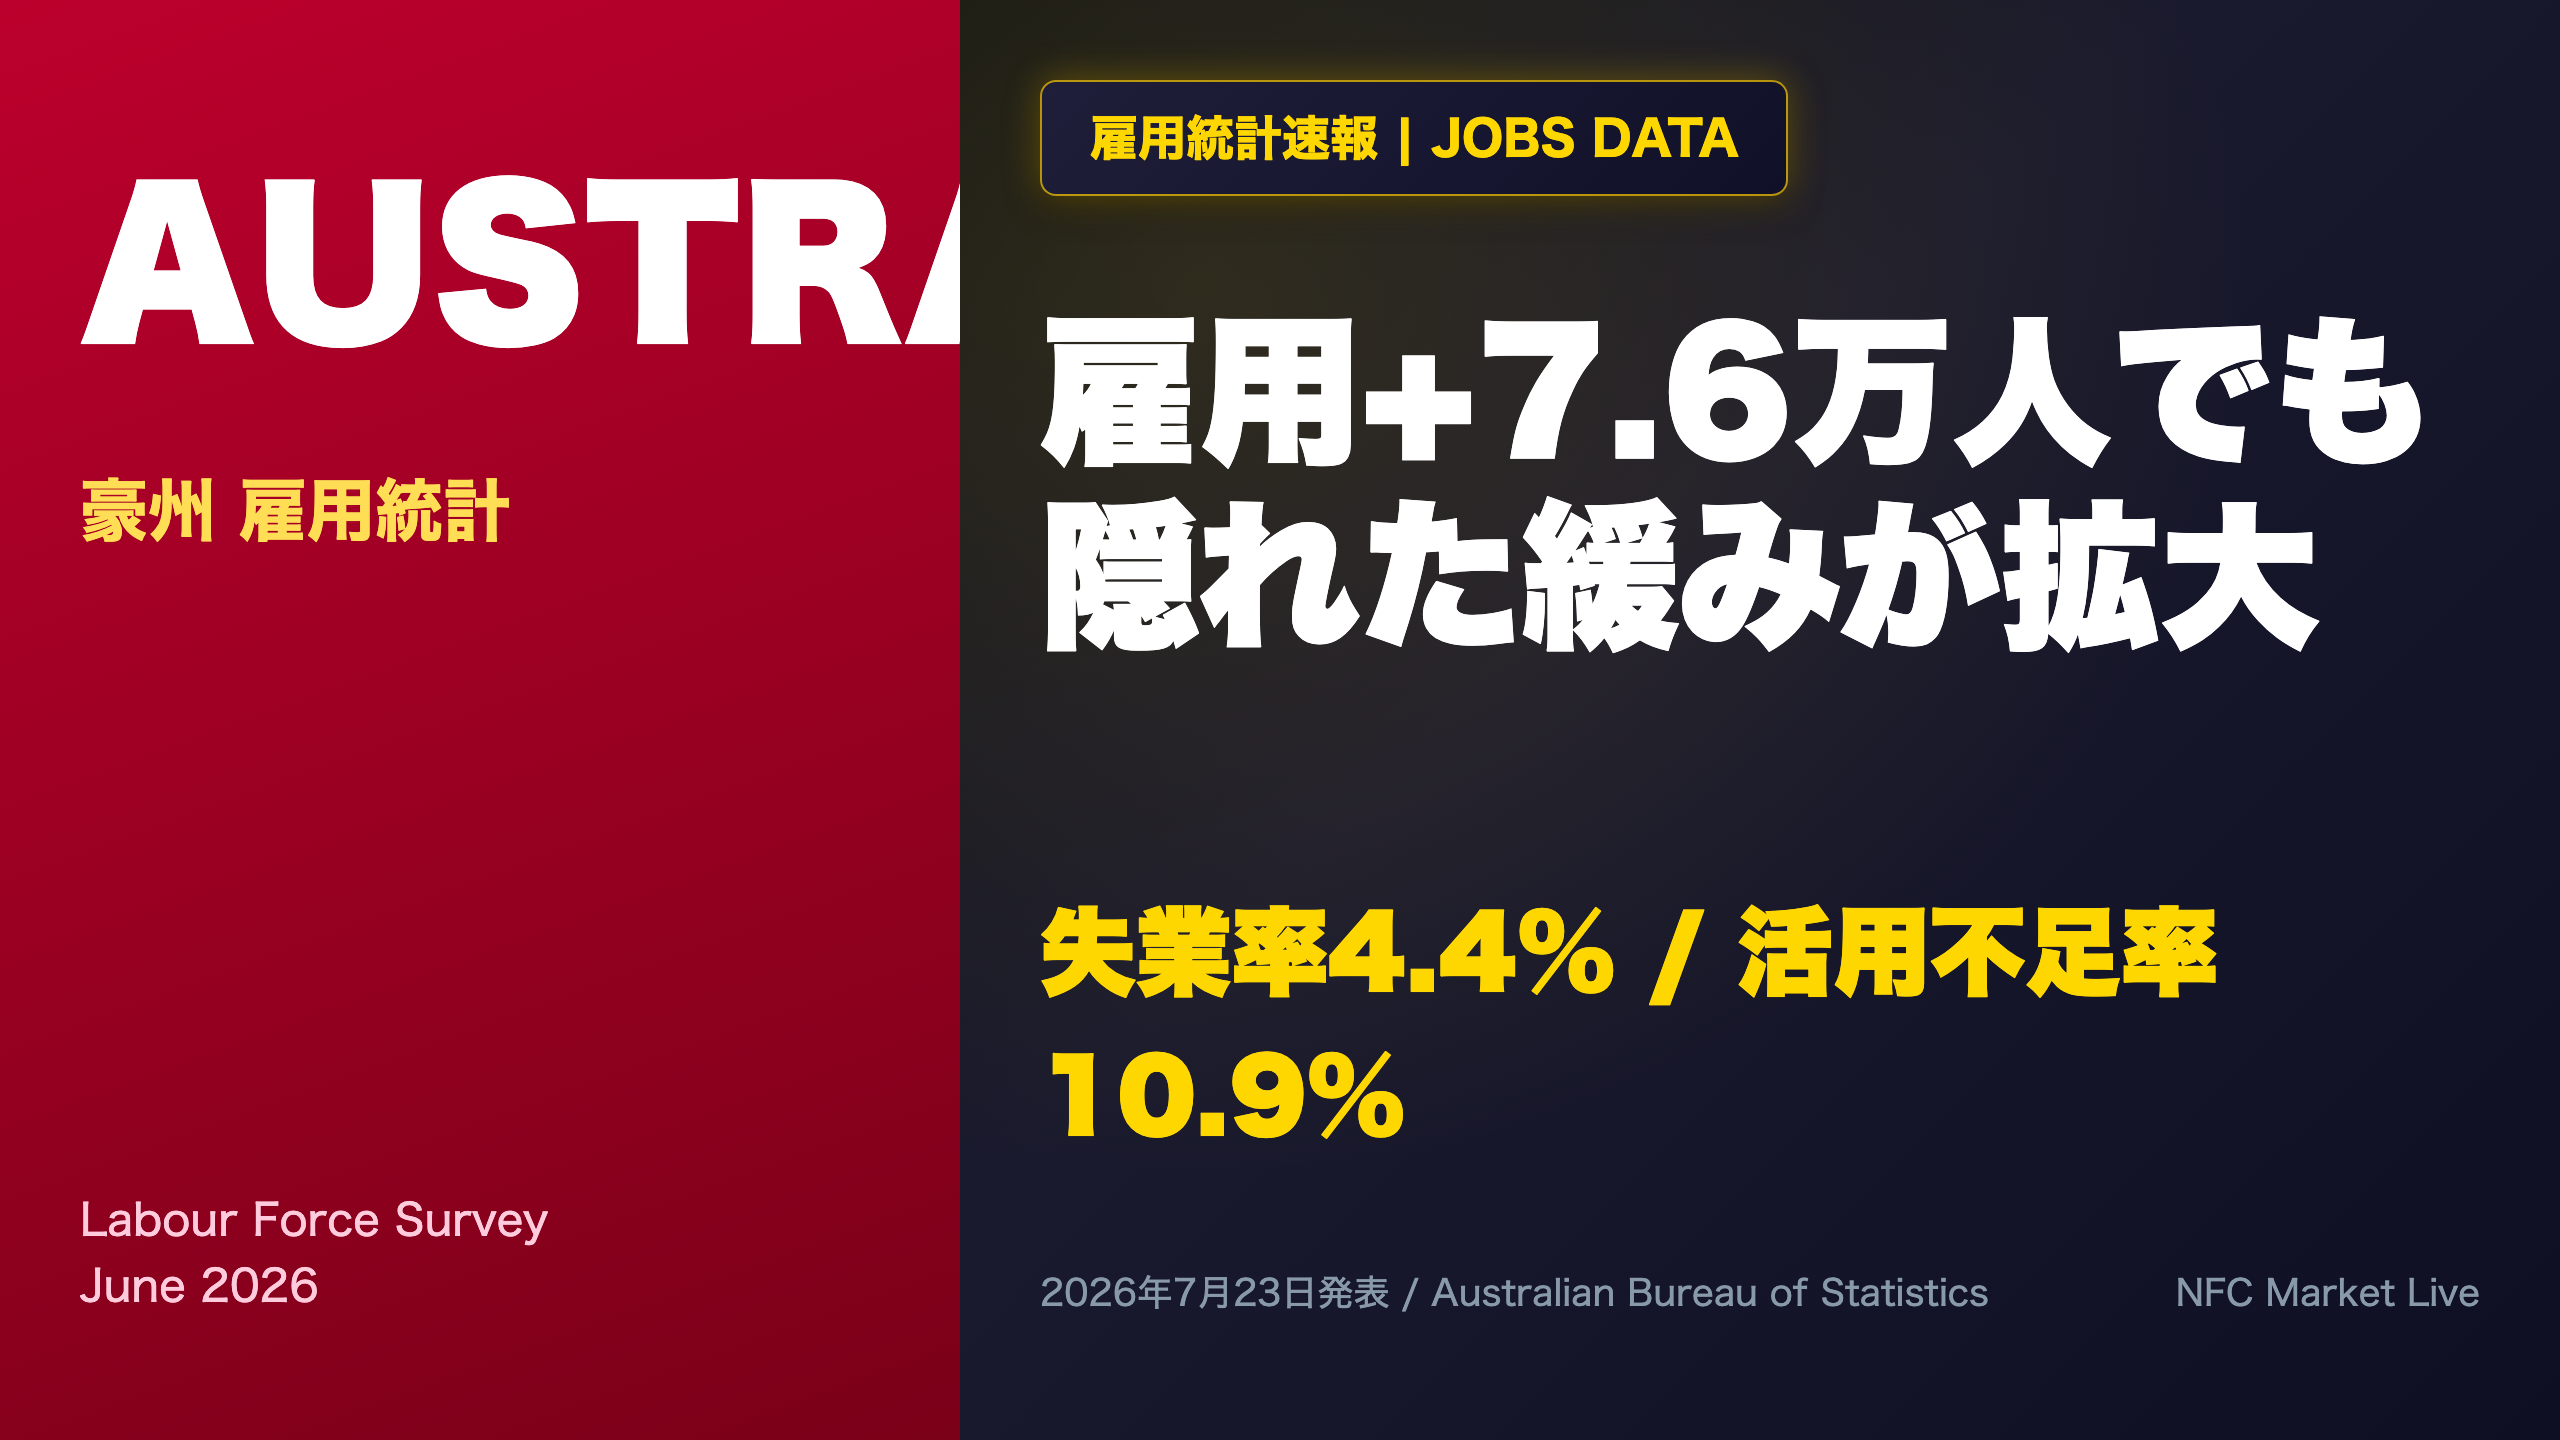
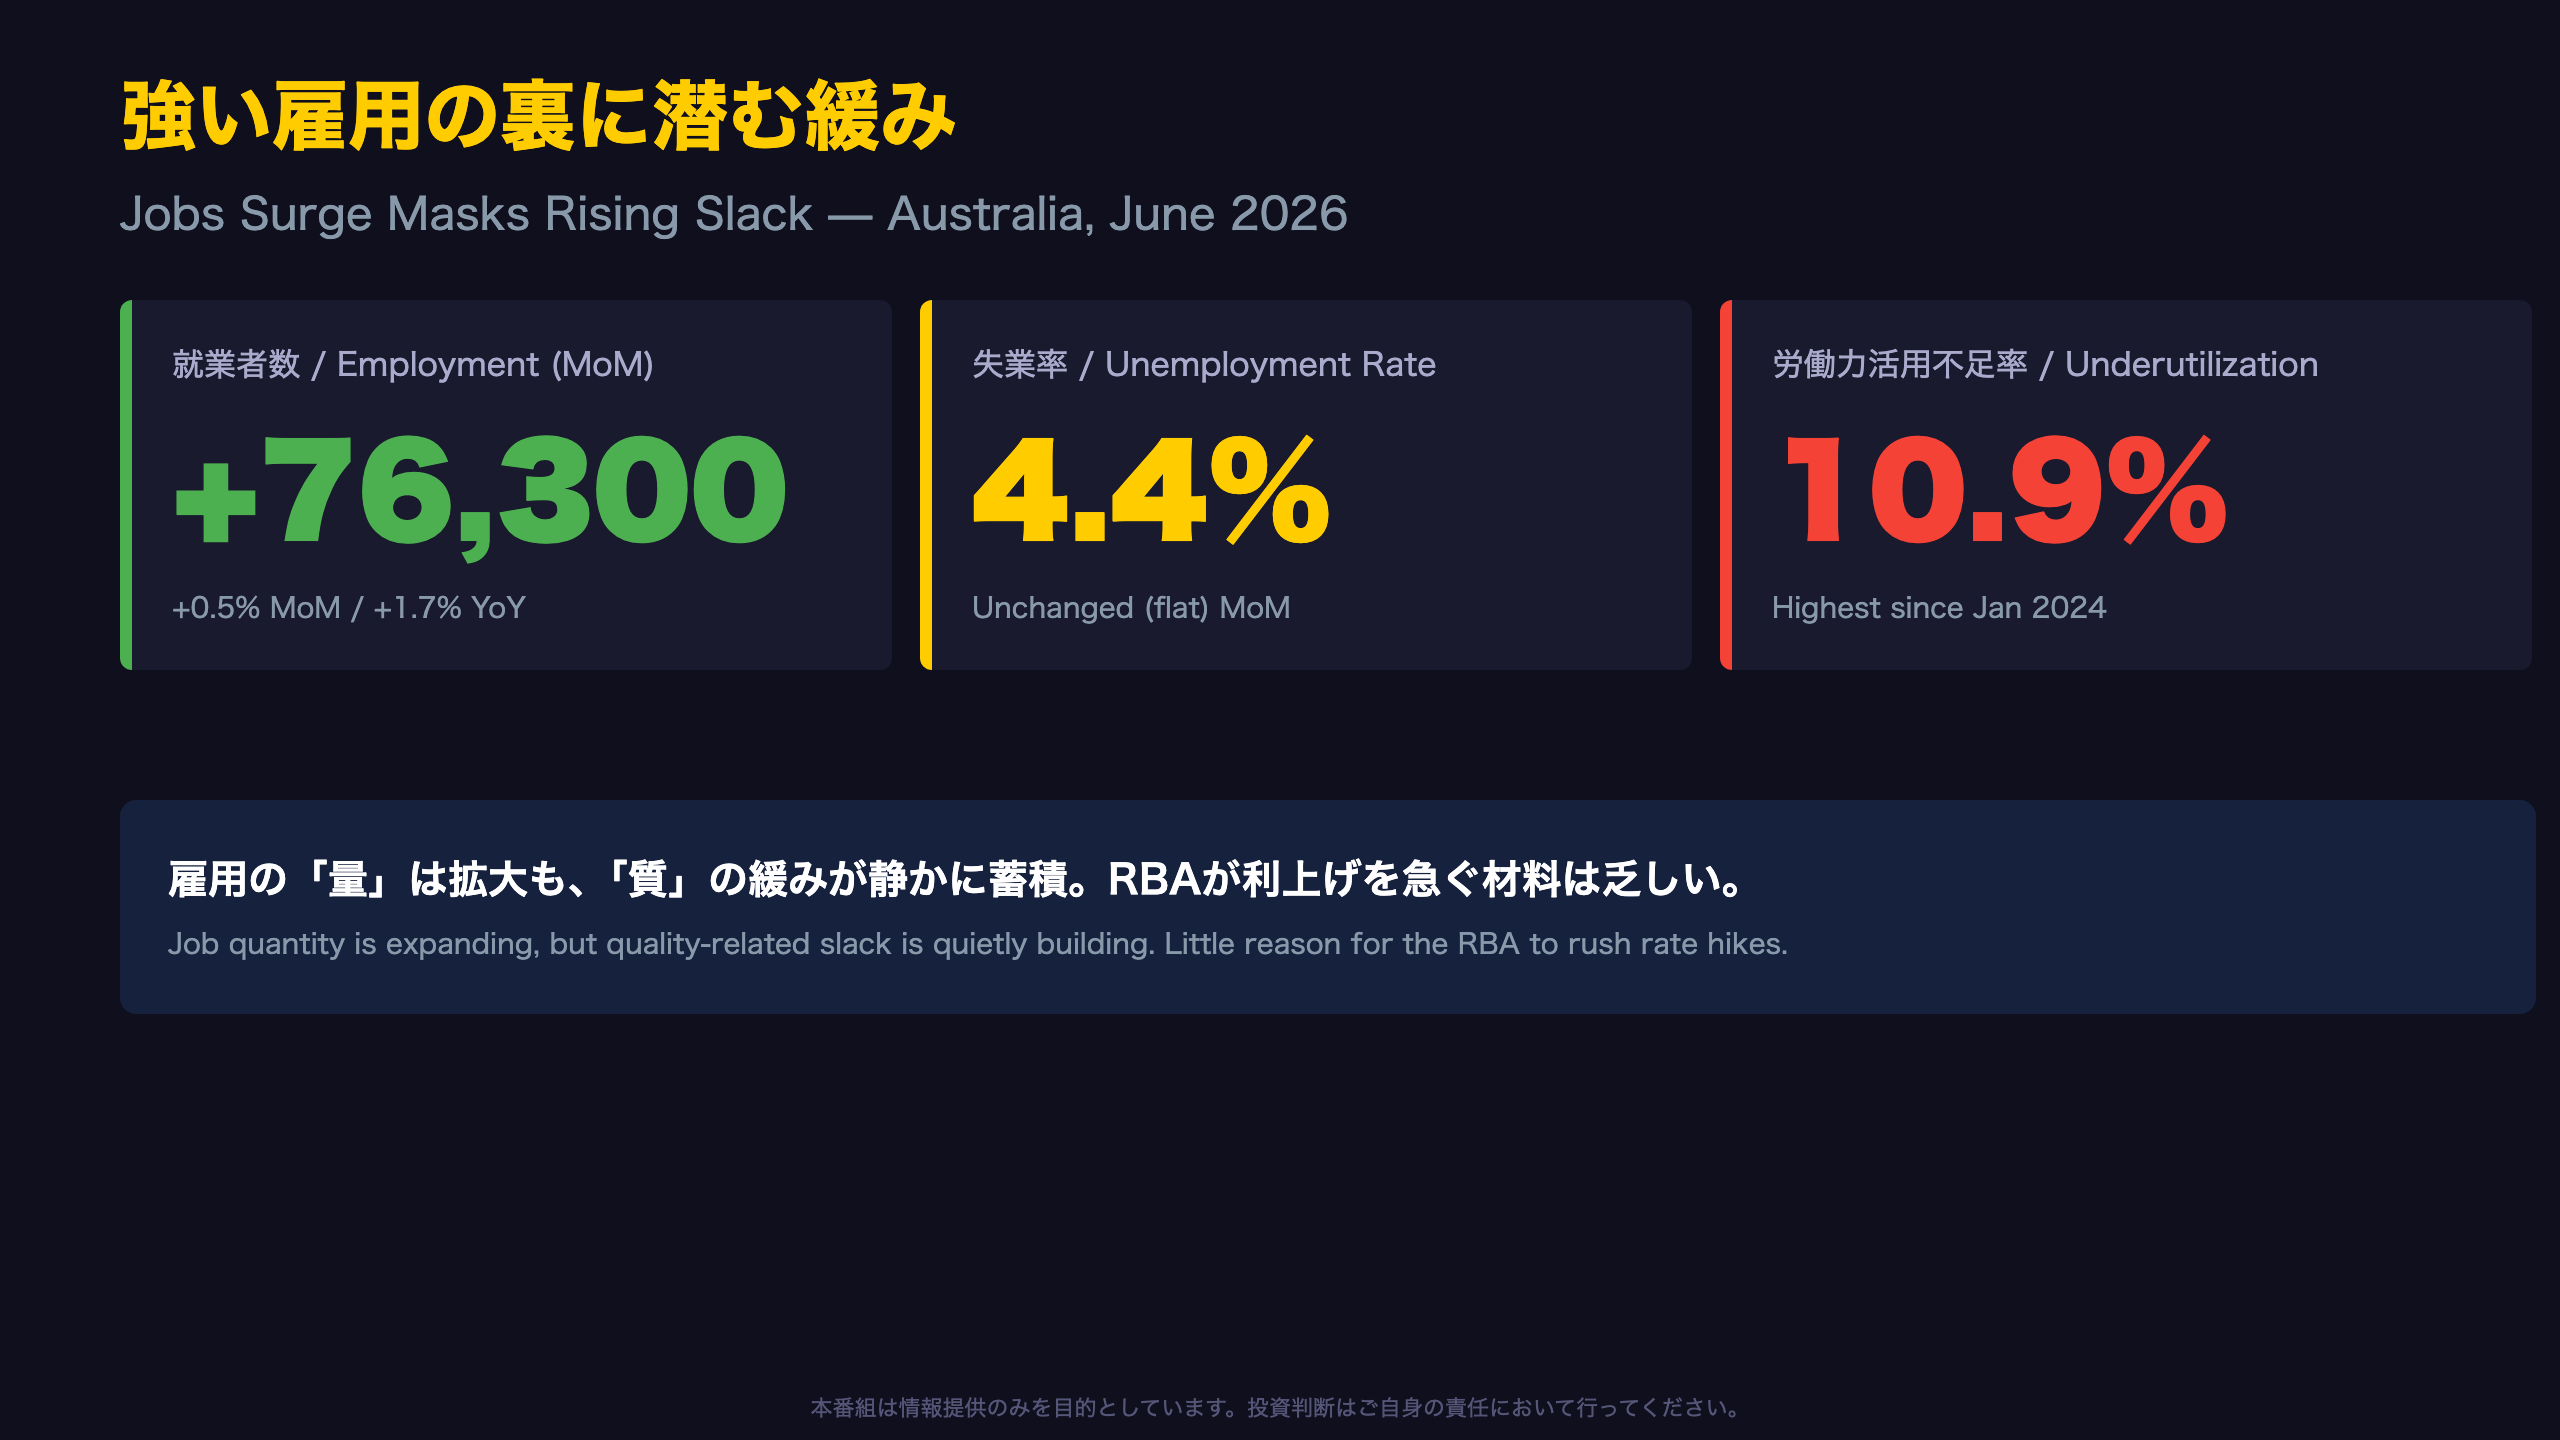
Employment surged +76,300, while unemployment held steady at 4.4%.
📈 But the composition tells a more nuanced story: over 60% of new jobs were part-time, and hours worked grew slower than headcount.
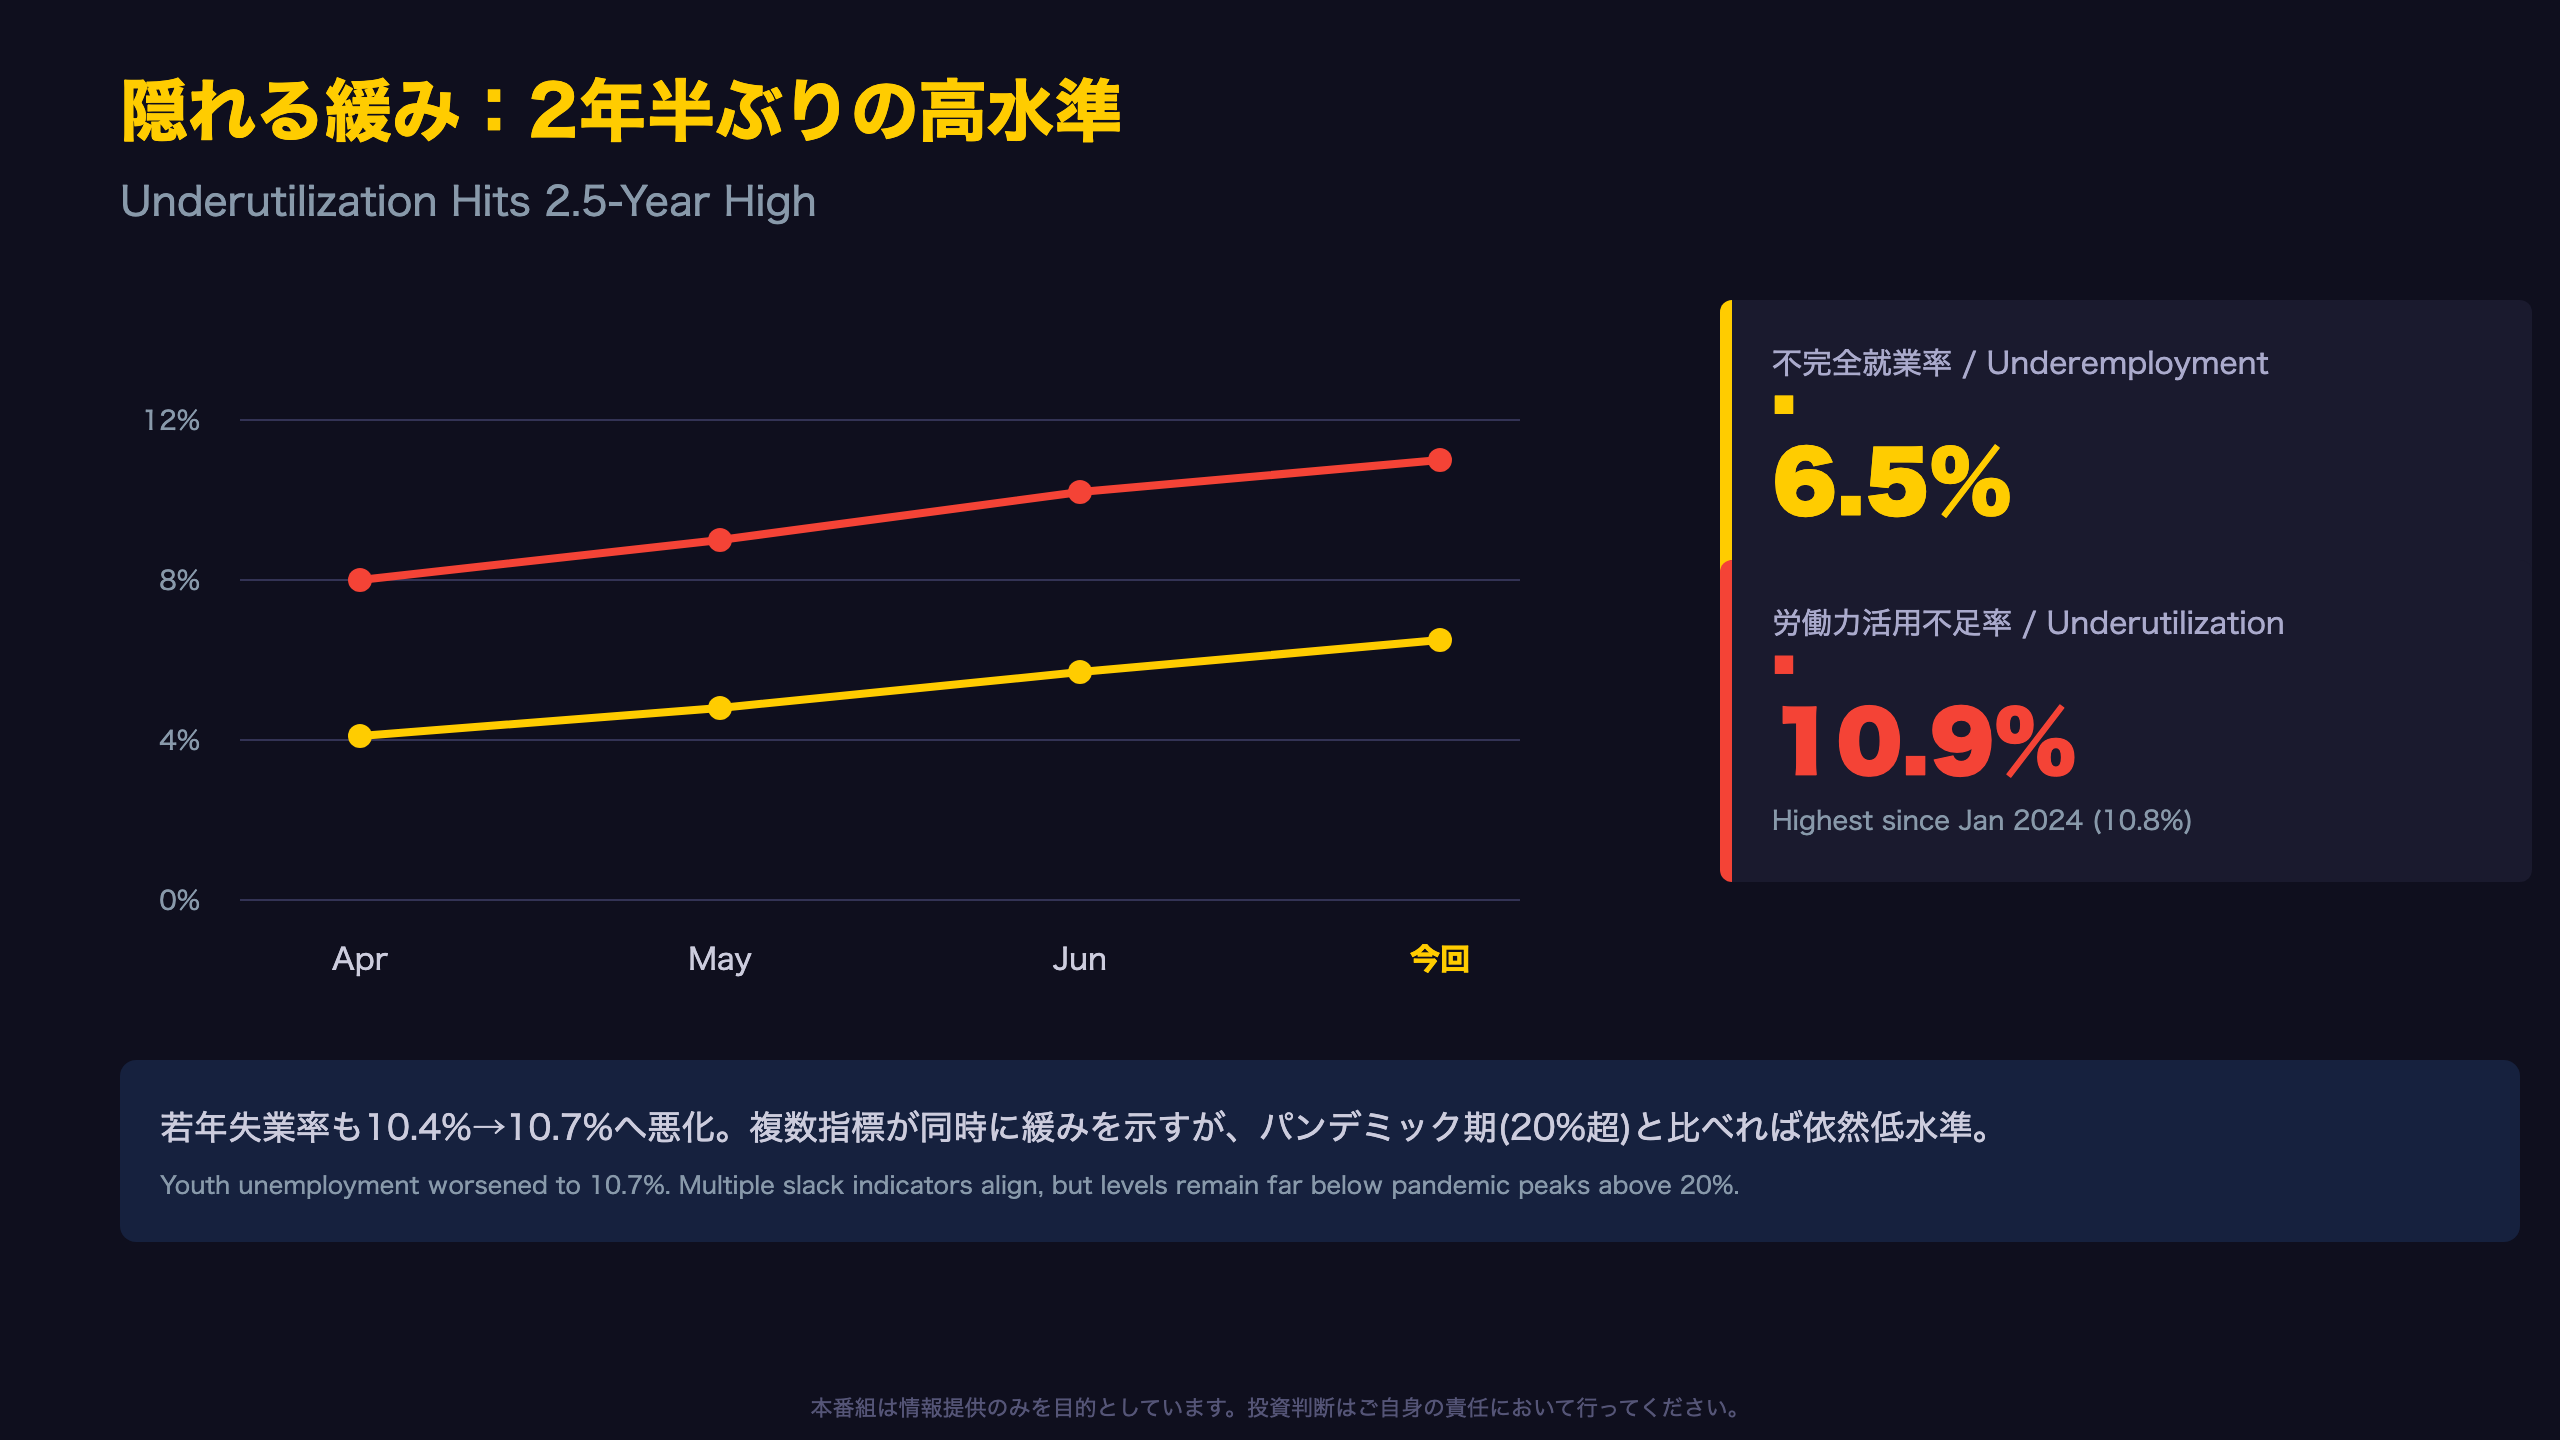
Underemployment climbed to 6.5%, and underutilization hit 10.9%—the highest since January 2024.
💡 Participation rate rose to 67.0%, arguably a sign of labor market confidence.
⚠️ We break down what this means for RBA policy and the Australian dollar (AUD), balancing strength and hidden slack.
The Ultimate Summary:強い雇用と隠れた緩み
Headline at a Glance
The Australian Bureau of Statistics (ABS) reported that seasonally adjusted employment rose by 76,300 (+0.5%) in June 2026—well above the recent monthly average—bringing annual growth to +1.7% (+252,000). The unemployment rate held at 4.4% (up 0.1ppt in unrounded terms).
The Number That Matters More
“The underemployment rate rose 0.2ppt to 6.5% and the underutilisation rate rose 0.3% to 10.9%” — per the ABS release.
An underutilization rate of 10.9% surpasses January 2024’s 10.8%, marking the highest level in roughly two and a half years. A single headline unemployment figure doesn’t capture this structural shift.
Bull Case vs. Bear Case
- Bull case: Job growth far outpaced the typical monthly run-rate (roughly 20,000-40,000), and the participation rate climbed to 67.0%, reflecting rising labor market confidence.
- Bear case: The quality of new jobs (full-time share, hours worked) hasn’t kept pace, and multiple slack indicators are deteriorating simultaneously.
These two views aren’t contradictory—quantity expansion and quality softening are occurring at the same time, which is the essence of this release. For US/European investors: Australia’s unemployment rate (4.4%) remains comparable to pre-pandemic norms (~5%), unlike the US where sub-4% has been the recent benchmark—context that matters when comparing RBA and Fed reaction functions.
Looking Ahead
The next release lands August 20, 2026 (July data). Watch whether the underemployment uptrend extends to a fourth consecutive month.
雇用の内訳:パートタイム主導の増加と労働時間の乖離
Part-Time Led the Charge
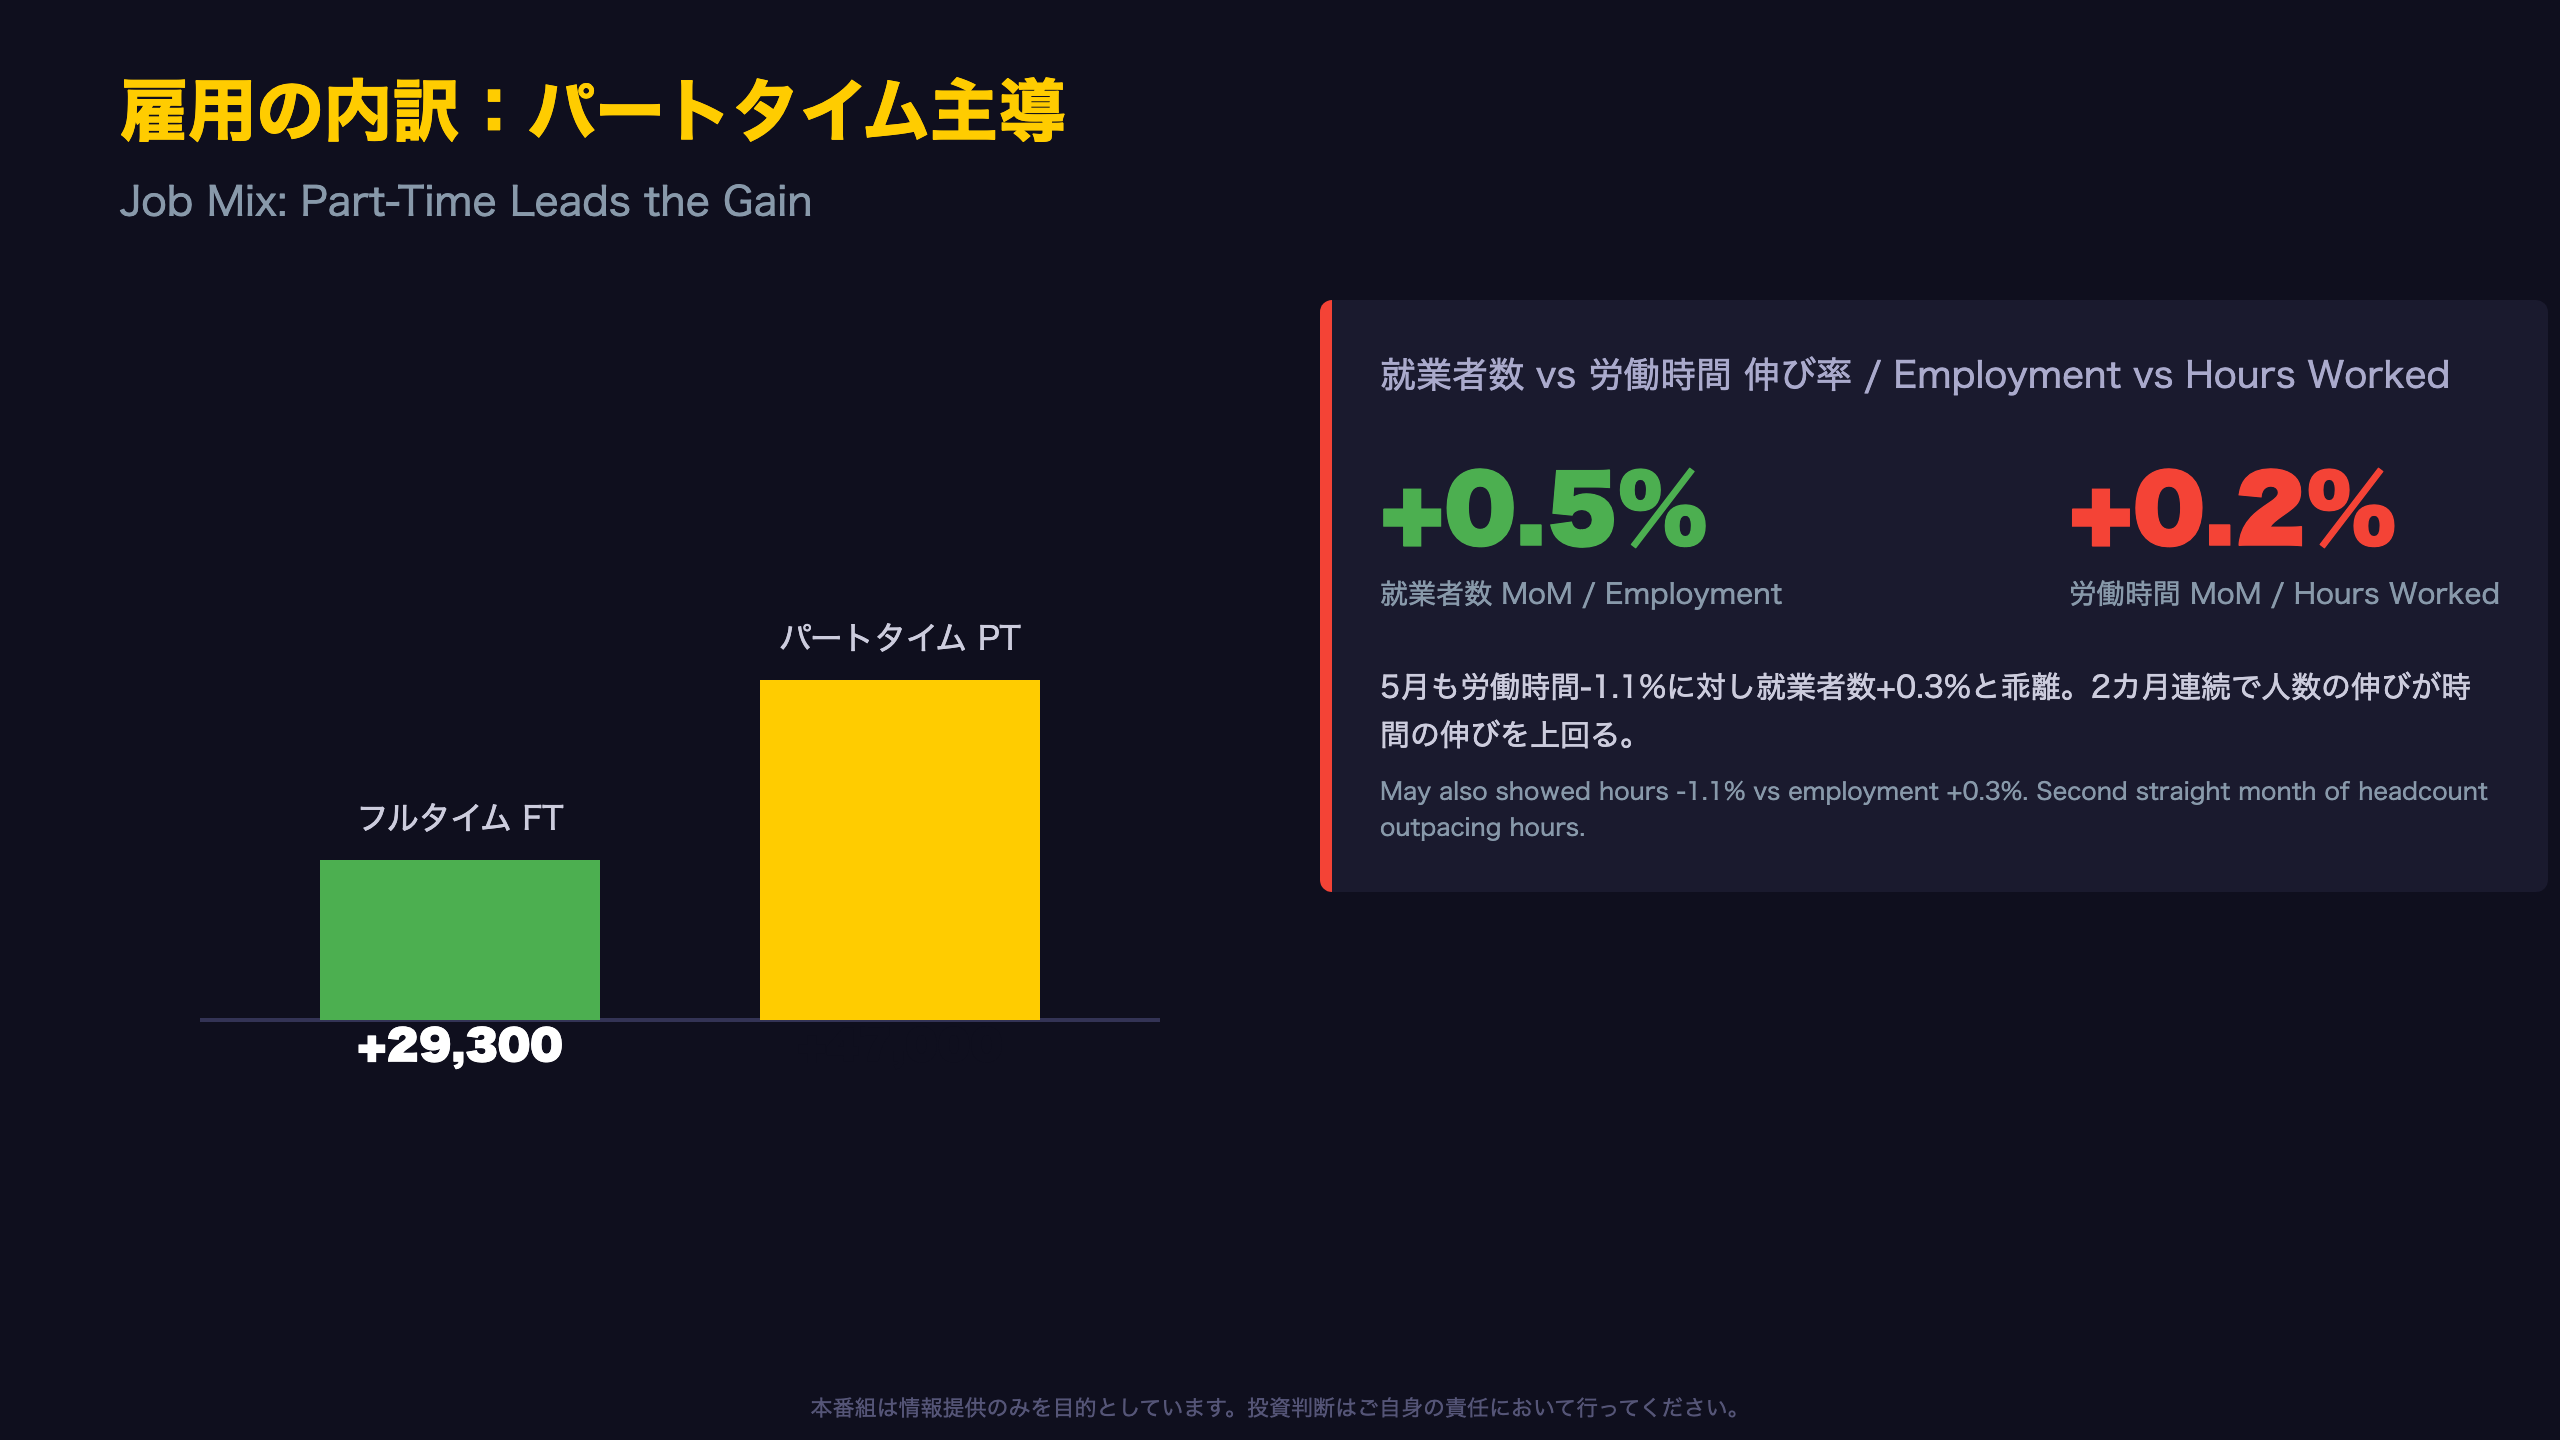
Of June’s 76,300 net job gain, full-time employment rose 29,300 to 10,173,500, while part-time employment rose 47,000 to 4,649,800—meaning part-time roles accounted for roughly 61.6% of total job creation.
Context from the Prior Month
May’s release noted “full-time employment increased by 5,200… part-time employment increased by 35,200,” confirming part-time growth already dominated the prior month. June’s full-time growth improved modestly (5,200 → 29,300), but part-time growth accelerated even faster (35,200 → 47,000).
The Widening Hours Gap
Comparing the Employment and Hours Worked Index (June 2022 = 100), June 2026 showed the employment index at 109.1 versus the hours-worked index at 108.6—a 0.5-point gap. In May the gap was just 0.2 points (108.6 vs 108.4), meaning the divergence between headcount and hours has slightly widened.
“Monthly hours worked in all jobs increased by 4.9 million hours… which was weaker than the 0.5% rise in employment” — ABS release.
For International Readers
This pattern echoes debates in the US labor market around the “quality vs. quantity” of payroll gains (e.g., part-time-for-economic-reasons metrics in the BLS Household Survey). Unlike the US nonfarm payrolls report, Australia’s Labour Force Survey breaks out full-time/part-time hours explicitly each month, giving a clearer read on underlying labor demand composition.
An Alternative Read
Rising part-time share isn’t necessarily bearish—it may reflect workers’ own preferences for flexible arrangements (childcare, caregiving, semi-retirement) rather than employer-driven underemployment. The next data point (July, releasing August 20) will show whether full-time growth can regain momentum.
不完全就業と労働力活用不足:2年半ぶりの高水準
A Three-Month Deterioration Trend
Seasonally adjusted underemployment has risen for three consecutive months: 5.9% in April, 6.3% in May, and 6.5% in June 2026. Versus June 2025’s 5.9%, that’s a 0.6ppt year-over-year deterioration.
The ABS ‘u-series’ Framework
In February 2026, the ABS introduced its “u-series”—a composite framework combining unemployment and underemployment to capture labor market slack that the headline unemployment rate alone cannot reveal. This release is a case study in why that framework matters: the unemployment rate held flat at 4.4% while underlying slack measures deteriorated markedly.
Historical Context for the Underutilization Rate
During the tight labor market of 2022, underutilization fell to around 9.5%. It briefly spiked to 10.8% in January 2024, then improved to roughly 9.9-10.0% by mid-2025. Since early 2026 it has resumed climbing: 10.2% (Feb) → 10.3% (Mar) → 10.4% (Apr) → 10.7% (May) → 10.9% (Jun)—five consecutive months of increase.
Youth Labor Market Impact
“The youth unemployment rate increased by 0.3ppt to 10.7%” — per the ABS release.
Rising youth unemployment could suggest new labor market entrants are being absorbed more slowly, though a single month of data cannot confirm a structural shift (Level C inference).
International Comparison
For US-based readers: Australia’s “underutilization rate” is broadly analogous to the U-6 measure published by the U.S. Bureau of Labor Statistics, which also captures underemployed and marginally attached workers beyond the headline U-3 unemployment rate. The current 10.9% level, while elevated for Australia’s recent history, remains well below pandemic-era peaks above 20%—this is gradual normalization from an unusually tight labor market, not a collapse.
What to Watch Next
The July release (August 20) will be pivotal in determining whether this slack build-up is temporary or structural.
労働参加率の急上昇:強さと失業率高止まりの両面
The Double-Edged Nature of Rising Participation
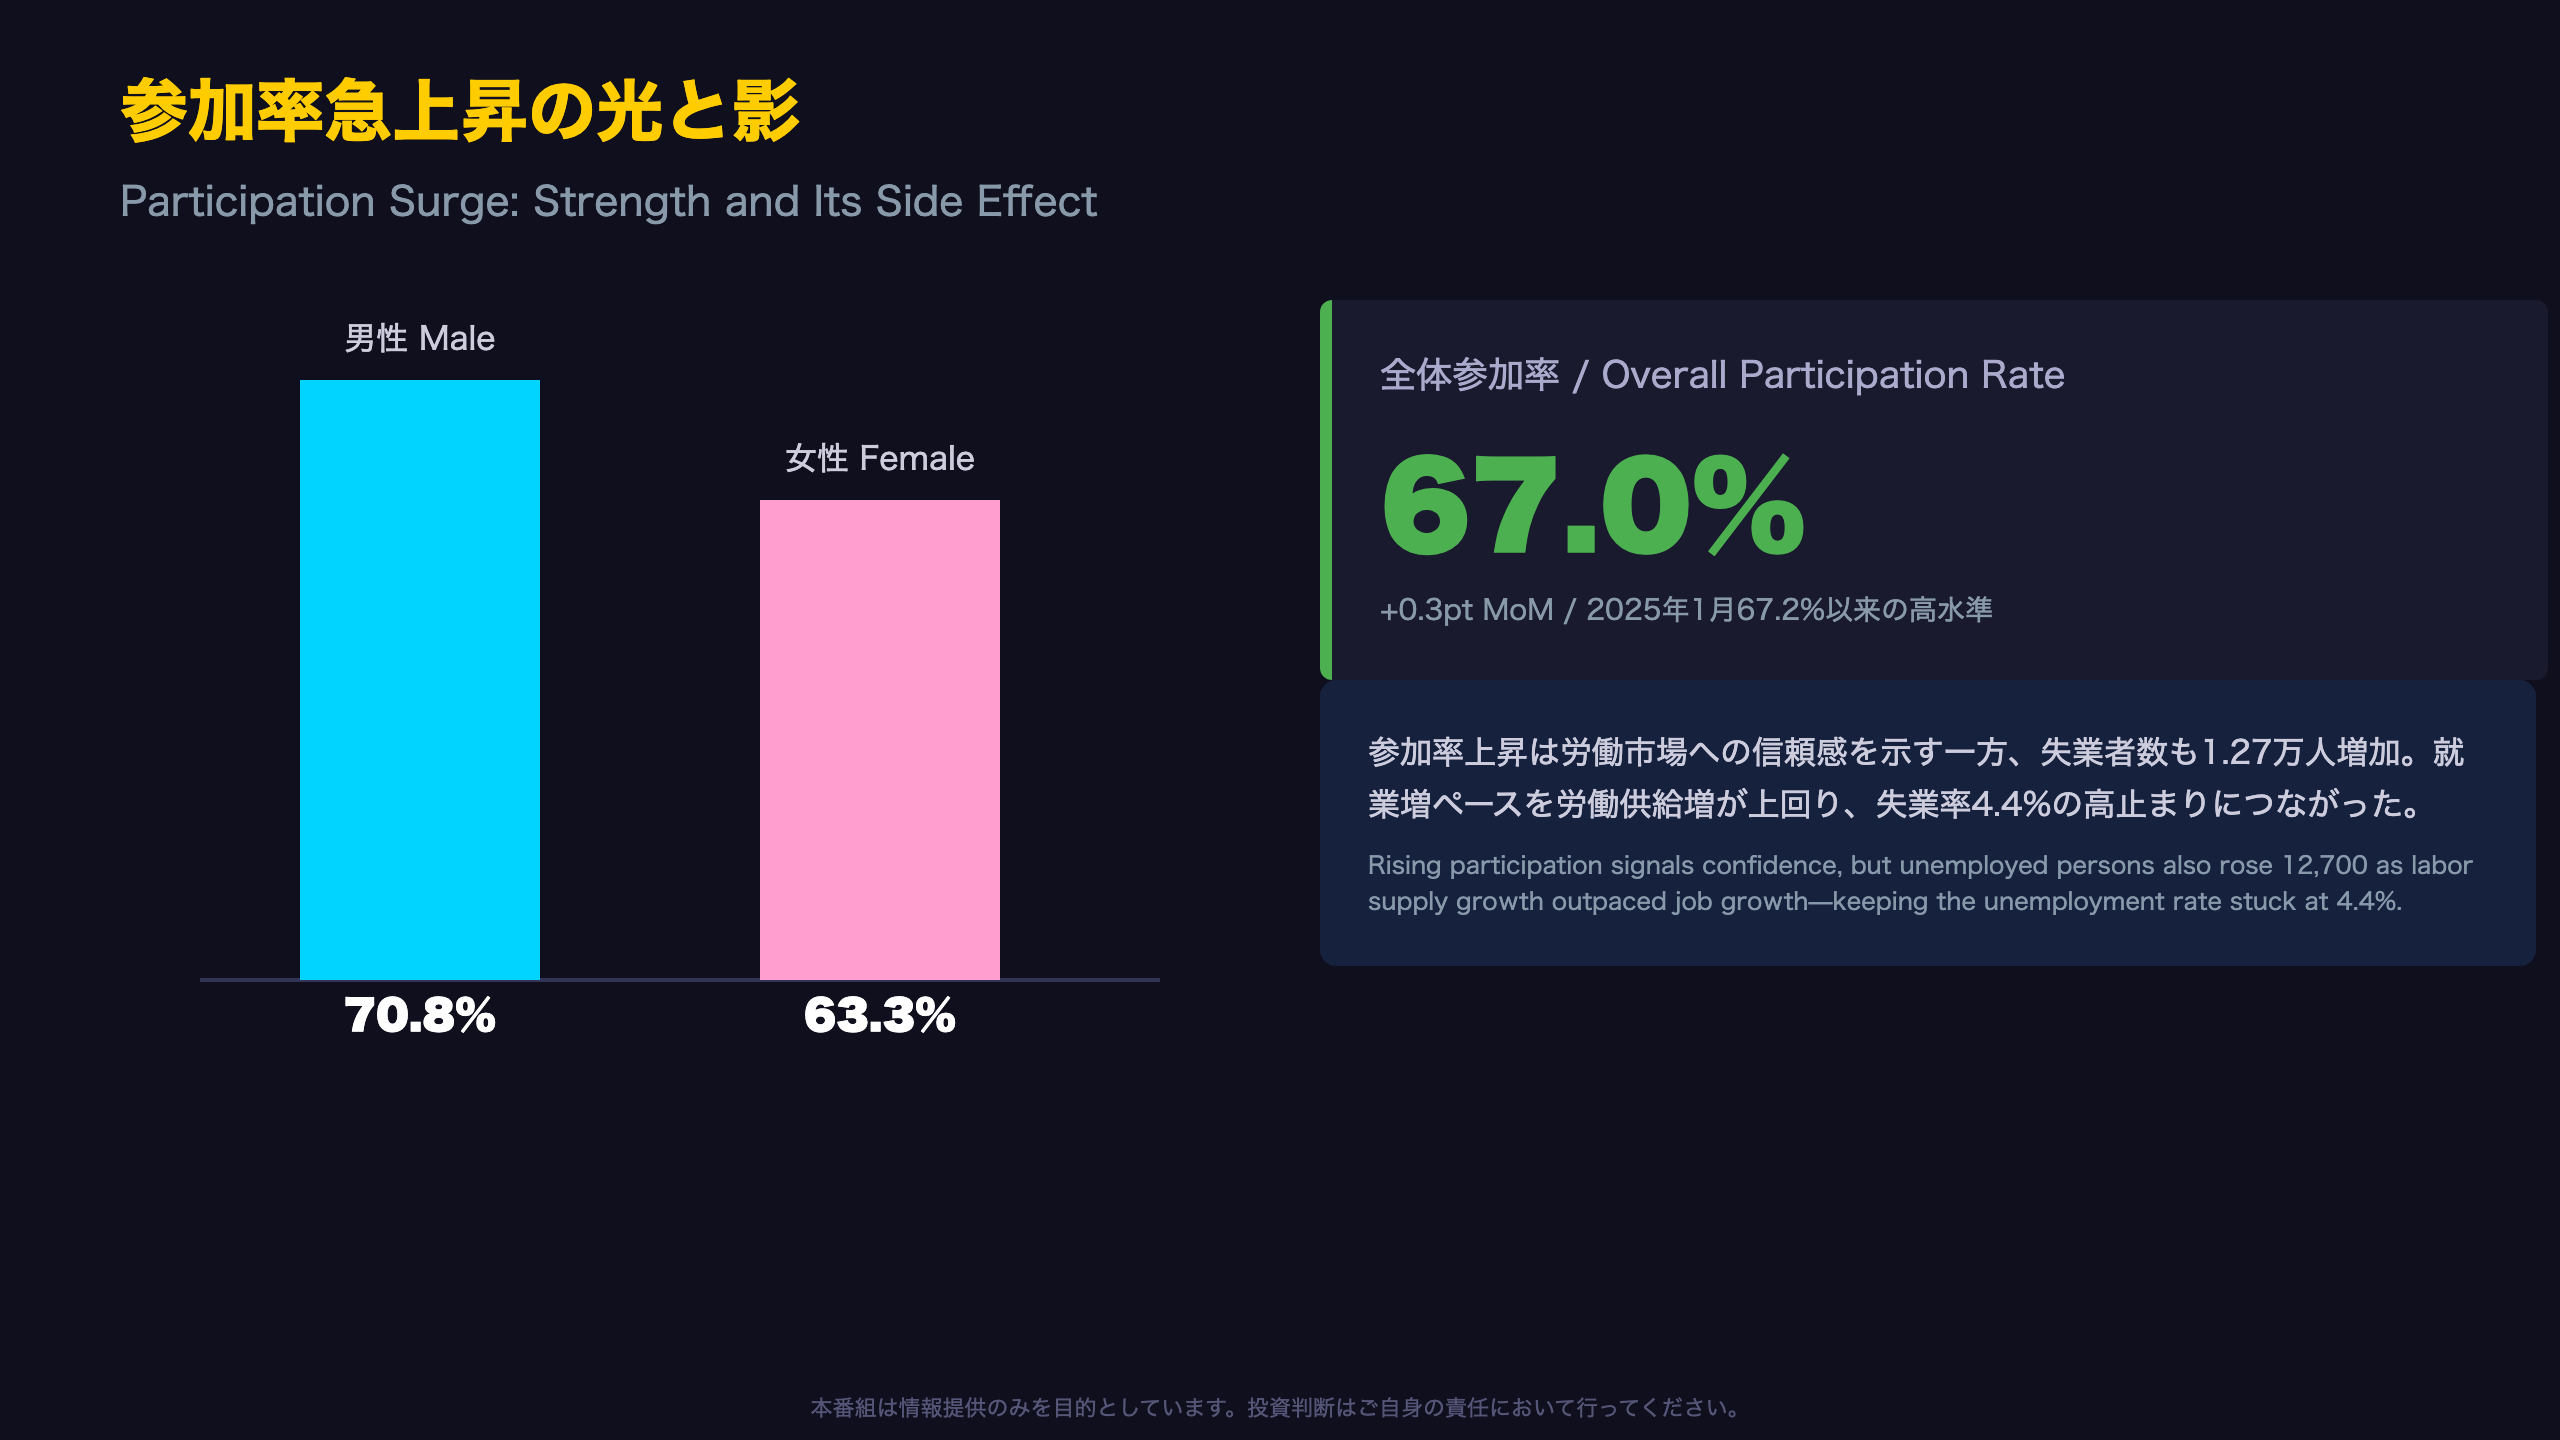
The seasonally adjusted participation rate rose 0.3ppt to 67.0%. By gender, male participation rose to 70.8% (+0.2ppt) and female participation rose to 63.3% (+0.4ppt)—both increasing.
Historical Context
The recent peak was 67.2% in January 2025, making June’s 67.0% the second-highest reading in that stretch. Since late 2022, participation has generally ranged between 66.3% and 67.2%, with June sitting near the top of that range.
Why Unemployment Isn’t Falling Despite Strong Job Growth
While employment rose 76,300, unemployed persons also rose by 12,700 to 686,800. Normally, if employment growth outpaces labor force growth, the unemployment rate falls. But because participation surged, the labor force itself grew substantially, offsetting the improvement that job growth alone would have delivered.
“The participation rate rose 0.3ppt to 67.0%… rose by 0.2ppt to 70.8% for males and rose by 0.4ppt to 63.3% for females” — per the ABS release.
For International Readers: A Different Dynamic Than the US
Unlike the U.S. labor force participation rate, which has been on a long secular decline since the early 2000s due to demographic aging, Australia’s rate has been on a rising, near-record trajectory since 2022—a structurally different dynamic worth noting when comparing RBA and Fed policy contexts.
Two Interpretations
The bullish read: rising participation signals “discouraged workers” re-entering the labor force, reflecting household confidence in the economic outlook. The bearish read: it could reflect cost-of-living pressures forcing more household members (or second earners) into the workforce out of necessity rather than optimism—a less benign explanation.
What to Watch
Whether July’s data (releasing August 20) sustains or reverses the 67.0% participation level will clarify whether this is a one-off fluctuation or a structural trend.
データの質と地域差、そしてRBAへの含意
A Data Quality Caveat Worth Noting
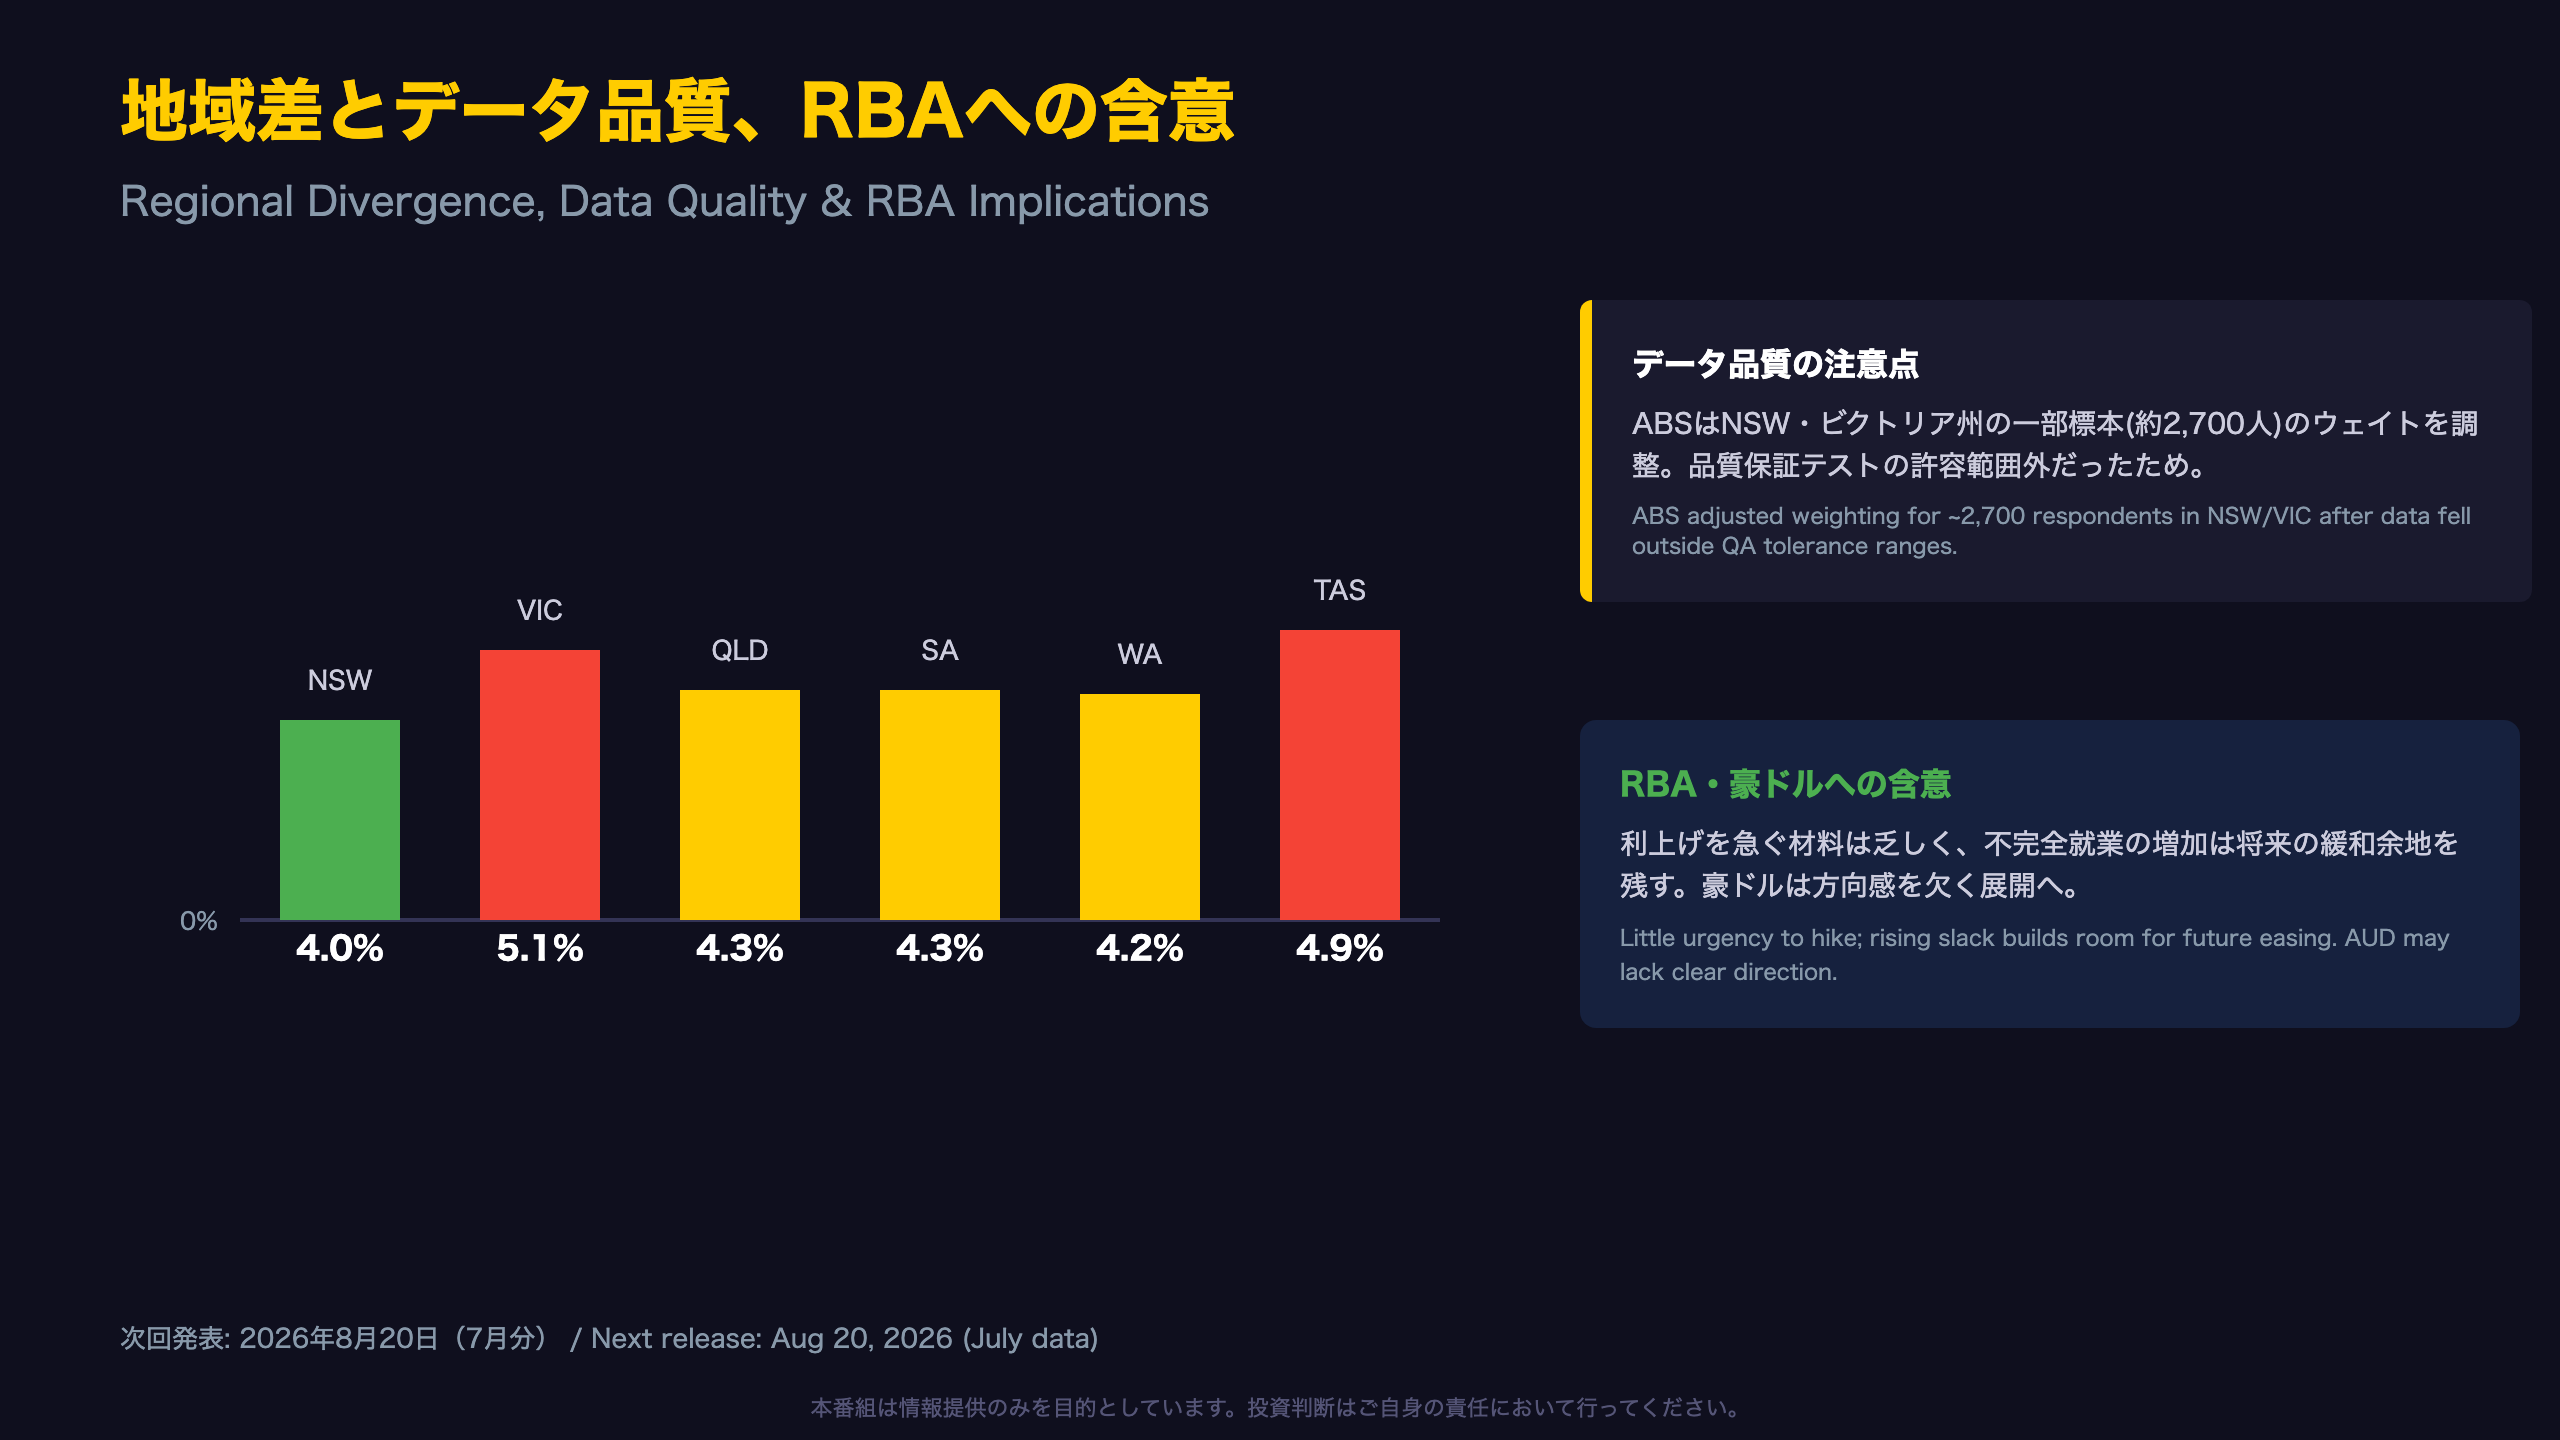
The ABS disclosed in this release that it “adjusted the influence of around 2,700 respondents (approximately 6% of the June sample)” in New South Wales and Victoria, because their labor force characteristics deviated significantly from the rest of the sample. This is part of the ongoing quality assurance process during the ABS’s Labour Force Survey Modernisation transition, which began affecting the data collection methodology earlier in 2026.
“These differences were outside the tolerance ranges of several of our quality assurance tests” — per the ABS release.
Regional Divergence
Among states, Western Australia (+1.0%) and Tasmania (+1.2%) posted the strongest employment growth, while Victoria’s unemployment rate worsened to 5.1% from 4.9% (+0.2ppt). New South Wales—also flagged for the weighting adjustment—showed a somewhat different picture: employment rose a strong 0.9% while its unemployment rate improved to 4.0% from 4.3% (-0.3ppt).
Implications for the RBA and AUD
With unemployment holding at a historically low 4.4%, the Reserve Bank of Australia (RBA)—Australia’s central bank, akin to the Federal Reserve or ECB—faces no immediate pressure to shift policy hawkishly. At the same time, the deteriorating underemployment and underutilization trends quietly build the case for future policy easing. For currency markets, the Australian dollar (AUD) may lack a clear directional catalyst in the near term and could trade within a range pending clearer signals.
For International Readers: Data Integrity Context
Unlike the U.S. Bureau of Labor Statistics’ nonfarm payrolls, which relies on a large establishment survey with relatively stable methodology, Australia’s Labour Force Survey is mid-transition to a modernized collection system—introducing a layer of statistical noise that global macro investors should factor into confidence levels when trading AUD around these releases.
Two Interpretations
The hawkish read: a 76,300 job gain vastly exceeds the recent monthly run-rate and demonstrates underlying labor market resilience. The dovish read: quality deterioration (part-time share, hours worked, underemployment) is advancing in parallel, and the RBA should not be lulled by the surface-level strength.
Next Release and What to Watch
The next release is scheduled for August 20, 2026, covering July data. Key questions: will underemployment extend its rise to a fourth consecutive month, and will the NSW/Victoria weighting adjustments persist?
Disclaimer: This article is for informational purposes only. All investment decisions are made solely at your own risk.