This article was automatically generated by the NFC Market Live AI analysis system. (Updated: 2026-08-20 10:38 JST)
📄 Primary Source
Australian Bureau of Statistics
https://www.abs.gov.au/statistics/labour/employment-and-unemployment/labour-force-australia/latest-release
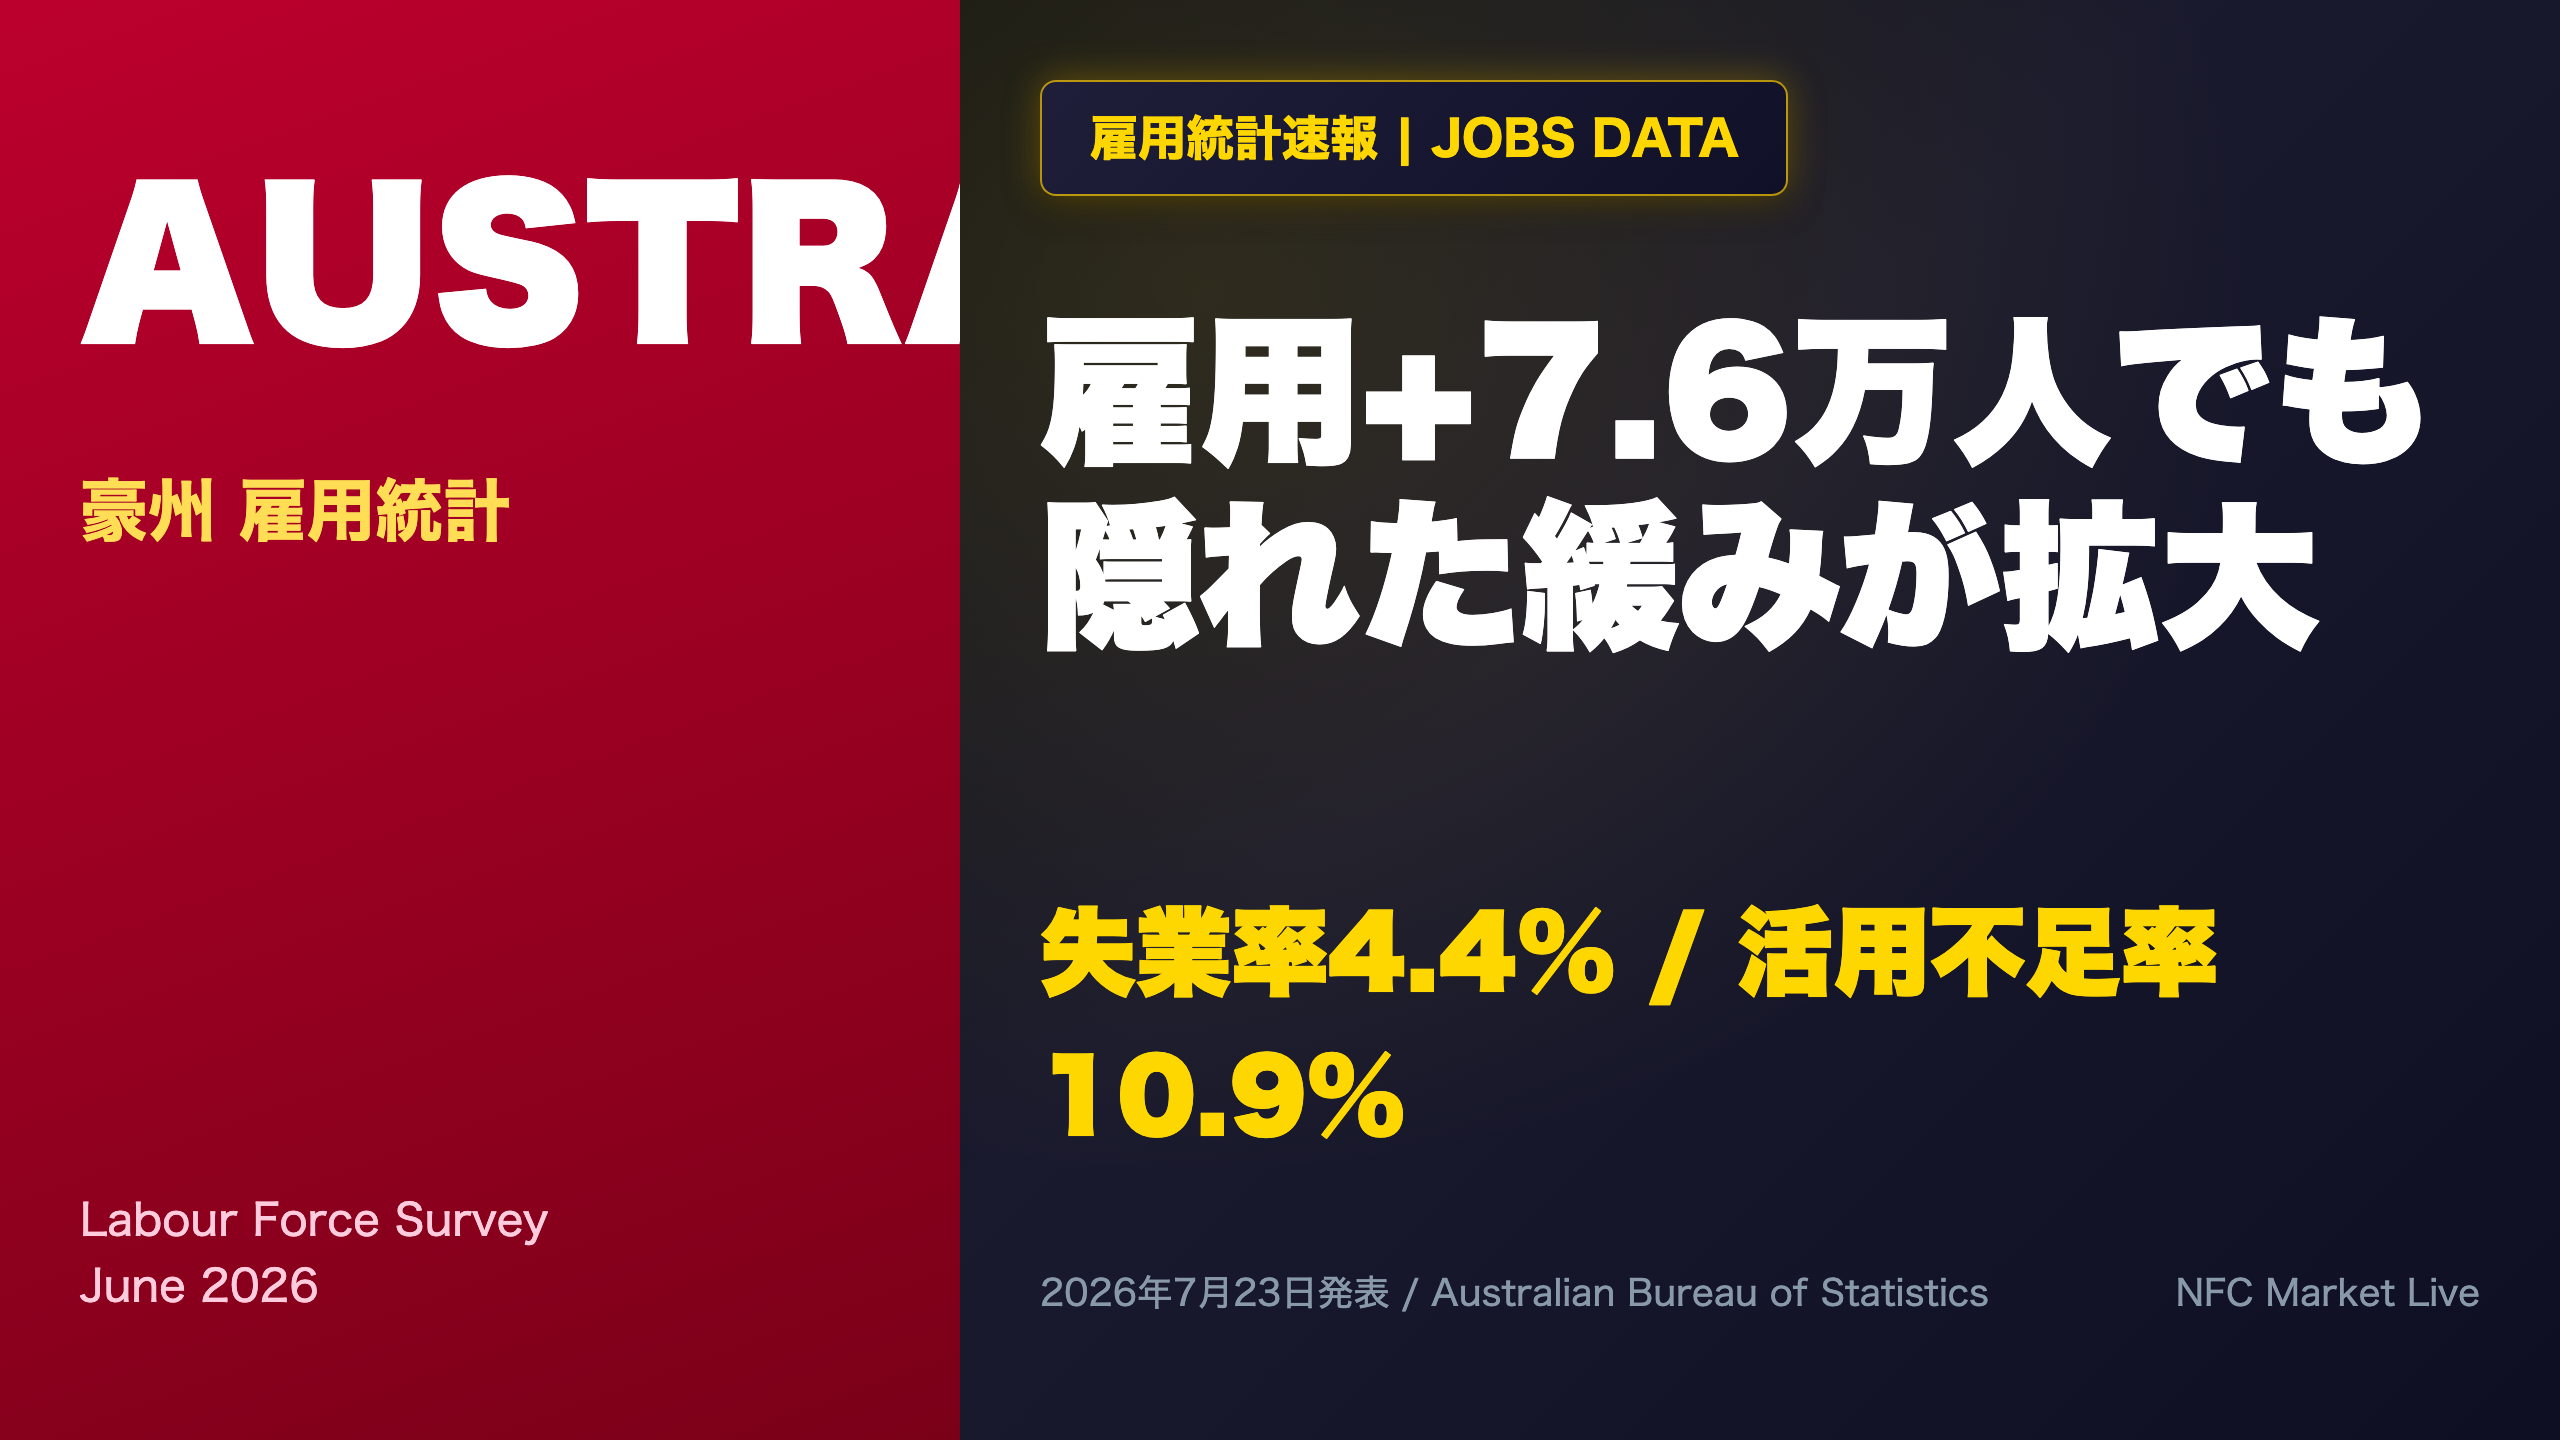
Australia’s June labour force data delivered a blockbuster headline: employment surged by 76,300, one of the largest monthly gains in the series. 📊
The unemployment rate held at 4.4%, appearing rock-solid on the surface.
But dig deeper: hours worked rose just 0.2%, and underemployment climbed to 6.5% for a third straight month. ⚠️
A surge in participation actually pushed the unemployed count higher even as jobs boomed.
The ABS itself flagged a rare data-quality caveat after reweighting rotation groups in NSW and Victoria.
We break down what this quantity-vs-quality divergence means for the RBA and the Australian dollar. 💡
The Ultimate Summary:量は絶好調、質に影
Overview of the June Jobs Report
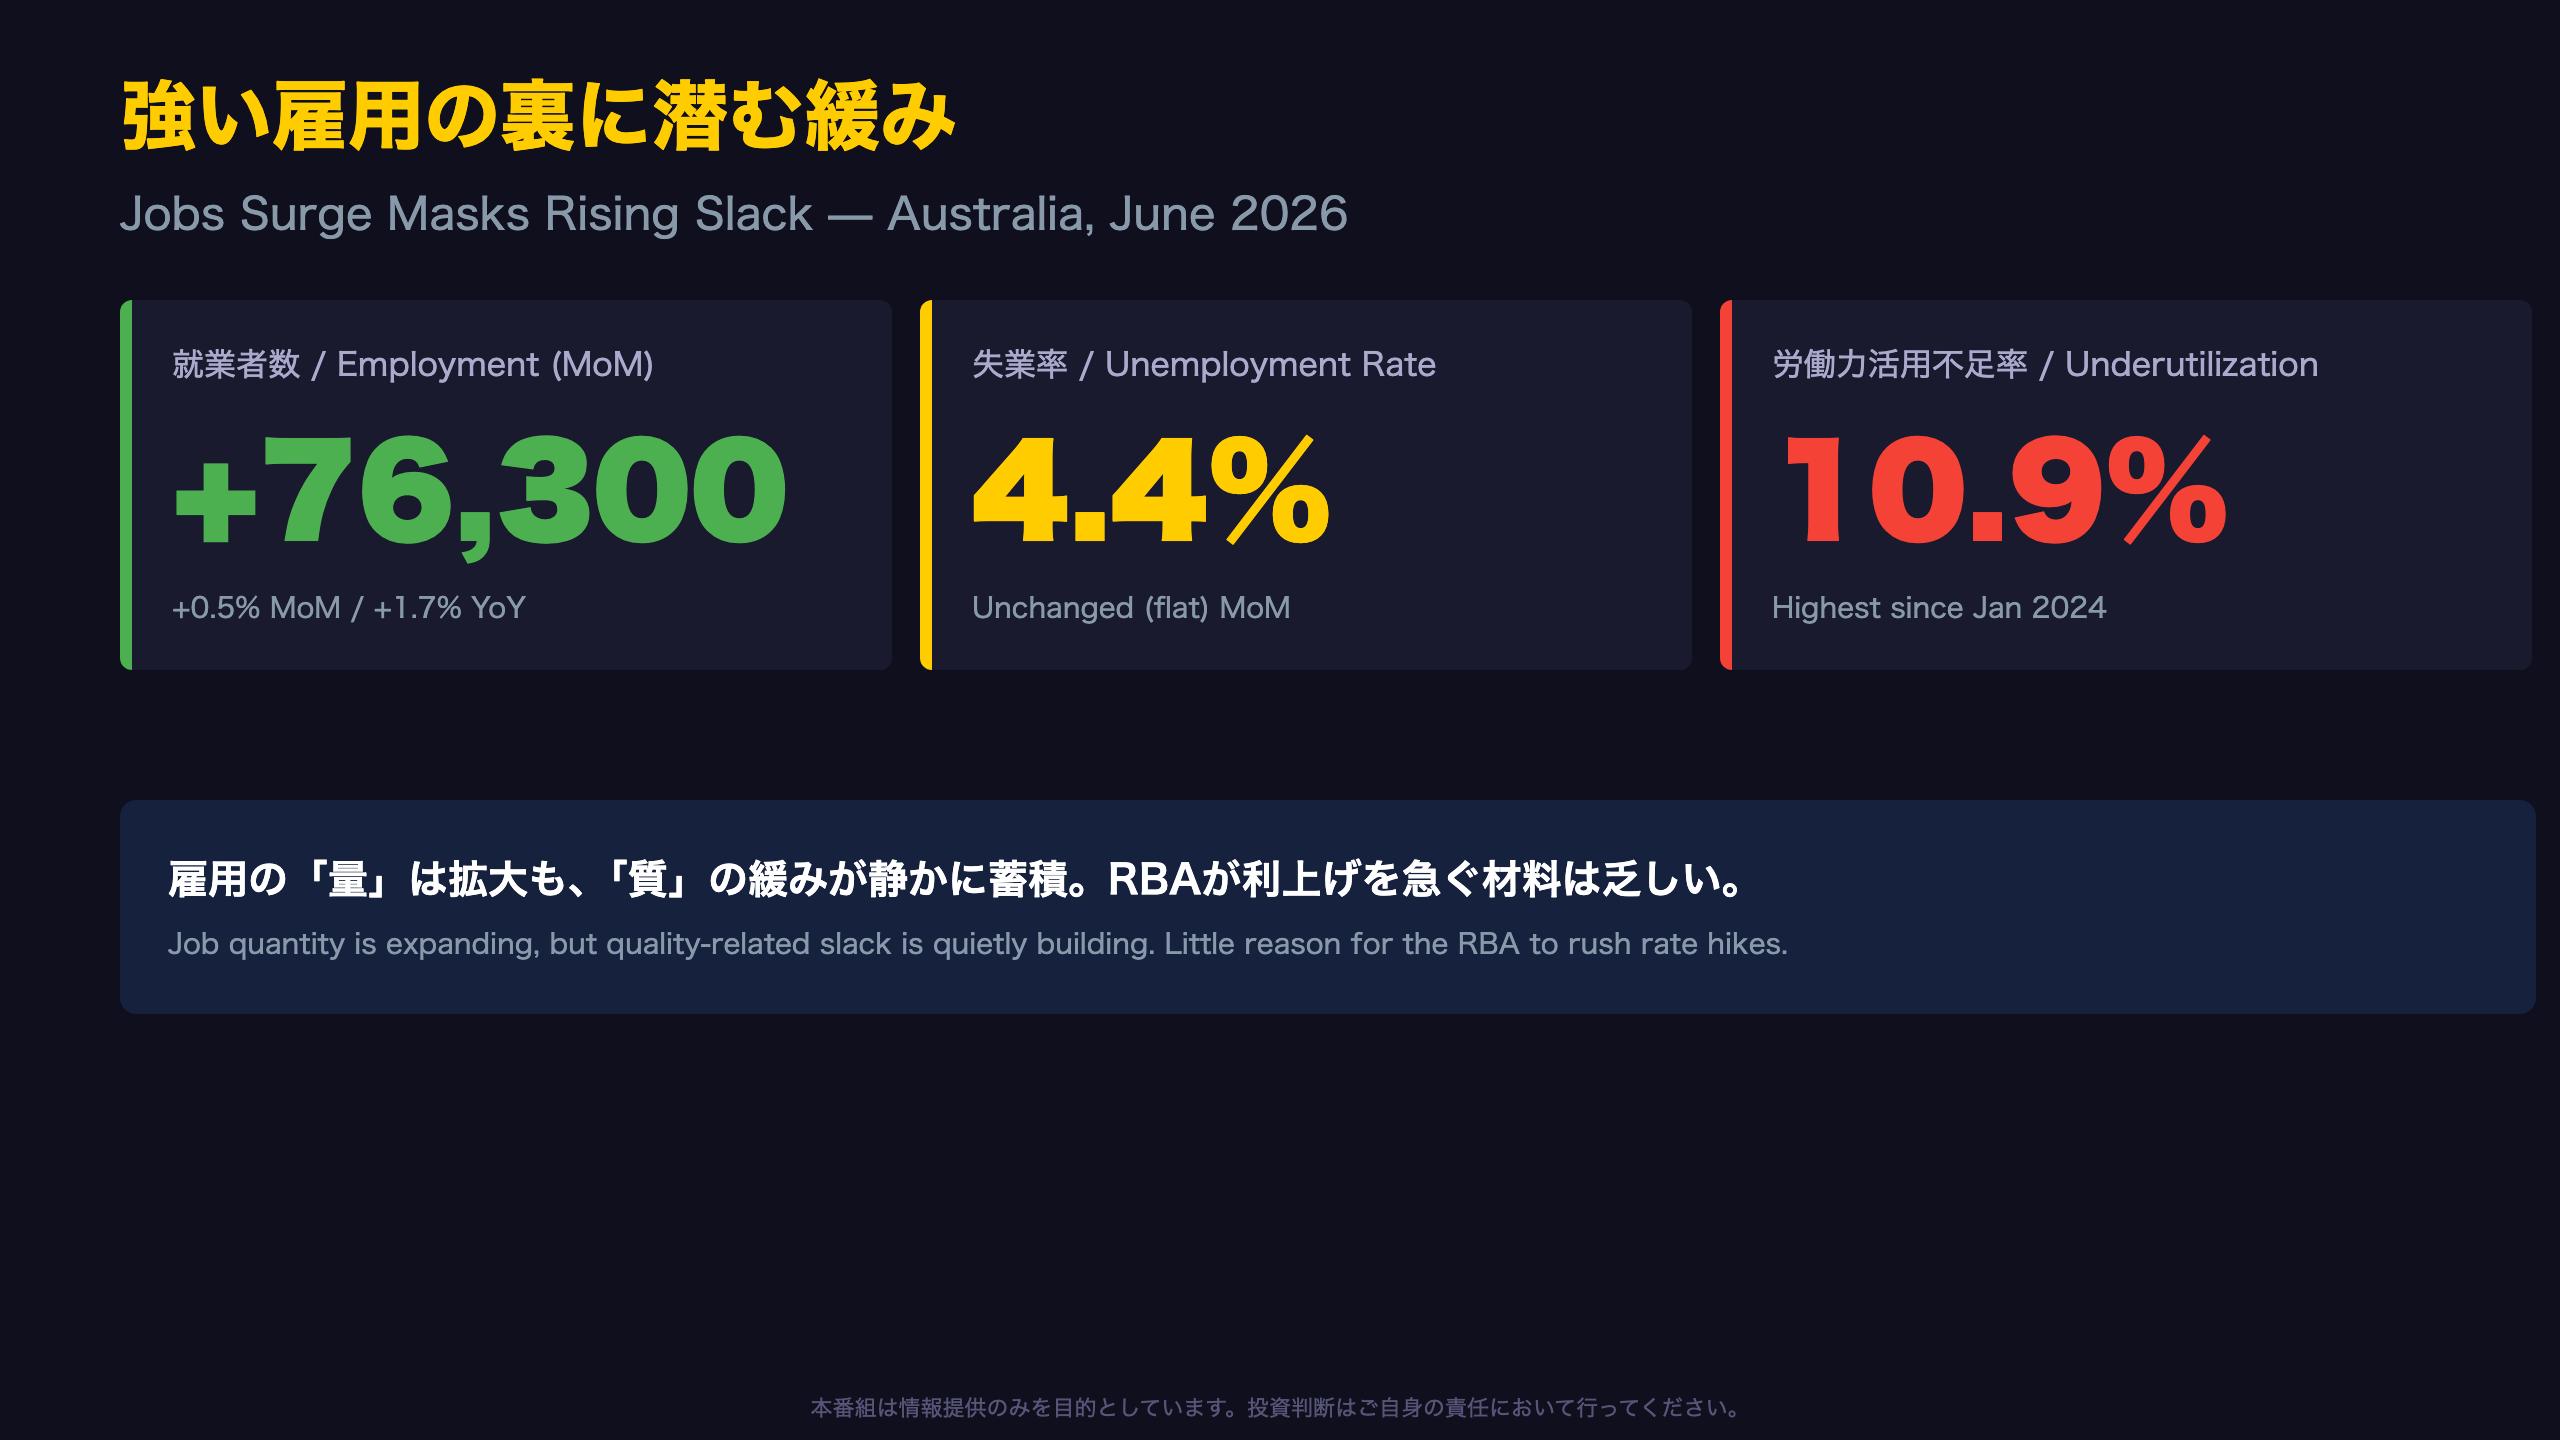
The Australian Bureau of Statistics (ABS) released its Labour Force Survey for June 2026 on July 23, showing a seasonally adjusted employment gain of +76,300 (+0.5% m/m) — one of the largest single-month increases in the recent series.
“The employment-to-population ratio increased 0.3ppt to 64.0%,” the ABS stated in its release.
Context for international readers
Unlike the U.S. nonfarm payrolls report, Australia’s Labour Force Survey samples roughly 0.32% of the population via eight rotating groups, making it more susceptible to sampling noise — a point underscored by this month’s explicit rotation-group weighting adjustment (see later slides).
Bull case vs. bear case
- Bull case: Headline jobs growth this strong, alongside a firmer employment-to-population ratio, historically reduces the odds of near-term RBA rate cuts — a moderately AUD-positive signal versus, say, the Fed’s more dovish recent guidance.
- Bear case: Hours worked grew only 0.2%, and underemployment has now risen for three consecutive months, suggesting the labour market’s quality is deteriorating even as quantity impresses.
What’s next
The July release, due August 20, 2026, will be the key test of whether this month’s blowout number reflects durable strength or partly reflects survey noise from the flagged rotation-group issue.
雇用エンジン:フルタイムが急回復
Full-Time Hiring Finally Reaccelerates
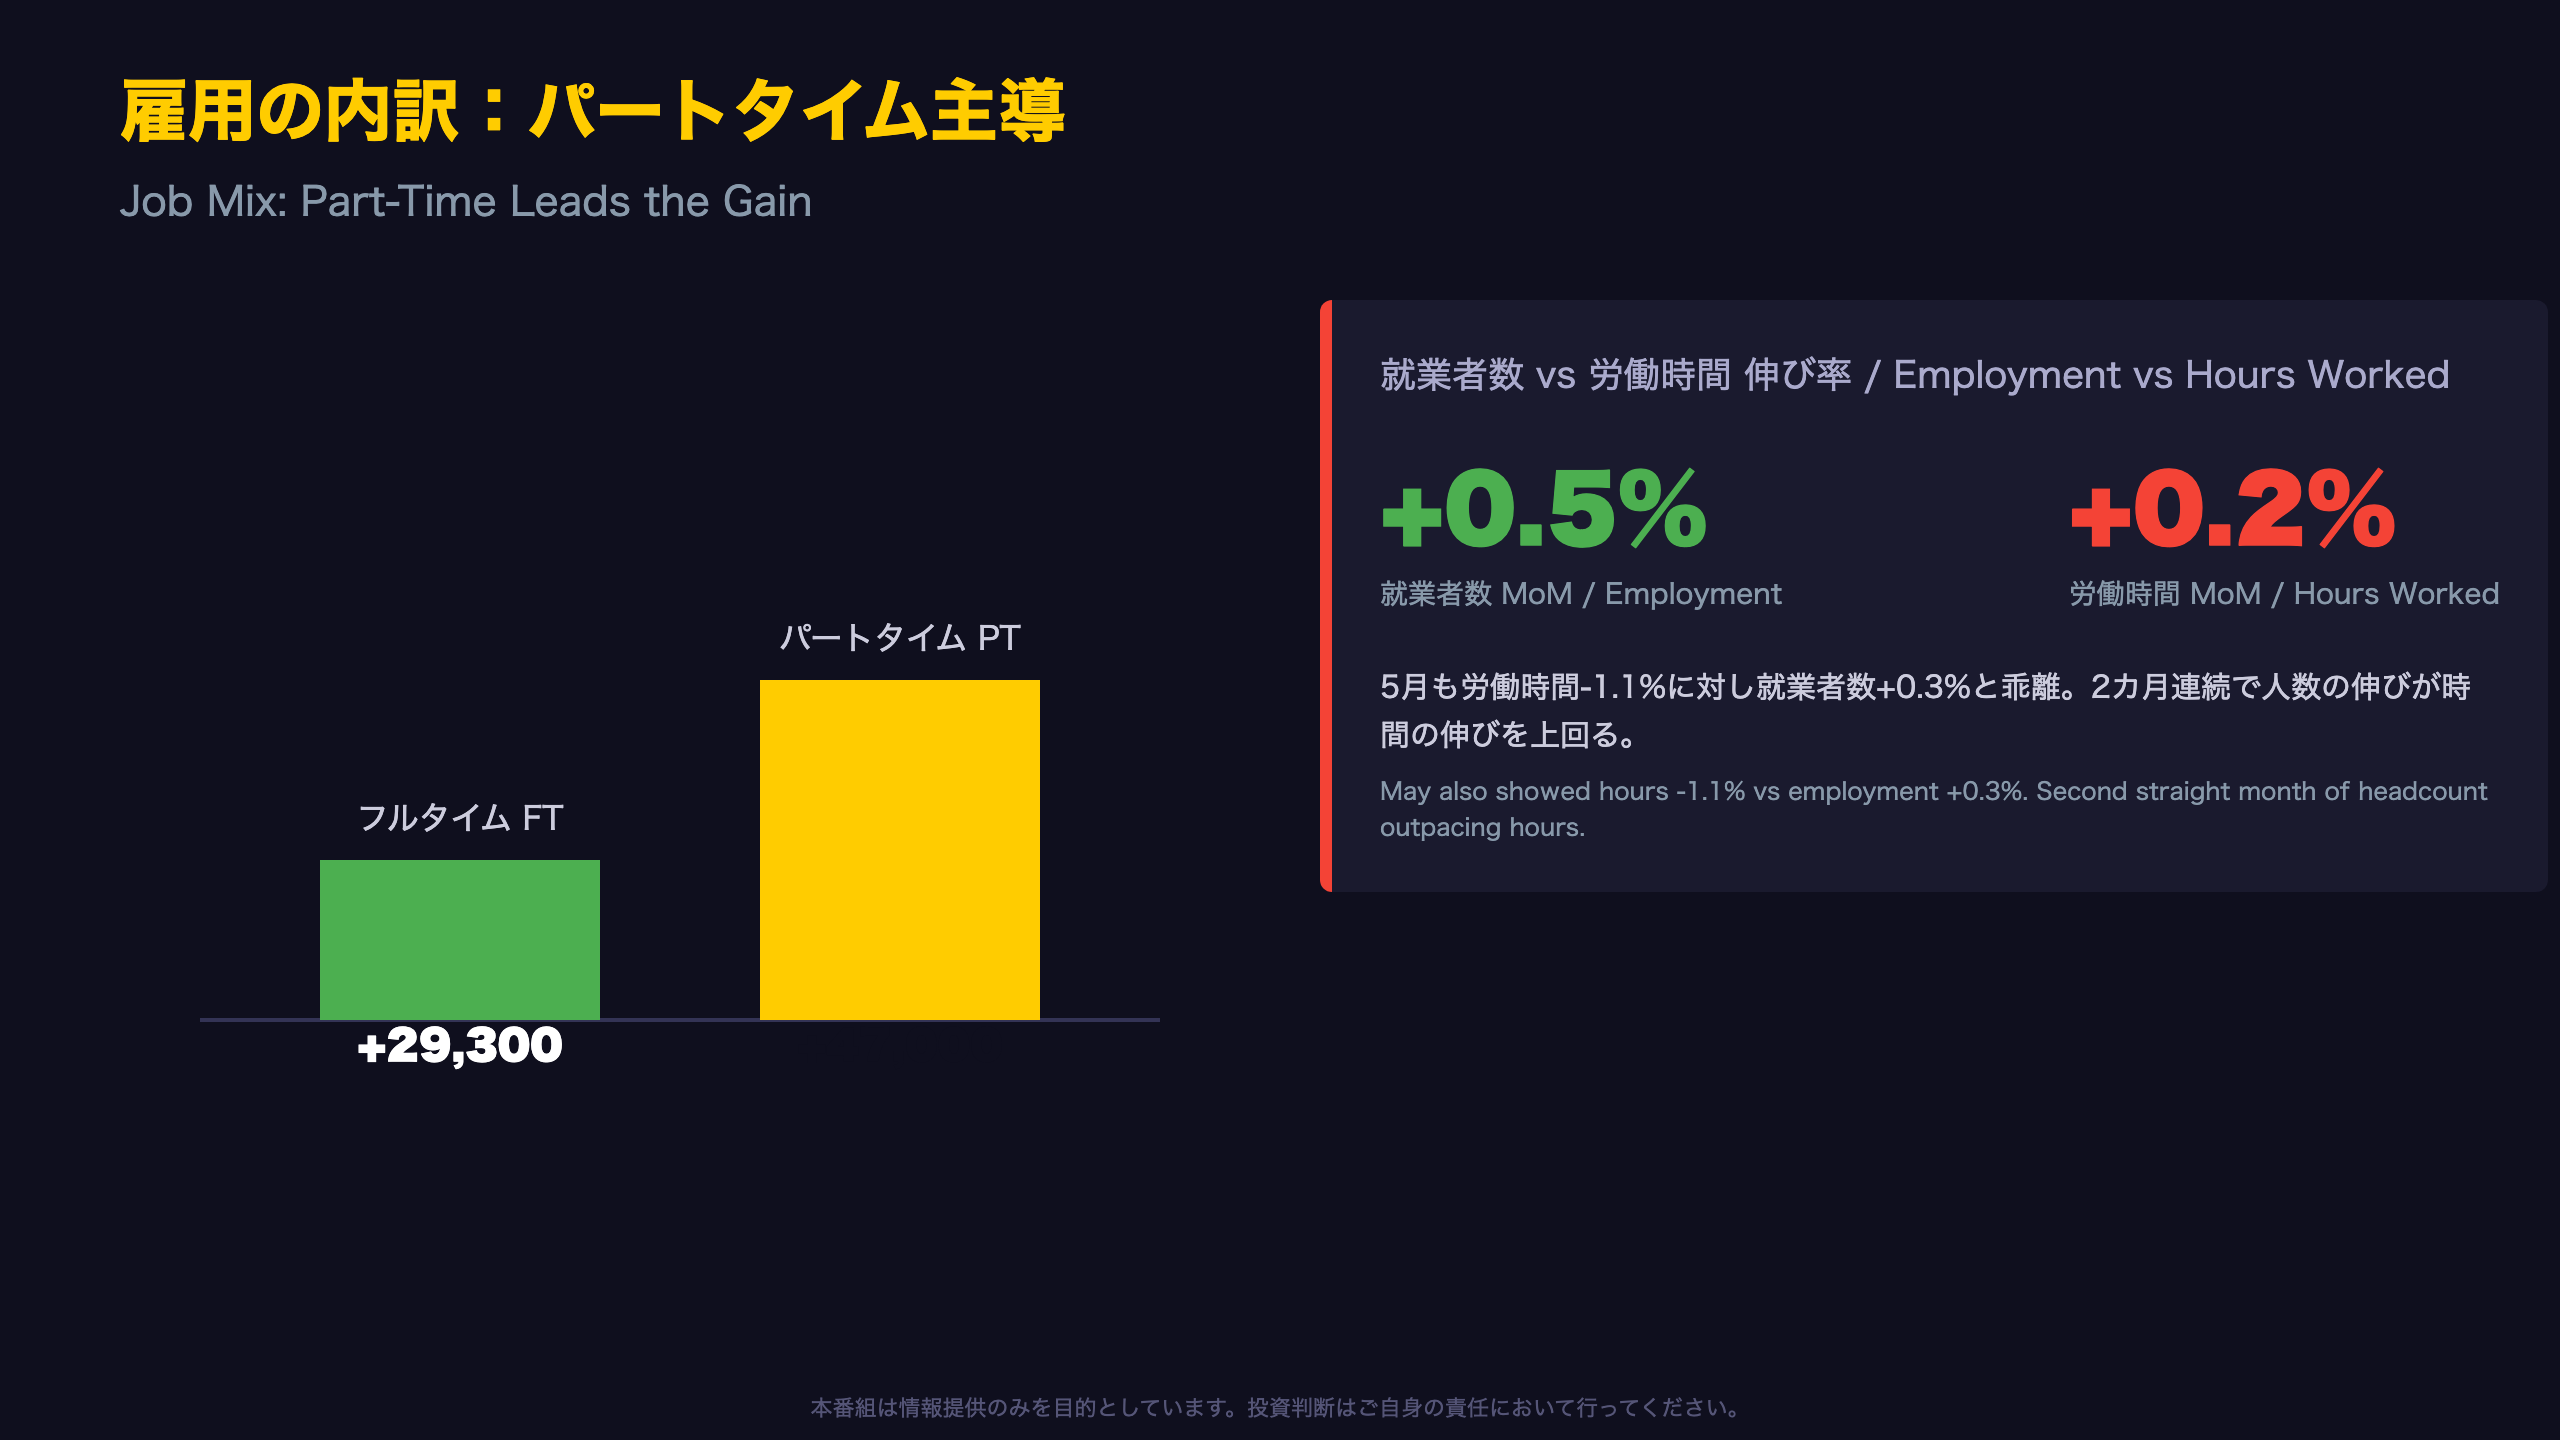
May’s data showed a sluggish full-time employment gain of just +5,200, with almost the entirety of that month’s job growth (+35,200) coming from part-time roles. June reversed that pattern meaningfully: full-time employment jumped +29,300 to 10,173,500, while part-time employment also rose a healthy +47,000 to 4,649,800.
Three-month context
Compared with the broader U.S. framework where the Bureau of Labor Statistics tracks full-time/part-time status similarly via its Current Population Survey, Australia’s ABS distinguishes full-time as those working 35+ hours per week. The month-on-month swing here — from a near-stagnant +5,200 in April/May to +29,300 in June — represents one of the sharper reaccelerations in recent quarters.
The caveat
Despite the encouraging full-time rebound, part-time jobs still accounted for roughly 62% of June’s total net job creation. The rotation-group data embedded in the ABS release shows the full-time employment-to-population ratio holding around 44.5-44.7%, essentially flat — meaning the composition of the labour market hasn’t meaningfully shifted toward more stable, full-time-dominant employment just yet. This nuance matters for wage growth and consumption forecasts, since full-time roles typically carry higher average earnings and job security than part-time positions.
失業率のパラドックス:参加率急上昇
The Paradox: Jobs Surge, Unemployment Also Rises
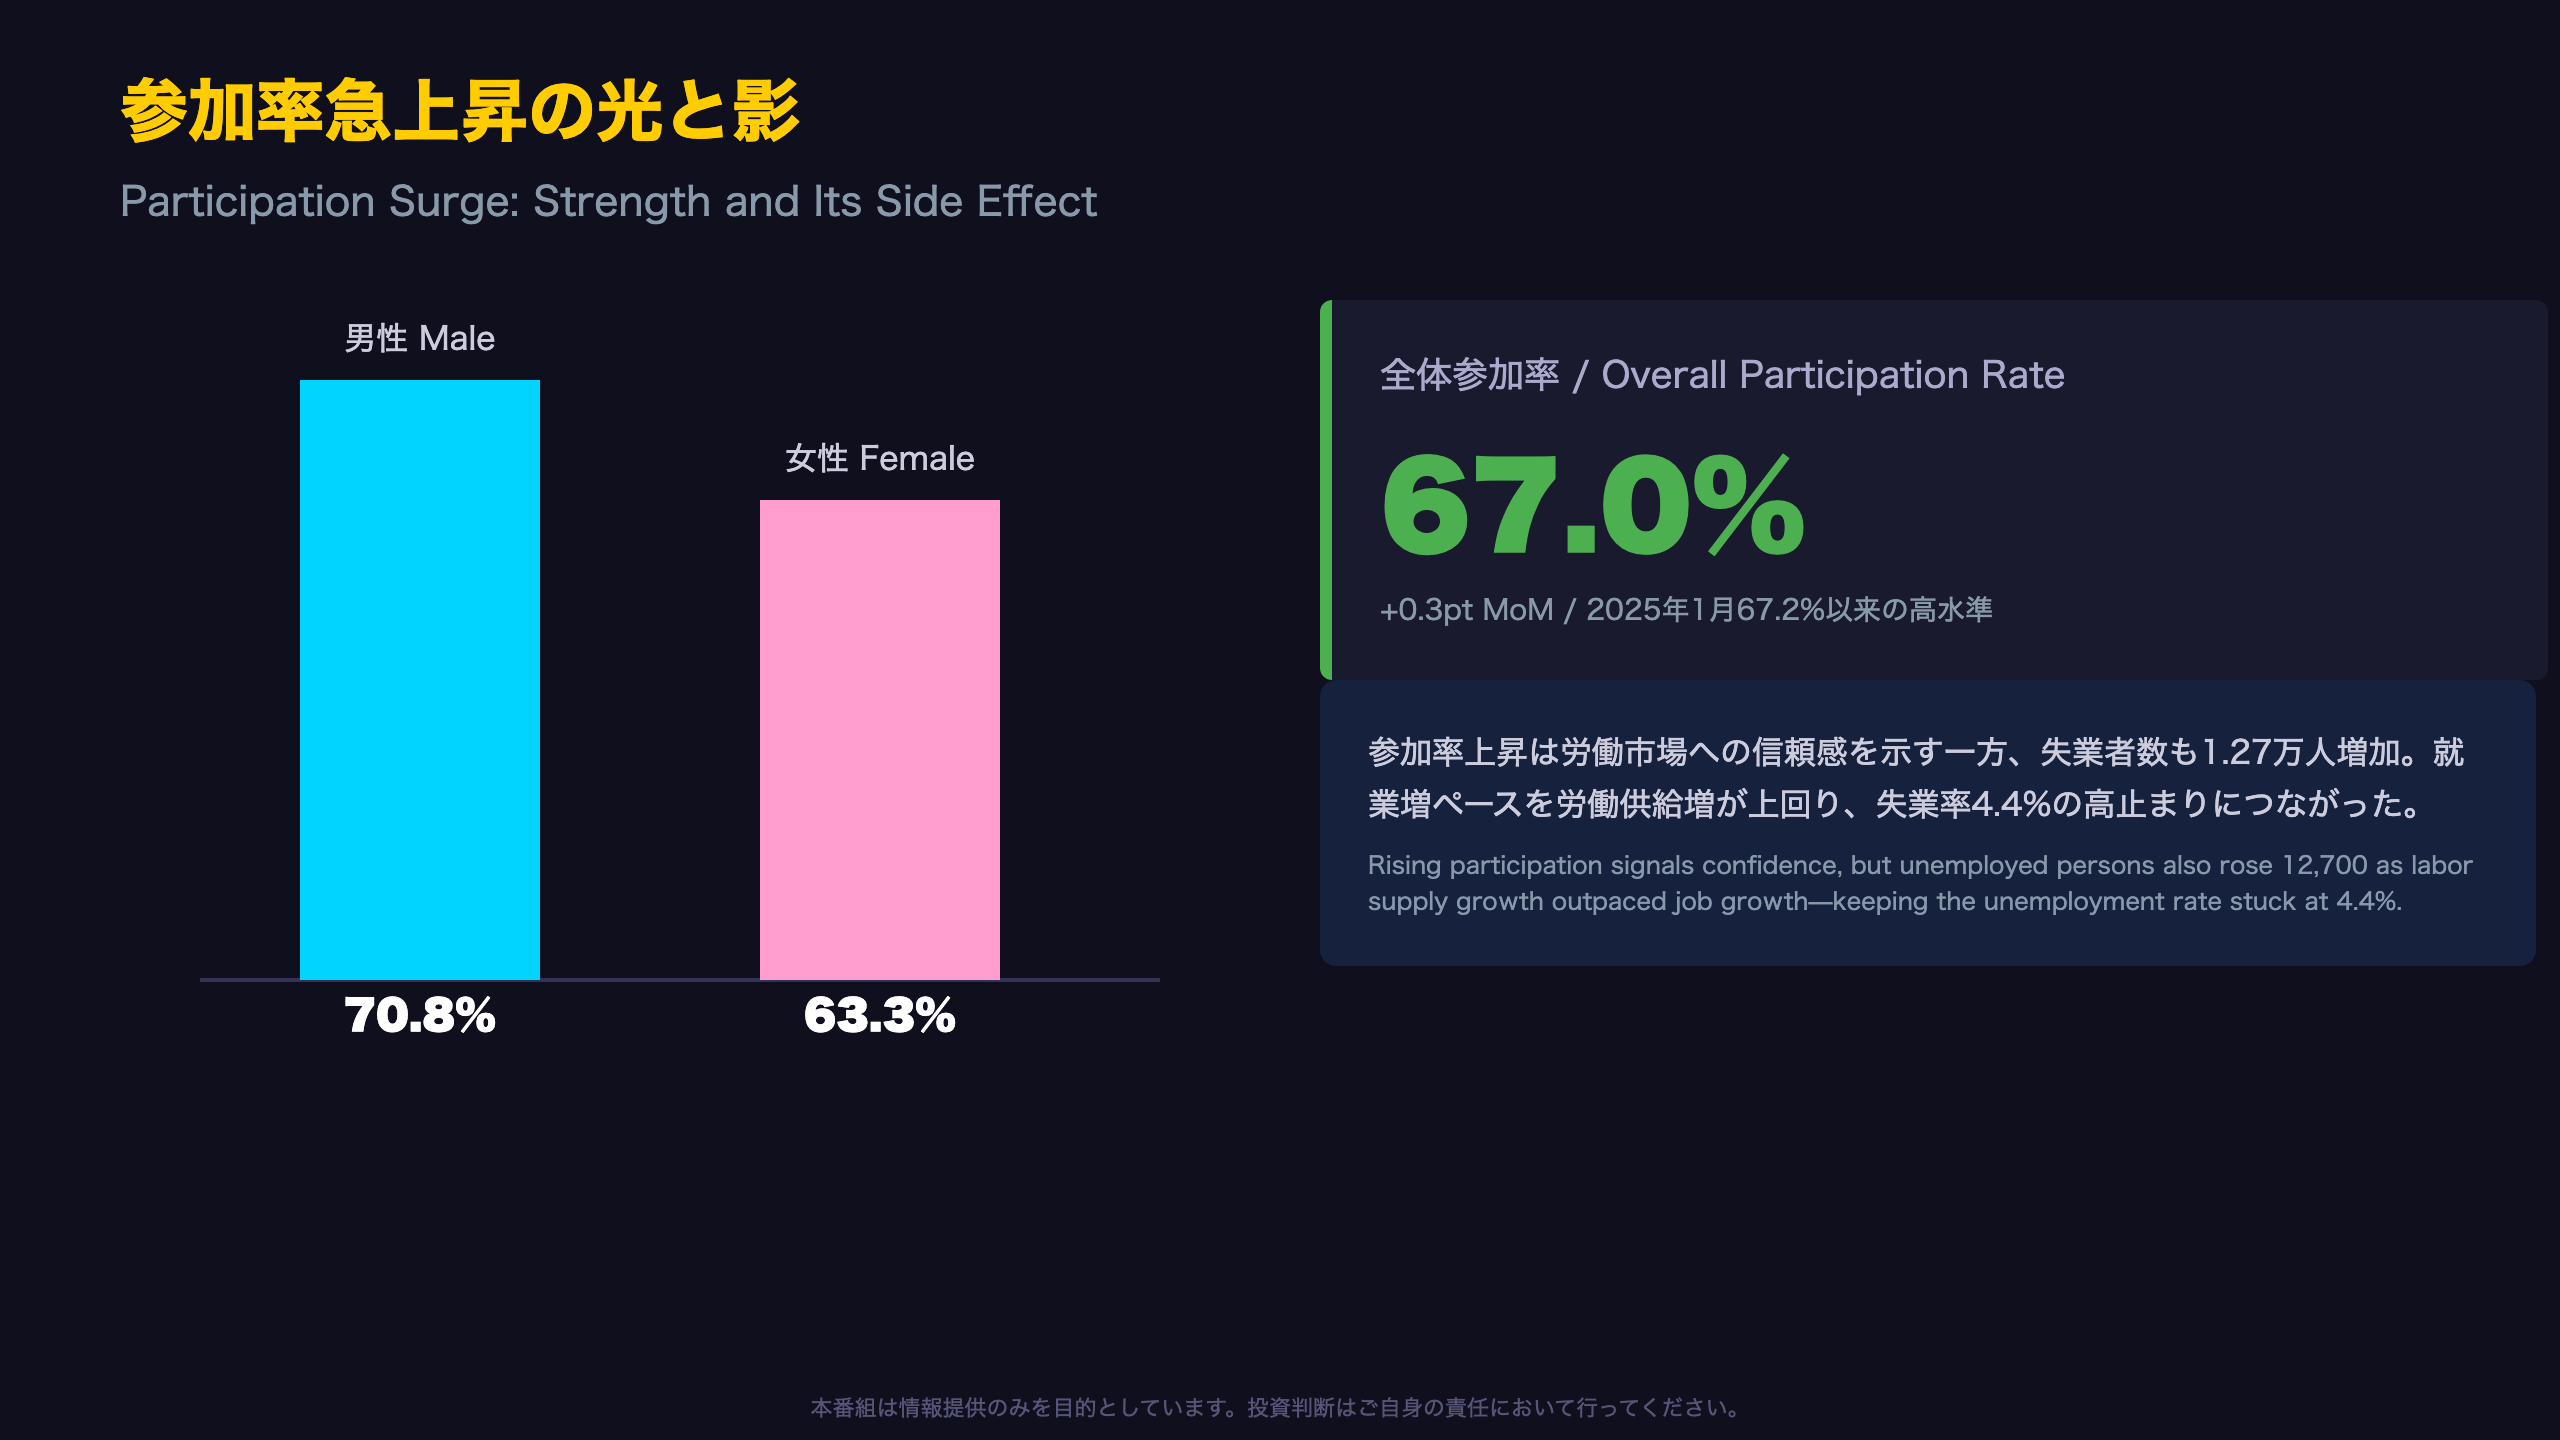
Under normal circumstances, a 76,300 increase in employment would be expected to push the unemployment rate sharply lower. Instead, the number of unemployed people in Australia actually rose by 12,700 to 686,800 in June. The key to this apparent contradiction is a surge in labour force participation.
“The participation rate rose 0.3ppt to 67.0%,” per the ABS release.
Gender breakdown
- Male participation: +0.2 points to 70.8%
- Female participation: +0.4 points to 63.3% — the standout mover
Why this matters for international comparison
Unlike the U.S. labor force participation rate, which has been relatively flat around 62.5-62.7% in recent cycles, Australia’s participation rate at 67.0% sits notably higher and continues to test multi-year highs. A rising participation rate alongside strong payroll growth is generally viewed as a healthy sign — more people are confident enough in job prospects to actively search for work — rather than a symptom of economic distress.
Bull vs bear reading
- Bull case: Rising participation reflects strong underlying labour demand pulling people off the sidelines — a sign of a genuinely tight, confident labour market.
- Bear case: If job creation can’t keep pace with the influx of job-seekers in coming months, the unemployment rate could begin rising more visibly, which would be a more dovish signal for the RBA.
Trend-adjusted participation also edged up from 66.8% to 66.9%, suggesting this is not purely a seasonally-adjusted blip but part of a gradual underlying trend worth monitoring closely.
雇用の質のひび割れ:不完全雇用と労働時間
Underemployment Deteriorates for a Third Straight Month
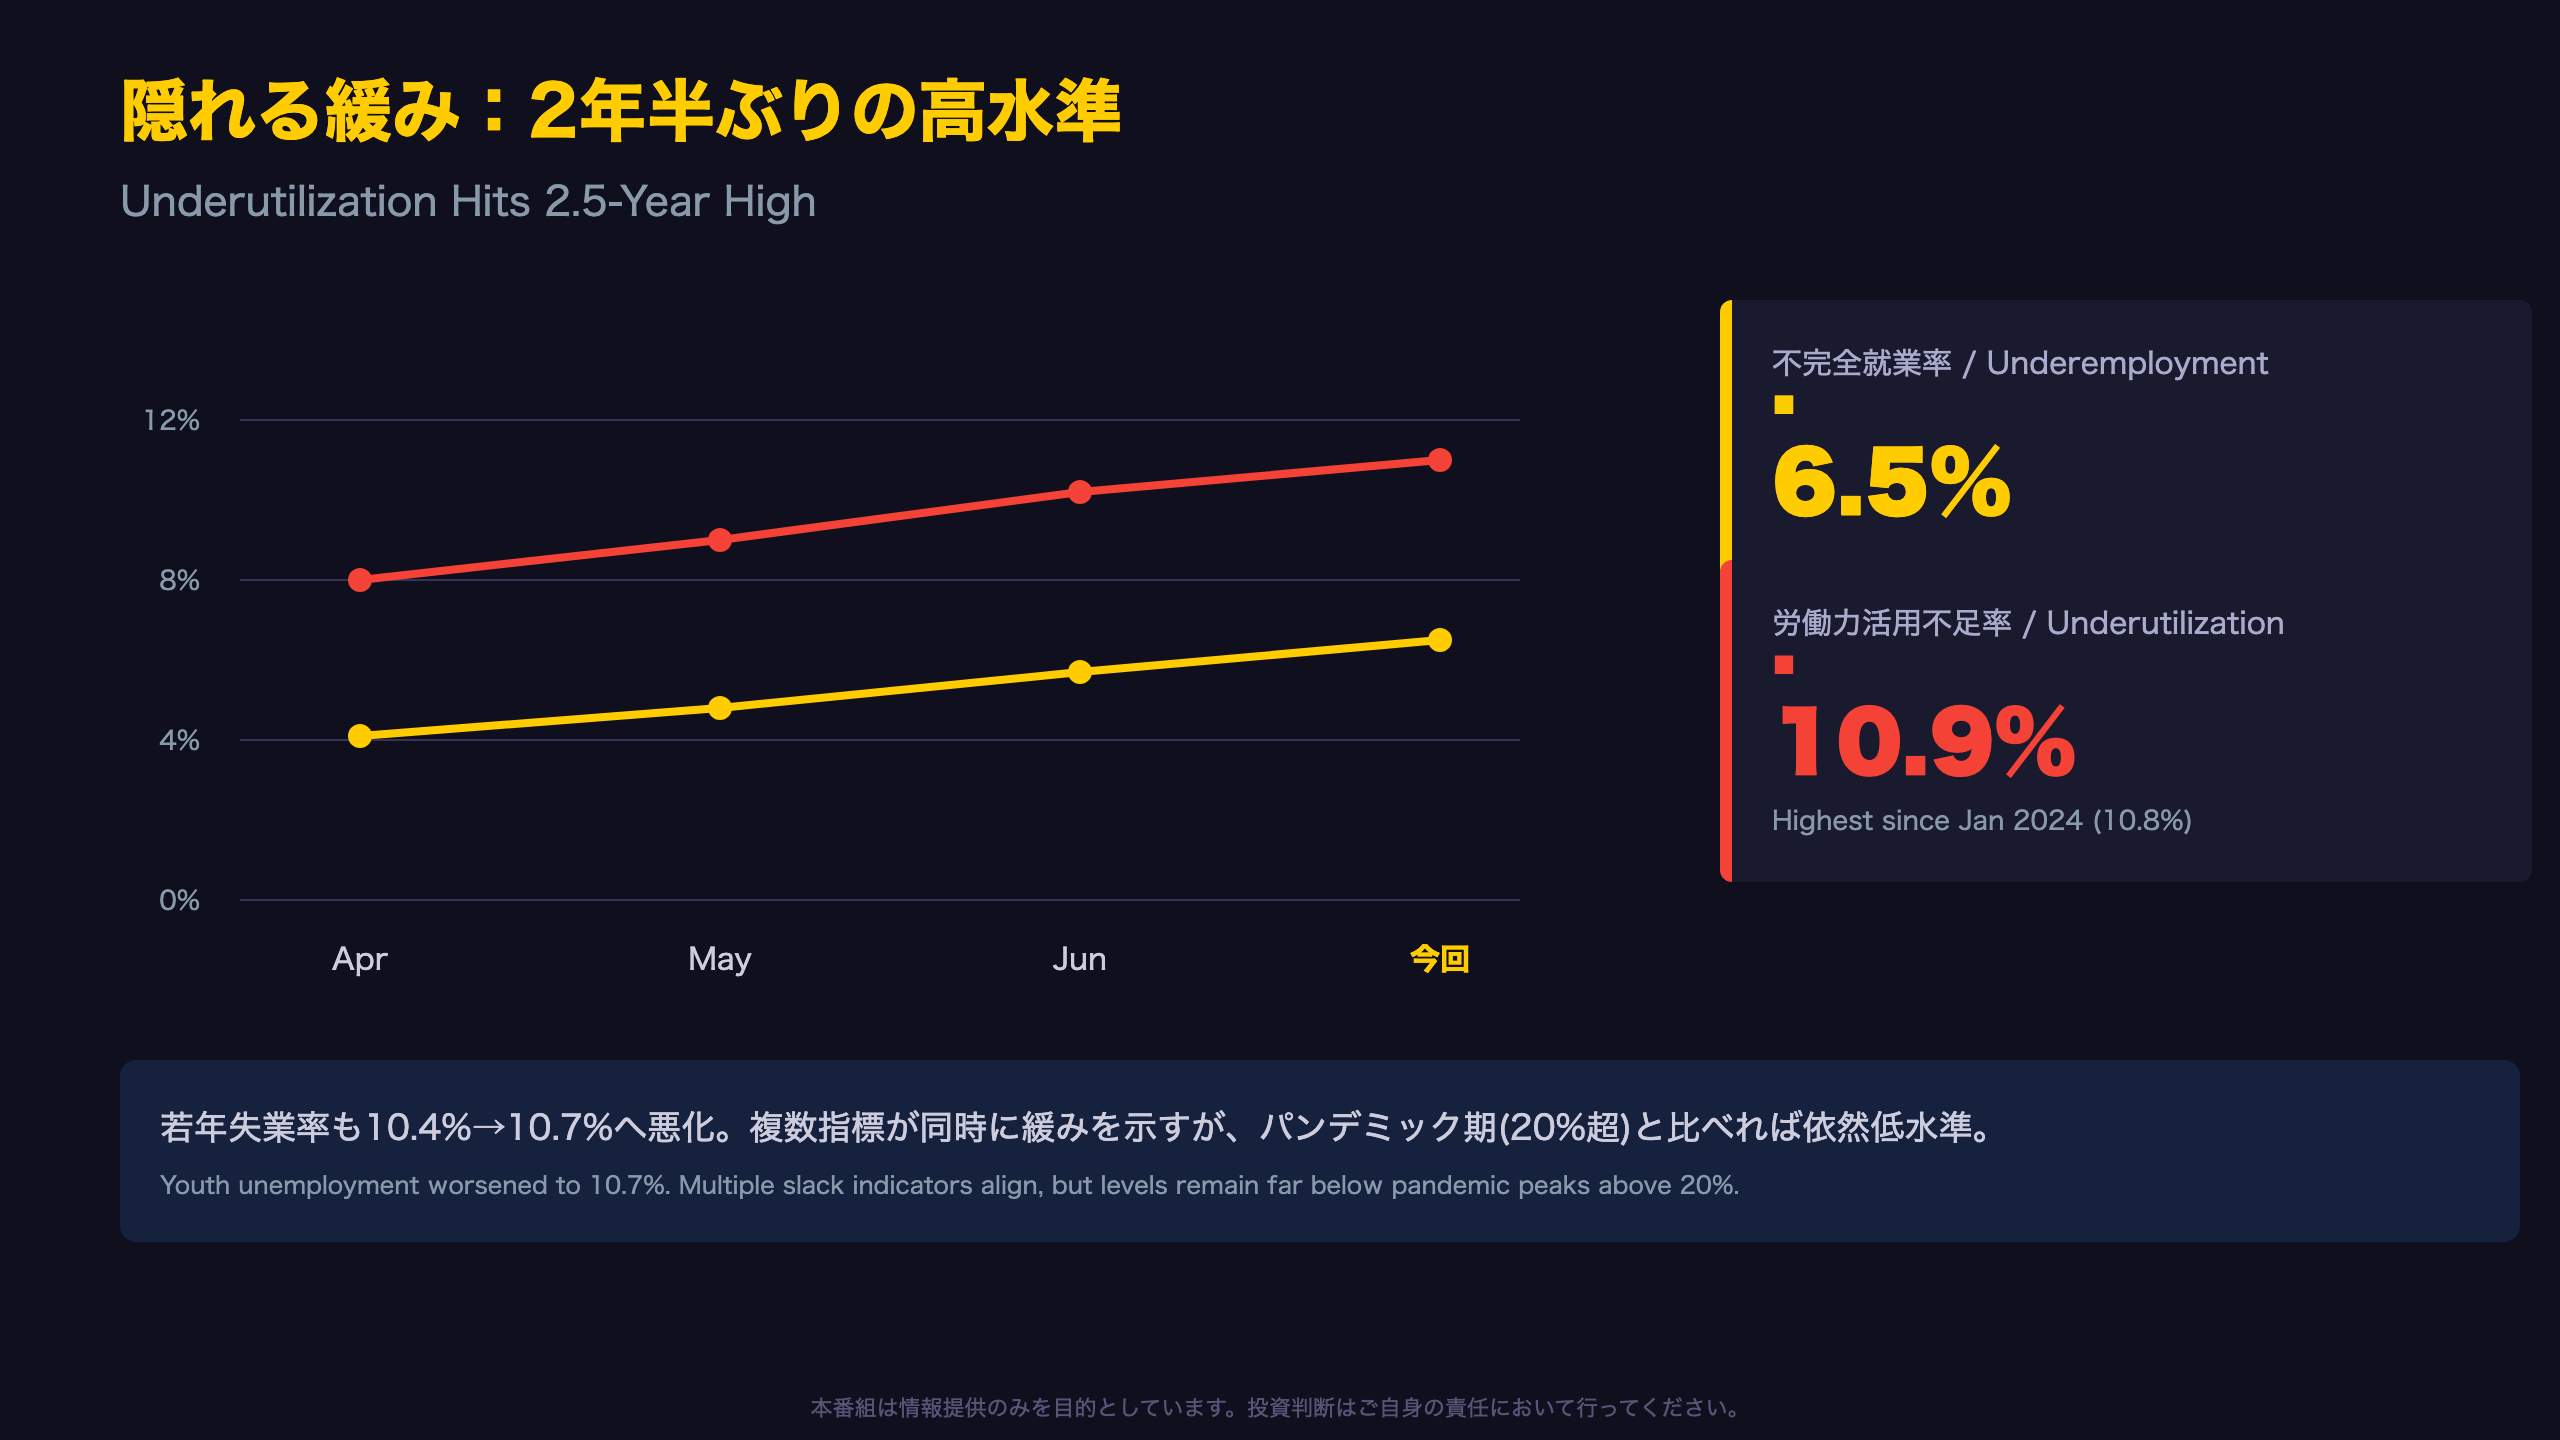
Beneath the headline unemployment rate, Australia’s underemployment rate — which measures workers who want more hours than they currently get — has now risen for three consecutive months: 5.9% in April, 6.3% in May, and 6.5% in June, a cumulative increase of 0.6 percentage points.
“The underemployment rate rose 0.2ppt to 6.5% and the underutilisation rate rose 0.3% to 10.9%,” the ABS stated.
An indexed comparison international readers can use
Using June 2022 as a base of 100 (similar in spirit to how the U.S. BLS tracks the diffusion index), employment and hours-worked indices had moved together until recently. In April, the hours-worked index (109.6) exceeded the employment index (108.2) — meaning hours were growing faster than headcount. By June, that relationship reversed: employment (109.1) now exceeds hours worked (108.6).
What this could mean
This divergence is consistent with employers expanding headcount — likely via part-time or casual roles — without proportionally increasing total hours demanded, a phenomenon sometimes described as “labour hoarding” in slower-growth phases, or alternatively simple evidence of a shift toward more flexible staffing models.
Two readings
- Cautious reading: Three consecutive months of rising underemployment is a legitimate early-warning signal for softening labour demand, something the RBA will watch closely alongside wage growth data.
- Constructive reading: A single quarter of divergence in a survey with known sampling variability does not yet confirm a structural downturn; hours worked often lag employment moves before catching up.
The next data point — July’s Labour Force Survey — will help determine whether this represents an emerging structural trend or a temporary soft patch.
州別の温度差とデータ品質への留保
A Tale of Two Labour Markets Across States
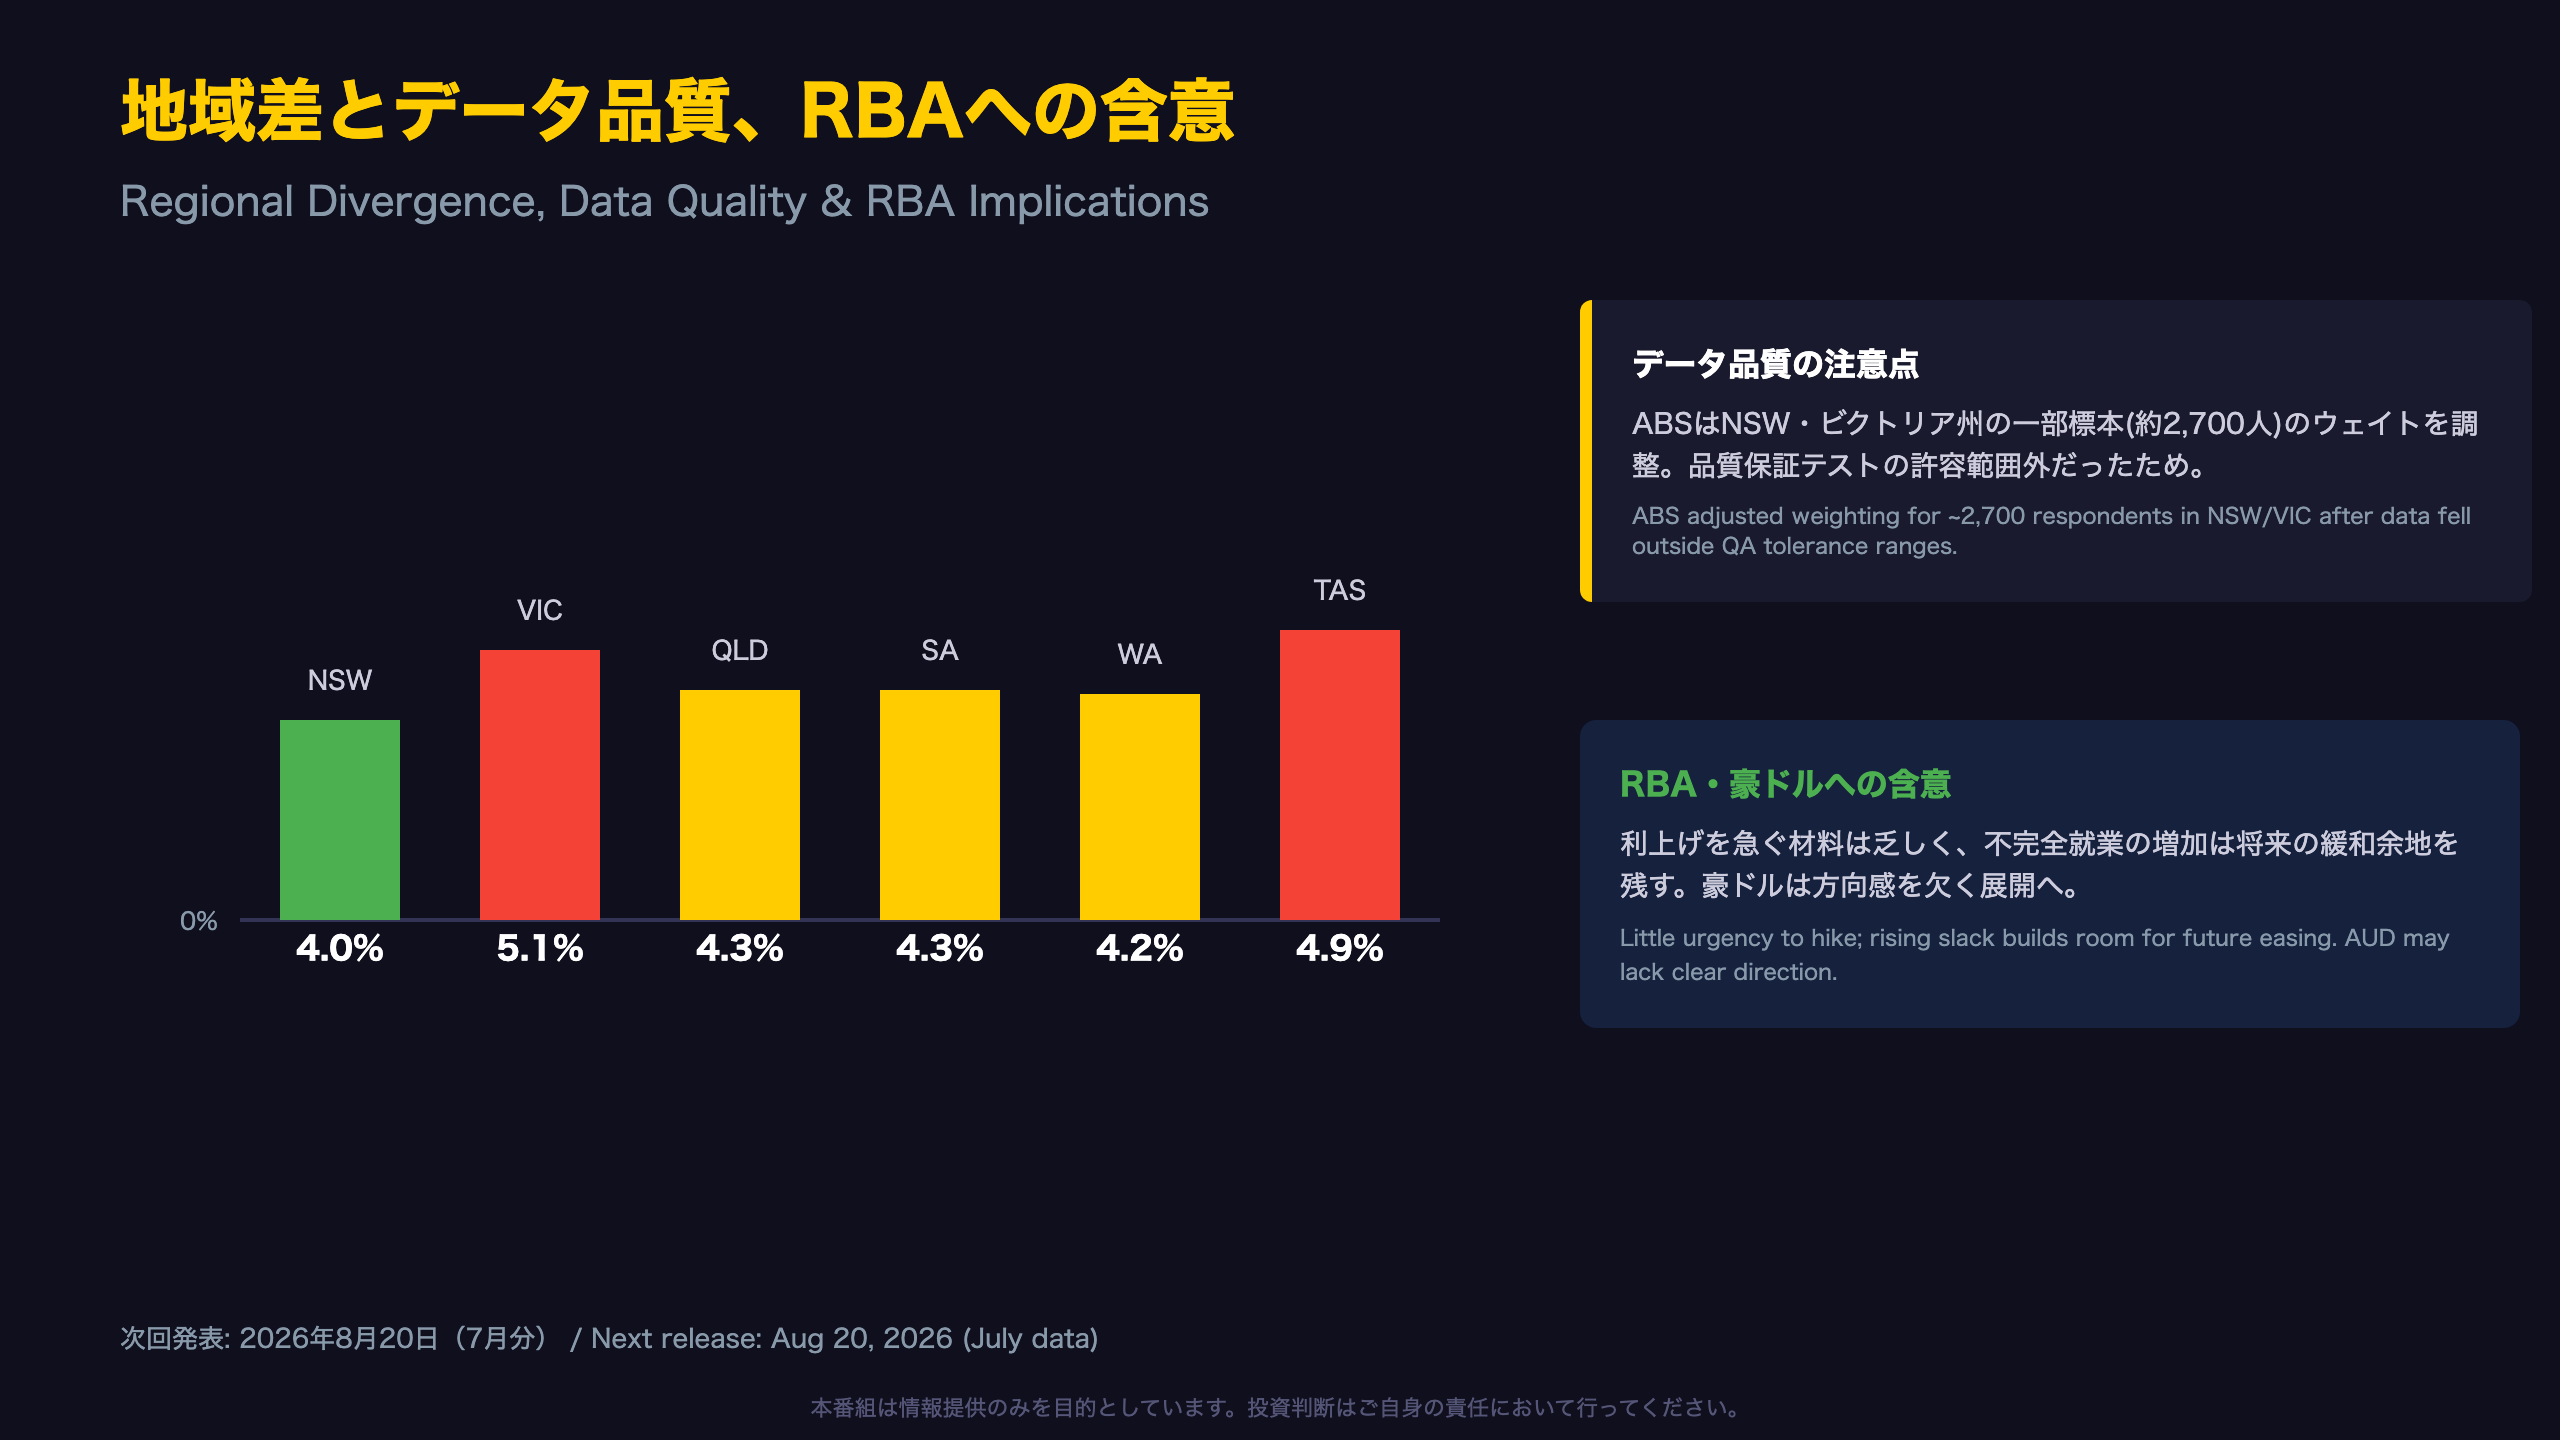
Behind the strong national headline, state-level data tells a more divided story. Western Australia (+1.0%), Tasmania (+1.2%) and New South Wales (+0.9%) led the employment gains, while Queensland was essentially flat (-0.1%) and saw its unemployment rate jump from 3.7% to 4.3%. Victoria posted the weakest readings nationally, with unemployment at 5.1% and underemployment at 7.3% — both the highest of any state.
A rare, explicit data-quality disclosure
“Data from one of the incoming rotation groups for June in New South Wales and Victoria were considerably different in their labour force characteristics … outside the tolerance ranges of several of our quality assurance tests,” the ABS explained.
In response, the ABS adjusted the weighting for roughly 2,700 respondents — about 6% of the June sample. For context, this kind of explicit, publicly disclosed methodological intervention is uncommon for a G10 labour market survey and is broadly comparable in spirit to the U.S. BLS’s periodic benchmark revisions, though executed here mid-cycle rather than annually.
Synthesis for markets
Taken together — strong headline job growth, rising participation, deteriorating underemployment, and an explicit data-quality caveat — this report gives the RBA no clear mandate to cut rates imminently, which is modestly supportive for the Australian dollar in the near term. At the same time, the underlying softness in hours worked and underemployment argues against reading this print as an unambiguous all-clear signal for the economy.
What to watch next
The July Labour Force Survey, due August 20, 2026, will be the key test of whether June’s acceleration reflects durable underlying strength or is partly an artefact of the flagged rotation-group anomaly in New South Wales and Victoria.
Disclaimer: This article is for informational purposes only. All investment decisions are made solely at your own risk.