This article was automatically generated by the NFC Market Live AI analysis system. (Updated: 2026-11-18 22:37 JST)
📄 Primary Source
U.S. Census Bureau
https://www.census.gov/construction/nrc/pdf/newresconst.pdf
The U.S. Census Bureau and HUD released October 2026 new residential construction data on November 18 (preliminary, seasonally adjusted annual rate).
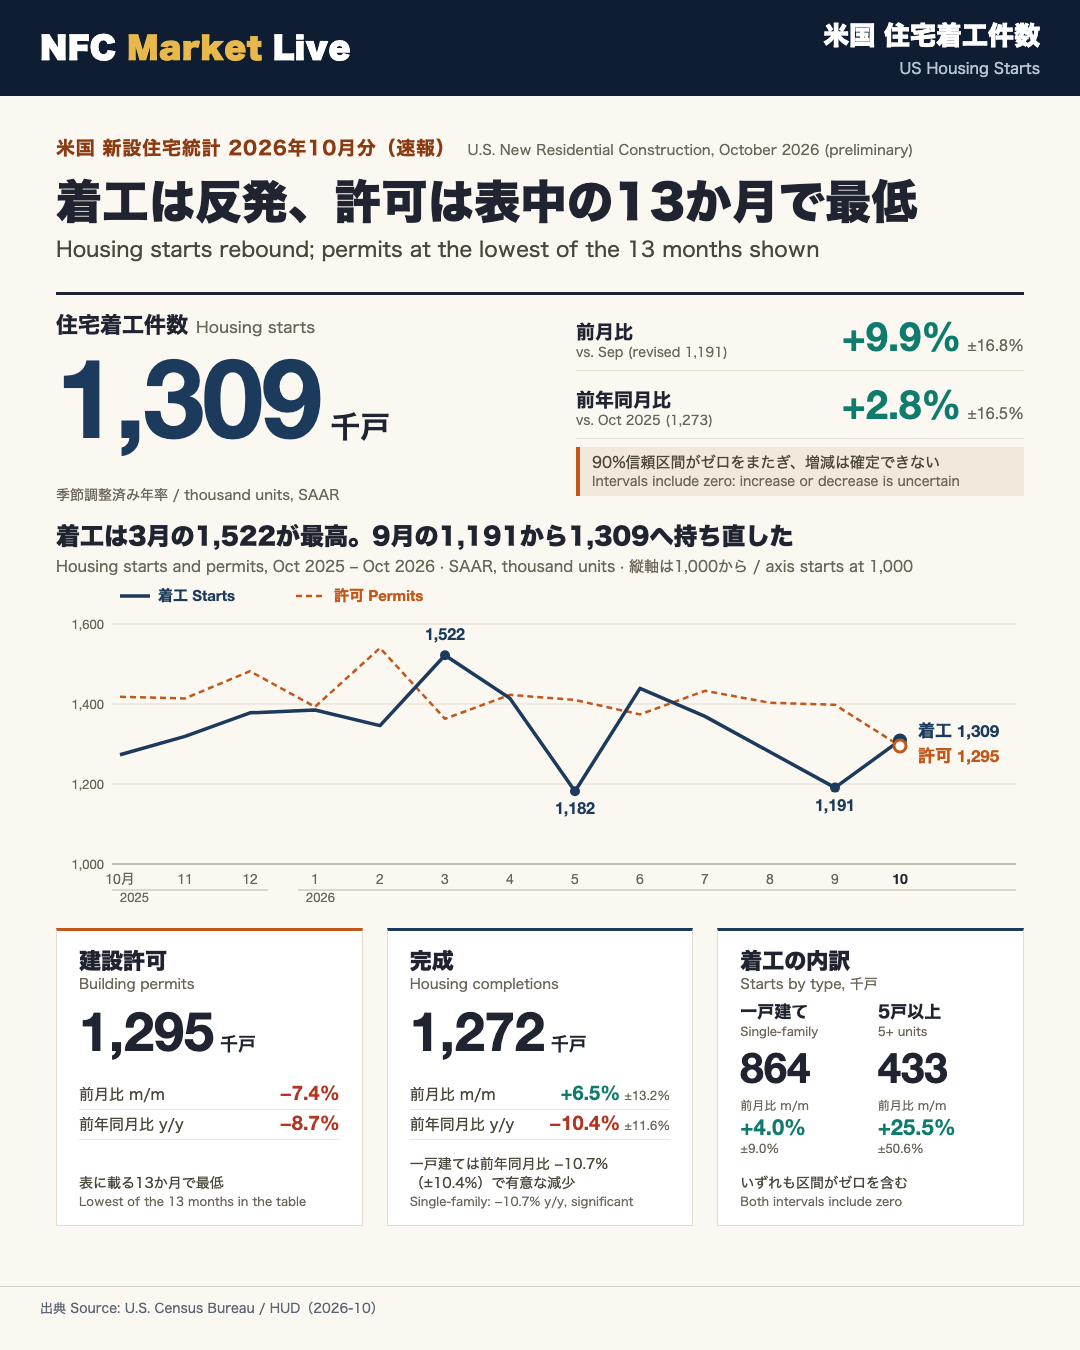
Housing starts were 1,309,000, up 9.9% from the revised September estimate of 1,191,000 and up 2.8% from October 2025. The 90% confidence intervals (±16.8% and ±16.5%) include zero, so the report treats neither change as statistically significant. Single-family starts were 864,000 (+4.0%, ±9.0%); units in buildings with five or more units were 433,000.
Building permits were 1,295,000, down 7.4% from the revised September rate of 1,398,000 and down 8.7% from a year earlier. Single-family permits were 772,000, down 8.7% on the month; permits for five-plus-unit buildings were 475,000.
Housing completions were 1,272,000, up 6.5% (±13.2%) from September and down 10.4% (±11.6%) from October 2025.
Regional starts: South 747,000, Midwest 239,000, West 228,000, Northeast 95,000.
The release notes that monthly changes in seasonally adjusted data can be irregular, and that it may take three months to establish a trend for permits and six months for starts and completions. A sample redesign takes effect with the January 2027 release on February 18, 2027. The November report is due December 17, 2026.
総括:着工は反発、建設許可は表中で最低
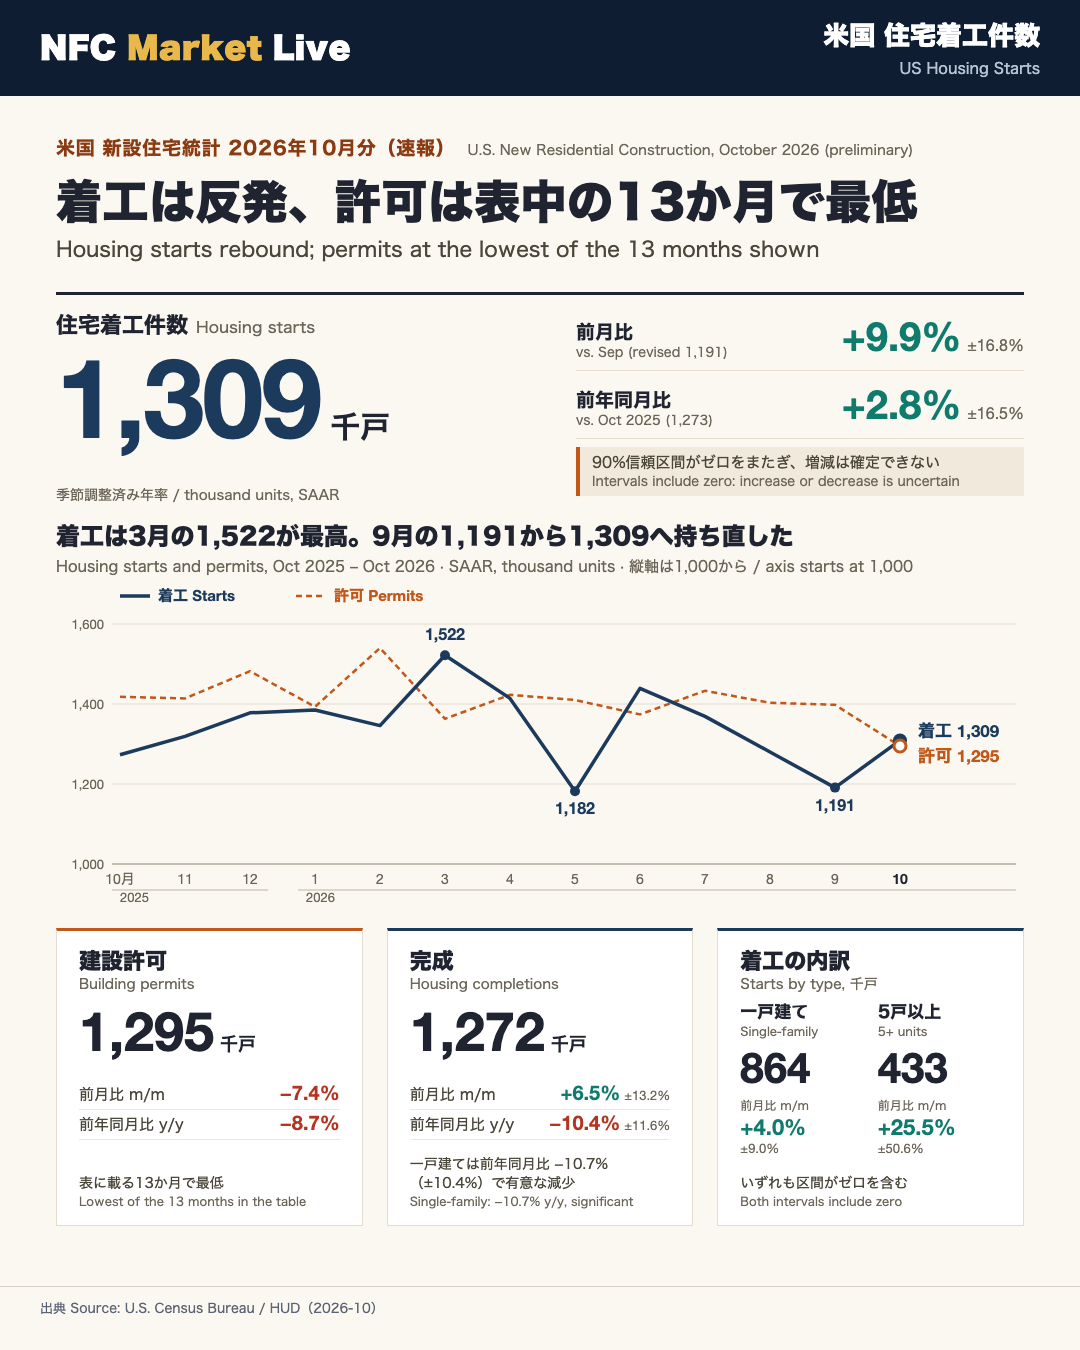
Starts rebound, permits slip
The U.S. Census Bureau and the Department of Housing and Urban Development (HUD) jointly publish the monthly New Residential Construction report. All headline figures are seasonally adjusted annual rates (SAAR), meaning the monthly pace is scaled to a full year. The October 2026 data are preliminary.
| Measure | Oct 2026 (thousands) | vs. Sep | vs. Oct 2025 |
|---|---|---|---|
| Permits | 1,295 | -7.4% | -8.7% |
| Starts | 1,309 | +9.9% (±16.8%) | +2.8% (±16.5%) |
| Completions | 1,272 | +6.5% (±13.2%) | -10.4% (±11.6%) |
What each series measures
- Permits are authorizations issued by local jurisdictions. They come before construction begins.
- Starts count units on which excavation begins.
- Completions count finished units.
Balanced reading
On the positive side, starts rose from a revised 1,191,000 in September and exceeded August’s 1,280,000. On the other side, permits at 1,295,000 are the lowest of the 13 months shown in the release’s table. Completions are 10.4% below a year ago.
The report stresses that the starts changes have confidence intervals that include zero, so it is uncertain whether starts actually rose or fell. It also says it may take three months to establish a trend in permits and six months for starts and completions. The next release, covering November, is scheduled for December 17, 2026.
内訳:一戸建ては着工増・許可減、集合住宅は振れが大きい
Single-family versus multifamily
The Census report splits housing units by building type: single-family (1 unit), 2 to 4 units, and 5 units or more. Over the past year, single-family and multifamily data have moved quite differently.
Single-family
- Permits: 772,000, down 8.7% from September’s revised 846,000 and down 12.9% from a year earlier. This is the lowest of the 13 months in the table.
- Starts: 864,000, up 4.0% (±9.0%) on the month and down 3.2% (±10.6%) on the year. Neither change is statistically significant.
- Completions: 900,000, up 6.3% (±13.3%) on the month. The year-on-year decline of 10.7% (±10.4%) does have an interval that excludes zero.
- Year to date (not seasonally adjusted): single-family starts are down 4.6% (±3.2%), also a statistically significant decline.
Five-plus-unit buildings
- Permits: 475,000, down 5.2% on the month and 0.4% on the year.
- Starts: 433,000, up 25.5% on the month, but with a ±50.6% confidence interval.
- Completions: 362,000.
Multifamily starts are volatile: the 2026 monthly readings range from 282,000 in May to 519,000 in June. Estimates for the 2-to-4-unit category are not published for starts and completions because they do not meet the Census Bureau’s seasonality-reliability standards.
A cautious reading is that the October rise in starts spans both segments, but both carry wide uncertainty. Single-family permits, which precede construction, fell. The report does not offer a cause for either movement.
地域別:南部・中西部で着工増、北東部は減少
Regional breakdown
The Census Bureau divides the country into four regions: Northeast, Midwest, South and West. Figures below are seasonally adjusted annual rates, in thousands of units.
Starts
- South: 747, up 10.5% (±22.2%) on the month. It accounts for the largest share of the 1,309 national total.
- Midwest: 239, up 48.4% (±49.0%) from September’s 161. The interval includes zero.
- West: 228, down 2.6% (±16.5%) on the month and 11.6% (±16.1%) on the year. Neither change is significant.
- Northeast: 95, down 20.8% (±52.5%) on the month and 34.5% (±23.2%) on the year. The year-on-year decline is the only regional starts change whose interval excludes zero.
Permits
- South: 675, down 10.7% on the month and 8.3% on the year.
- West: 272, down 4.6% on the month and 20.0% on the year.
- Northeast: 135, down 6.9%.
- Midwest: 213, up 0.5%.
Southern and Western permits are the lowest of the 13 months in the release’s table. Western single-family permits (148,000) are down 21.7% from a year earlier.
Reading the divergence
Permits fell in three of four regions even as starts rose in two of them. Regional estimates carry much wider sampling error than national totals, and permits are a separate survey (Table 1 is not subject to sampling error), so the two series are not directly comparable in precision. The report gives no regional explanations.
パイプライン:許可済み未着工・建設中・完成
From permit to finished home
The release tracks housing at three stages: units authorized but not started, units under construction, and units completed.
Authorized but not started (stock)
- 276,000 in October, down 3.5% (±3.6%) on the month and up 7.4% (±8.1%) on the year. Both intervals include zero.
- Single-family: 151,000, down 3.2% (±3.0%). The interval excludes zero, a statistically significant decline.
- Five-plus units: 120,000, down 4.0% (±7.1%).
Under construction (stock)
- 1,272,000, down 0.1% (±1.3%) on the month and 3.0% (±3.2%) on the year. The year-on-year interval barely includes zero.
- Single-family: 581,000. Five-plus units: 674,000.
- The total has stayed between 1,252,000 and 1,288,000 throughout 2026 in the table.
Completions (flow, SAAR)
- 1,272,000 in October: up 6.5% (±13.2%) on the month, down 10.4% (±11.6%) on the year.
- Year to date (not seasonally adjusted): 1,080,800 versus 1,231,900 a year earlier, a decline of 12.3% (±4.4%). This one is statistically significant.
- Single-family year-to-date completions are down 10.7% (±4.3%); five-plus units are down 15.6% (±9.6%).
The under-construction stock and the completions rate happen to share the figure 1,272,000 but are different concepts, one a stock and one an annualized flow. One reading is that stable construction activity coexists with fewer completions this year than last, but the report gives no explanation for the decline.
統計の読み方・方法変更・次回公表日
How to read the confidence intervals
The Census Bureau publishes 90% confidence intervals for percentage changes. If the interval includes zero, the change is not statistically significant, meaning it is uncertain whether there was an increase or decrease. An entry such as “2.5 percent (±3.2 percent) above” implies a likely range of -0.7% to +5.7%.
| Change | Reported | Approx. range | Includes zero? |
|---|---|---|---|
| Starts, month-on-month | +9.9% (±16.8%) | -6.9% to +26.7% | Yes |
| Starts, year-on-year | +2.8% (±16.5%) | -13.7% to +19.3% | Yes |
| Completions, month-on-month | +6.5% (±13.2%) | -6.7% to +19.7% | Yes |
| Completions, year-on-year | -10.4% (±11.6%) | -22.0% to +1.2% | Yes |
| Single-family completions, year-on-year | -10.7% (±10.4%) | -21.1% to -0.3% | No |
The ranges are simple arithmetic from the published figures.
Other notes from the release
- Permits (Table 1) come from a non-probability sample and carry no sampling error; the quantity response rate is 76.6%.
- Starts, under construction and completions are sample-survey estimates.
- On average, preliminary estimates of permits, starts and completions are revised by 3.8% or less.
- The Census Bureau says it may take three months to establish a trend for permits and six months for starts and completions.
Methodology change
With the January 2027 release on February 18, 2027, the Survey of Construction will complete a sample redesign. Estimates for non-permit-issuing areas, currently under 1% of totals, will be discontinued.
Next release
November data are due on December 17, 2026. Because this release mixes a rise in starts with a fall in permits, both series are worth reading against the report’s own caveats.
Disclaimer: This article is for informational purposes only. All investment decisions are made solely at your own risk.