This article was automatically generated by the NFC Market Live AI analysis system. (Updated: 2026-11-18 19:38 JST)
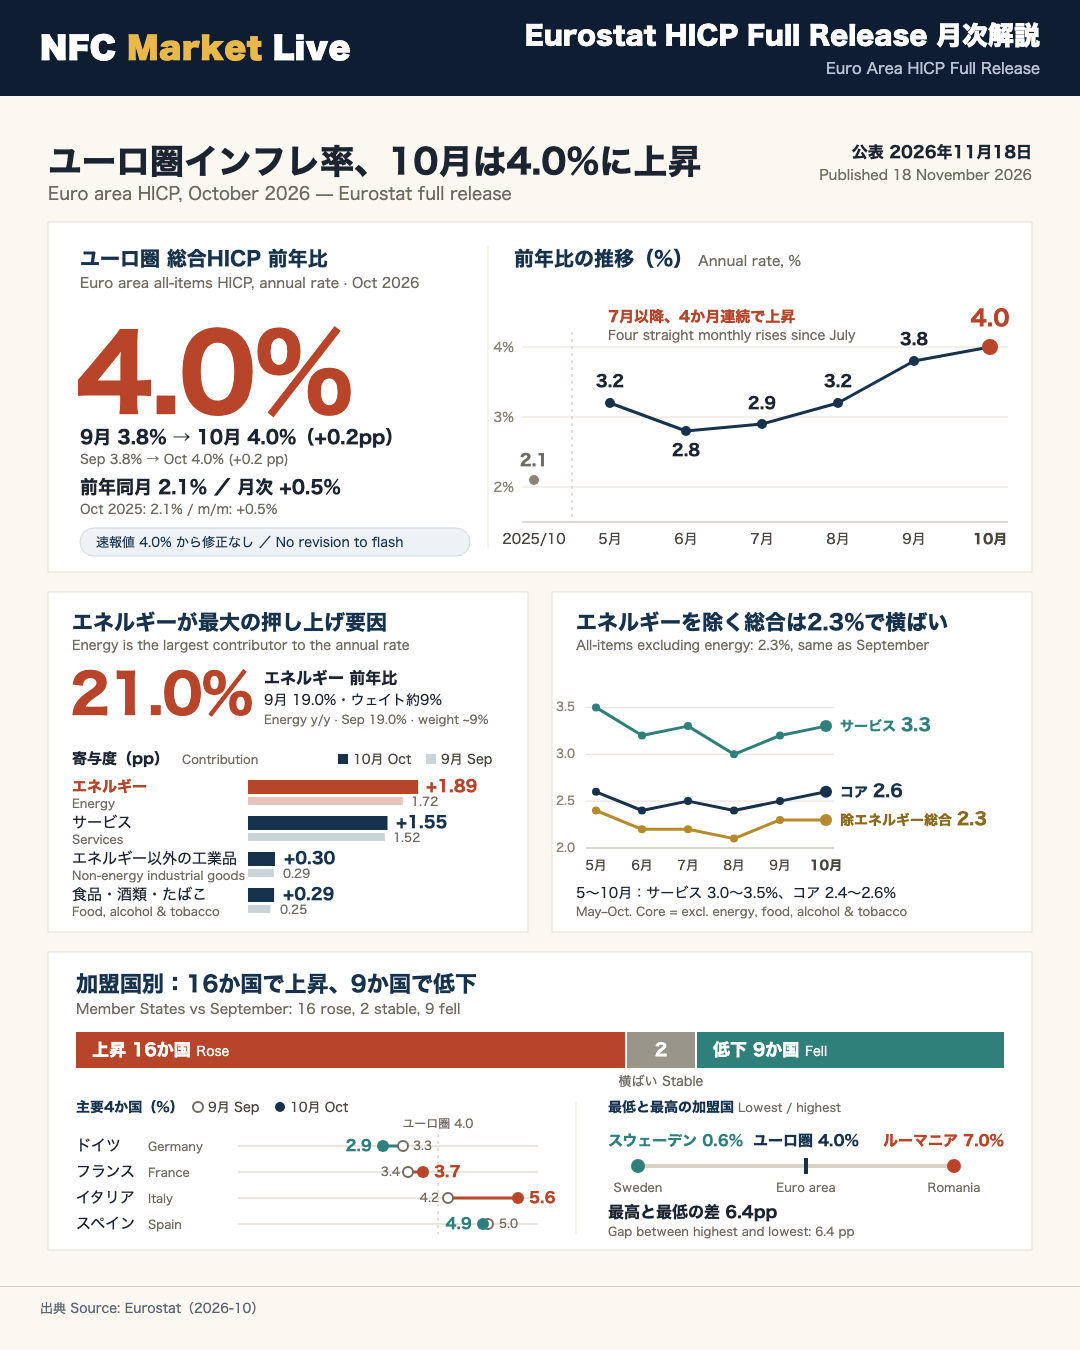
Euro area annual inflation was 4.0% in October 2026, up from 3.8% in September and 2.1% a year earlier, according to Eurostat’s full HICP release of 18 November. This matches the flash estimate published on 4 November.
Energy was the largest contributor at +1.89 percentage points, with annual energy inflation at 21.0% (September: 19.0%, revised from 18.9% after Germany revised its natural gas data; the October flash was 20.8%). Services contributed +1.55 pp at 3.3%. Inflation excluding energy, food, alcohol & tobacco was 2.6% (September: 2.5%).
In the EU, the highest annual rates were in Romania (7.0%), Lithuania (6.1%) and Bulgaria (5.9%); the lowest were in Sweden (0.6%), Czechia and Denmark (both 2.1%). Compared with September, annual inflation fell in nine Member States, remained stable in two and rose in sixteen. Italy moved from 4.2% to 5.6%, while Germany eased from 3.3% to 2.9%.
The next flash estimate, for November 2026, is scheduled for 1 December 2026.
Source: Eurostat
全体像:10月HICP確報は前年比4.0%、速報と同水準
Headline: 4.0%, in line with the flash
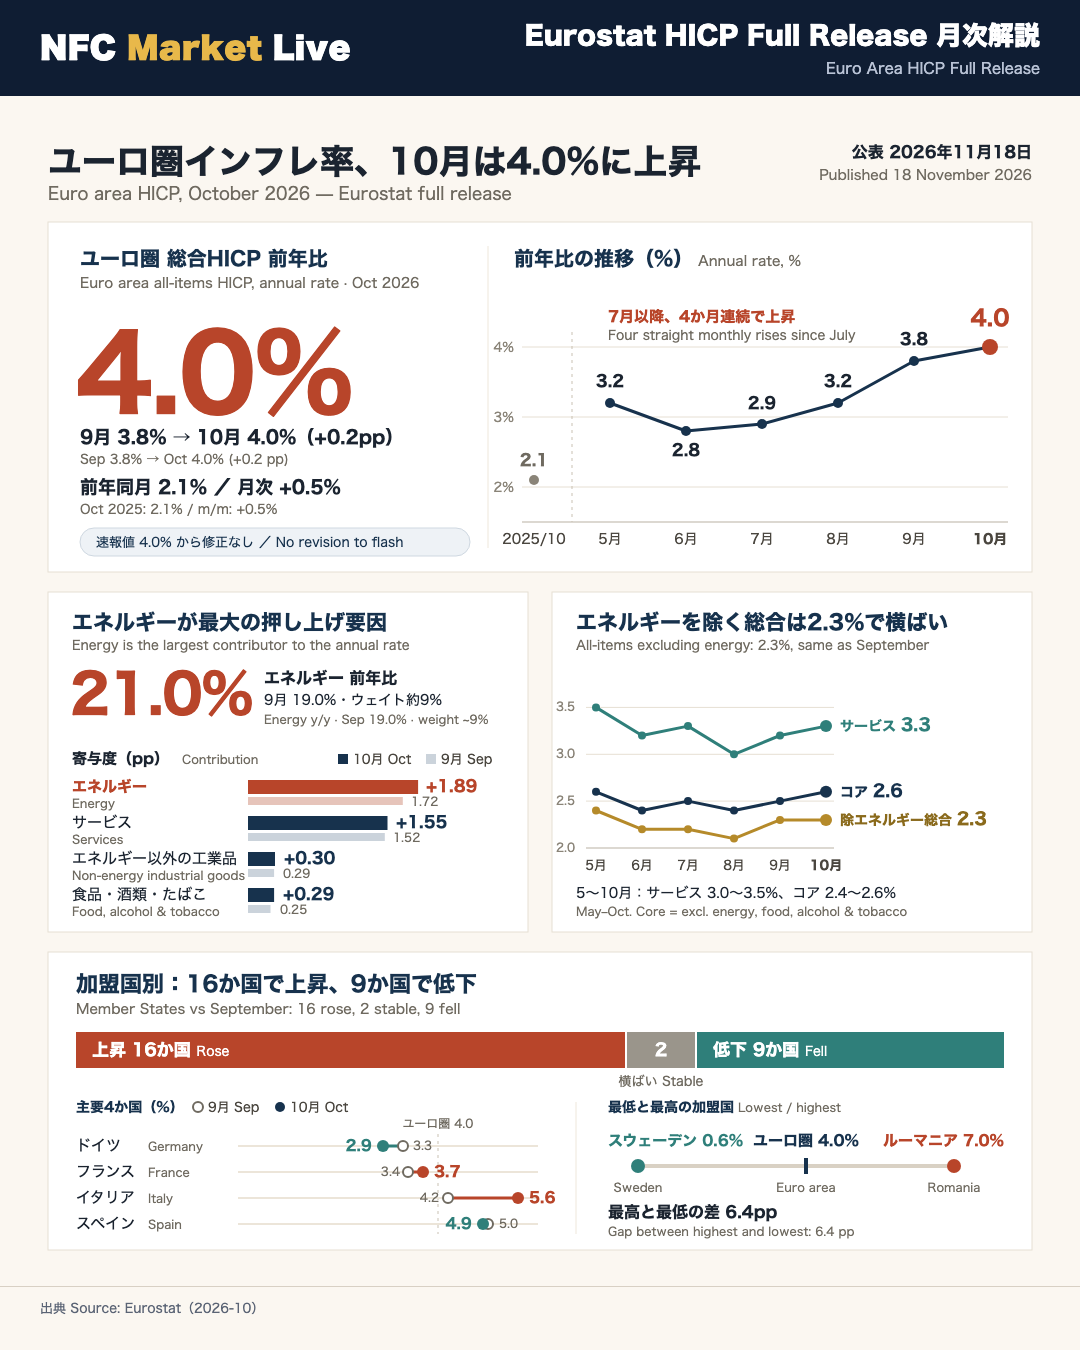
Eurostat’s full HICP release (18 November 2026) puts euro area annual inflation at 4.0% in October, up from 3.8% in September and 2.1% a year earlier. The monthly rate was +0.5%. The figure is unchanged from the flash estimate of 4 November. Eurostat is the EU’s statistical office, and the HICP (Harmonised Index of Consumer Prices) is the measure the European Central Bank uses to define its 2% medium-term price stability target. It differs from the US CPI mainly in its weighting and in how it treats owner-occupied housing, so the two should not be compared one-for-one.
Trend
- Oct 2025: 2.1% | May 2026: 3.2% | Jun: 2.8% | Jul: 2.9% | Aug: 3.2% | Sep: 3.8% | Oct: 4.0%
- Since the June low, the rate has risen for four consecutive months.
Two sides of the data
- Pressure: the headline is the highest in the table’s window, and annual inflation rose in sixteen Member States versus September.
- Restraint: inflation excluding energy was 2.3%, unchanged from September and slightly below October 2025 (2.4%). It fell in nine Member States.
Contributions to the annual rate (pp)
Energy +1.89, services +1.55, non-energy industrial goods +0.30, food, alcohol & tobacco +0.29.
Our reading (an interpretation, not Eurostat’s statement): energy is doing most of the work. Between September and October, energy’s contribution rose by 0.17 pp while the other three groups combined rose by 0.08 pp.
What to watch
The release does not discuss monetary policy, so any link to ECB decisions or to the euro is outside the document and should be treated cautiously. The next flash estimate, covering November, is due on 1 December 2026.
エネルギー:前年比21.0%、寄与度+1.89ppで最大項目に
Energy: the largest contributor
Energy prices rose 21.0% year on year in October (September: 19.0%; October 2025: -0.9%). Energy contributed +1.89 pp to euro area inflation, more than services (+1.55 pp). Energy carries a weight of 90.3 per mille (about 9%) in the HICP basket, so a double-digit rate in a small component can still move the headline substantially. The monthly rate was +1.5%.
Path of annual energy inflation (%)
Oct 2025: -0.9 | May: 10.8 | Jun: 8.5 | Jul: 10.3 | Aug: 14.3 | Sep: 19.0 | Oct: 21.0
The rate has risen four months in a row since June. The pace of acceleration, however, eased: +4.7 points from August to September versus +2.0 points from September to October (our calculation from the table).
Revisions
The October flash put energy at 20.8%; the full release shows 21.0%. Germany revised its data for ‘natural gas through networks’, which lifted September’s euro area energy figure from 18.9% to 19.0% and its contribution from 1.71 pp to 1.72 pp.
Our reading
- Versus a year earlier, energy’s contribution swung from -0.08 pp to +1.89 pp, a move of about 1.97 pp, close to the full rise in the headline (2.1% to 4.0%).
- The release does not explain why energy prices rose.
Interpretation (ours, not Eurostat’s): the level of headline inflation is largely an energy story, while the slower acceleration and a stable ex-energy rate of 2.3% suggest the pressure has not broadened. One month of data cannot settle this. For readers focused on EUR crosses, energy-driven inflation and underlying inflation can have different policy implications, and the release itself makes no market claims.
サービスとコア:粘着的だが、水準は安定
Services and underlying inflation
Services inflation was 3.3% in October (September: 3.2%; October 2025: 3.4%), contributing +1.55 pp. With a weight of 468.2 per mille, services make up roughly 47% of the basket, the largest block. Inflation excluding energy, food, alcohol & tobacco, the usual ‘core’ gauge, was 2.6% (September: 2.5%; October 2025: 2.4%).
Six-month range (annual %)
| May | Jun | Jul | Aug | Sep | Oct | |
|---|---|---|---|---|---|---|
| Services | 3.5 | 3.2 | 3.3 | 3.0 | 3.2 | 3.3 |
| Core | 2.6 | 2.4 | 2.5 | 2.4 | 2.5 | 2.6 |
| Ex-energy | 2.4 | 2.2 | 2.2 | 2.1 | 2.3 | 2.3 |
Other components (October, annual)
- Non-energy industrial goods: 1.2% (September: 1.1%)
- Food, alcohol & tobacco: 1.5% (September: 1.3%), with processed food, alcohol & tobacco at 0.4% and unprocessed food at 4.6% (September: 4.0%)
Two readings
- Reassuring: services have stayed between 3.0% and 3.5% and core between 2.4% and 2.6% since May. Processed food inflation is very low at 0.4%.
- Cautionary: services are still above 3%, core edged up to the top of the range, and unprocessed food accelerated.
Interpretation (ours): outside energy, the data show a broadly flat picture rather than a clear broadening of price pressure. A 0.1-point move is within normal noise for one month. For comparison, the Fed watches US core PCE, whereas the ECB’s framework focuses on the HICP and its core measures, so cross-region comparisons need care. The release does not address wages or policy.
加盟国別:16か国で上昇、9か国で低下、差は0.6%〜7.0%
Country dispersion
Versus September, annual inflation rose in sixteen Member States, fell in nine and was stable in two. The highest rates were in Romania (7.0%), Lithuania (6.1%) and Bulgaria (5.9%); the lowest in Sweden (0.6%), Czechia and Denmark (both 2.1%). The gap between top and bottom is 6.4 points. Note that Eurostat’s table covers the whole EU, so several countries listed (for example Sweden, Czechia, Denmark and Romania) have their own central banks and are outside the euro area average.
The big four (annual %)
| Oct 2025 | Sep | Oct | Monthly (Oct) | |
|---|---|---|---|---|
| Germany | 2.3 | 3.3 | 2.9 | -0.1 |
| France | 0.8 | 3.4 | 3.7 | 0.4 |
| Italy | 1.3 | 4.2 | 5.6 | 1.2 |
| Spain | 3.2 | 5.0 | 4.9 | 0.5 |
Notable moves
- Italy jumped 1.4 points to 5.6%, with a monthly rate of +1.2%.
- Belgium rose from 4.5% to 5.2% (monthly +1.1%); Greece from 5.1% to 5.7%; the Netherlands from 3.0% to 3.3%.
- Germany fell to 2.9%, the only one of the four to ease; Luxembourg (5.2% to 4.9%) and Slovakia (3.0% to 2.9%) also declined.
Our reading
The release gives no explanation for the country differences. Interpretation (ours): the 4.0% average blends sharp increases in some countries with declines in others, so national experiences can differ widely from the aggregate. Italy’s monthly jump is a single observation. Because one ECB policy rate applies to all euro members, dispersion is a standing issue in euro area analysis, although this release itself makes no policy statement.
速報から確報へ:改定の中身と次の確認点
Flash versus full release
| Flash (4 Nov) | Full (18 Nov) | |
|---|---|---|
| Euro area HICP, annual | 4.0% | 4.0% |
| Energy, annual | 20.8% | 21.0% |
The headline was unchanged at 4.0%; only energy was finalised 0.2 points higher. Eurostat explains that Germany revised its data for ‘natural gas through networks’ for September, which lifted the euro area energy figure for September from 18.9% to 19.0% and its contribution from 1.71 pp to 1.72 pp. September’s headline of 3.8% was not affected.
Balance of the release
- Pressure: 4.0% is the highest rate in the table’s window; sixteen Member States saw rises; core edged up to 2.6%; unprocessed food accelerated to 4.6%.
- Restraint: ex-energy inflation held at 2.3%; processed food was 0.4%; nine Member States saw declines; energy’s acceleration slowed from September.
What to watch next
The next flash estimate, for November 2026, is scheduled for 1 December 2026. Key checkpoints:
- Whether annual energy inflation stays above or falls below 21.0%.
- Whether core (2.6%) and services (3.3%) stay in their recent ranges.
- Whether the number of Member States with rising inflation grows.
Context for global readers
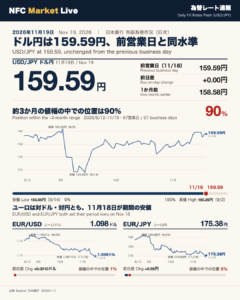
The ECB targets 2% inflation over the medium term. This release does not discuss policy, so any implications for ECB decisions, the euro or EUR/JPY lie outside the document. As an interpretation, an unrevised headline suggests the flash already captured the October picture, and the open question is whether energy-led inflation spreads to other components.
Disclaimer: This article is for informational purposes only. All investment decisions are made solely at your own risk.