This article was automatically generated by the NFC Market Live AI analysis system. (Updated: 2026-11-17 22:45 JST)
📄 Primary Source
U.S. Census Bureau
https://www.census.gov/retail/marts/www/marts_current.pdf
📊 A breakdown of the U.S. Census Bureau’s October retail sales advance estimate, released November 17.
📈 Sales were $748.2 billion, up 0.2% m/m, but the 90% confidence interval includes zero. Year over year, sales rose 6.8%.
📉 Motor vehicle and parts dealers fell 1.6% m/m, while sales excluding autos rose 0.6%. Gasoline stations were up 30.3% y/y; excluding them, total sales rose 4.9%.
💡 September’s +0.8% was unrevised. Watch the November advance report and revised October figures on December 16. Figures are nominal.
今回の発表のポイント
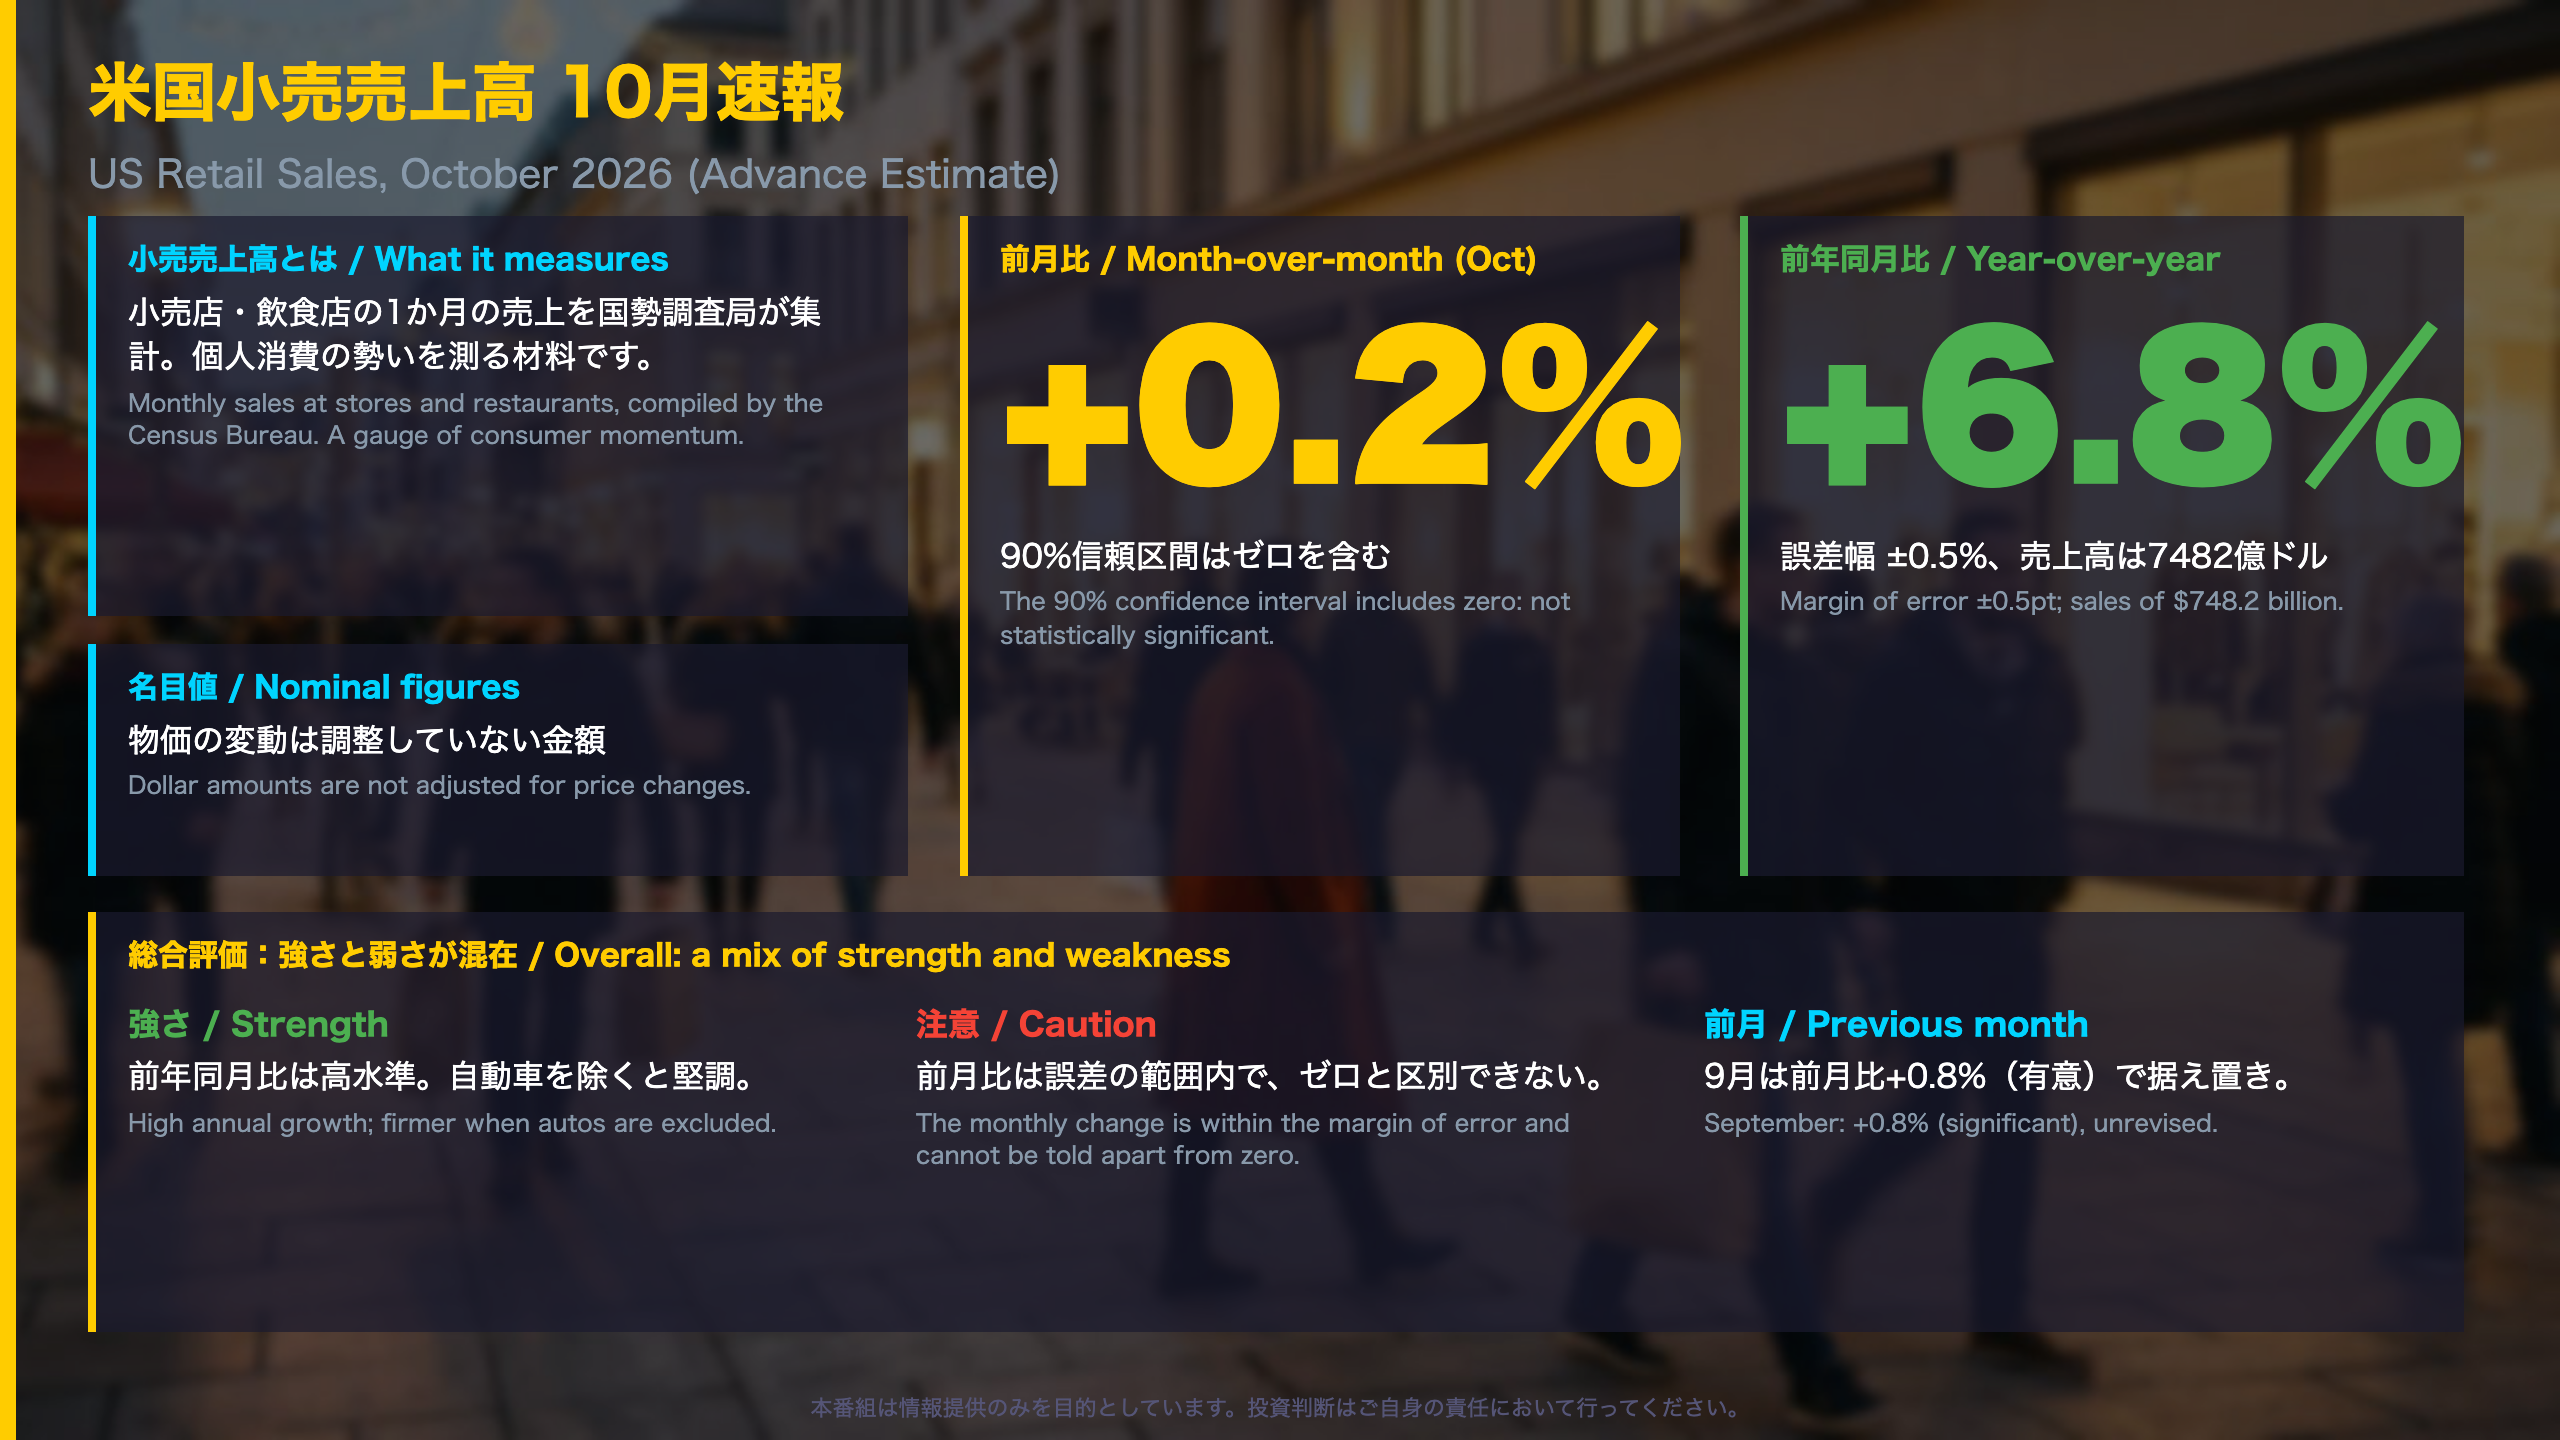
What the October Retail Sales Report Measures
The Advance Monthly Retail Trade Survey is the U.S. Census Bureau’s first read on sales at retailers and restaurants. It samples roughly 4,800 firms, weighted to represent more than three million businesses, and is published in the middle of the following month. The figures are seasonally adjusted but not adjusted for price changes, so they are nominal measures.
Headline read
- October: $748.2 billion, +0.2% m/m (±0.4%), +6.8% y/y (±0.5%).
- The m/m confidence interval (about -0.2% to +0.6%) includes zero. The Census Bureau states there is “insufficient statistical evidence to conclude that the actual change is different from zero.”
- September’s +0.8% (±0.2%) was left unchanged, while its level was revised up to $746.6 billion from $745.0 billion.
Why the distinction matters
The significance flag is part of the release itself. A small monthly move inside the error band should not be read as a turn in consumer demand, whereas the year-on-year gain is clearly positive. One caution: the y/y gap between September (6.6% revised) and October (6.8%) is smaller than the stated ±0.5-point margin, so it does not show acceleration.
International context
Japan’s equivalent retail statistics are also published by a government ministry, but the U.S. series is a sample-based advance estimate that is routinely revised, which is why the report includes a revision table.
Market context (general)
The report contains no statement on monetary policy, currencies or equities. As a general matter, nominal retail sales are one of several inputs used to gauge consumer spending and are normally read alongside price and labor data not covered here.
Next release: December 16, 2026, 8:30 a.m. ET (November advance).
自動車の落ち込みと、それ以外の底堅さ
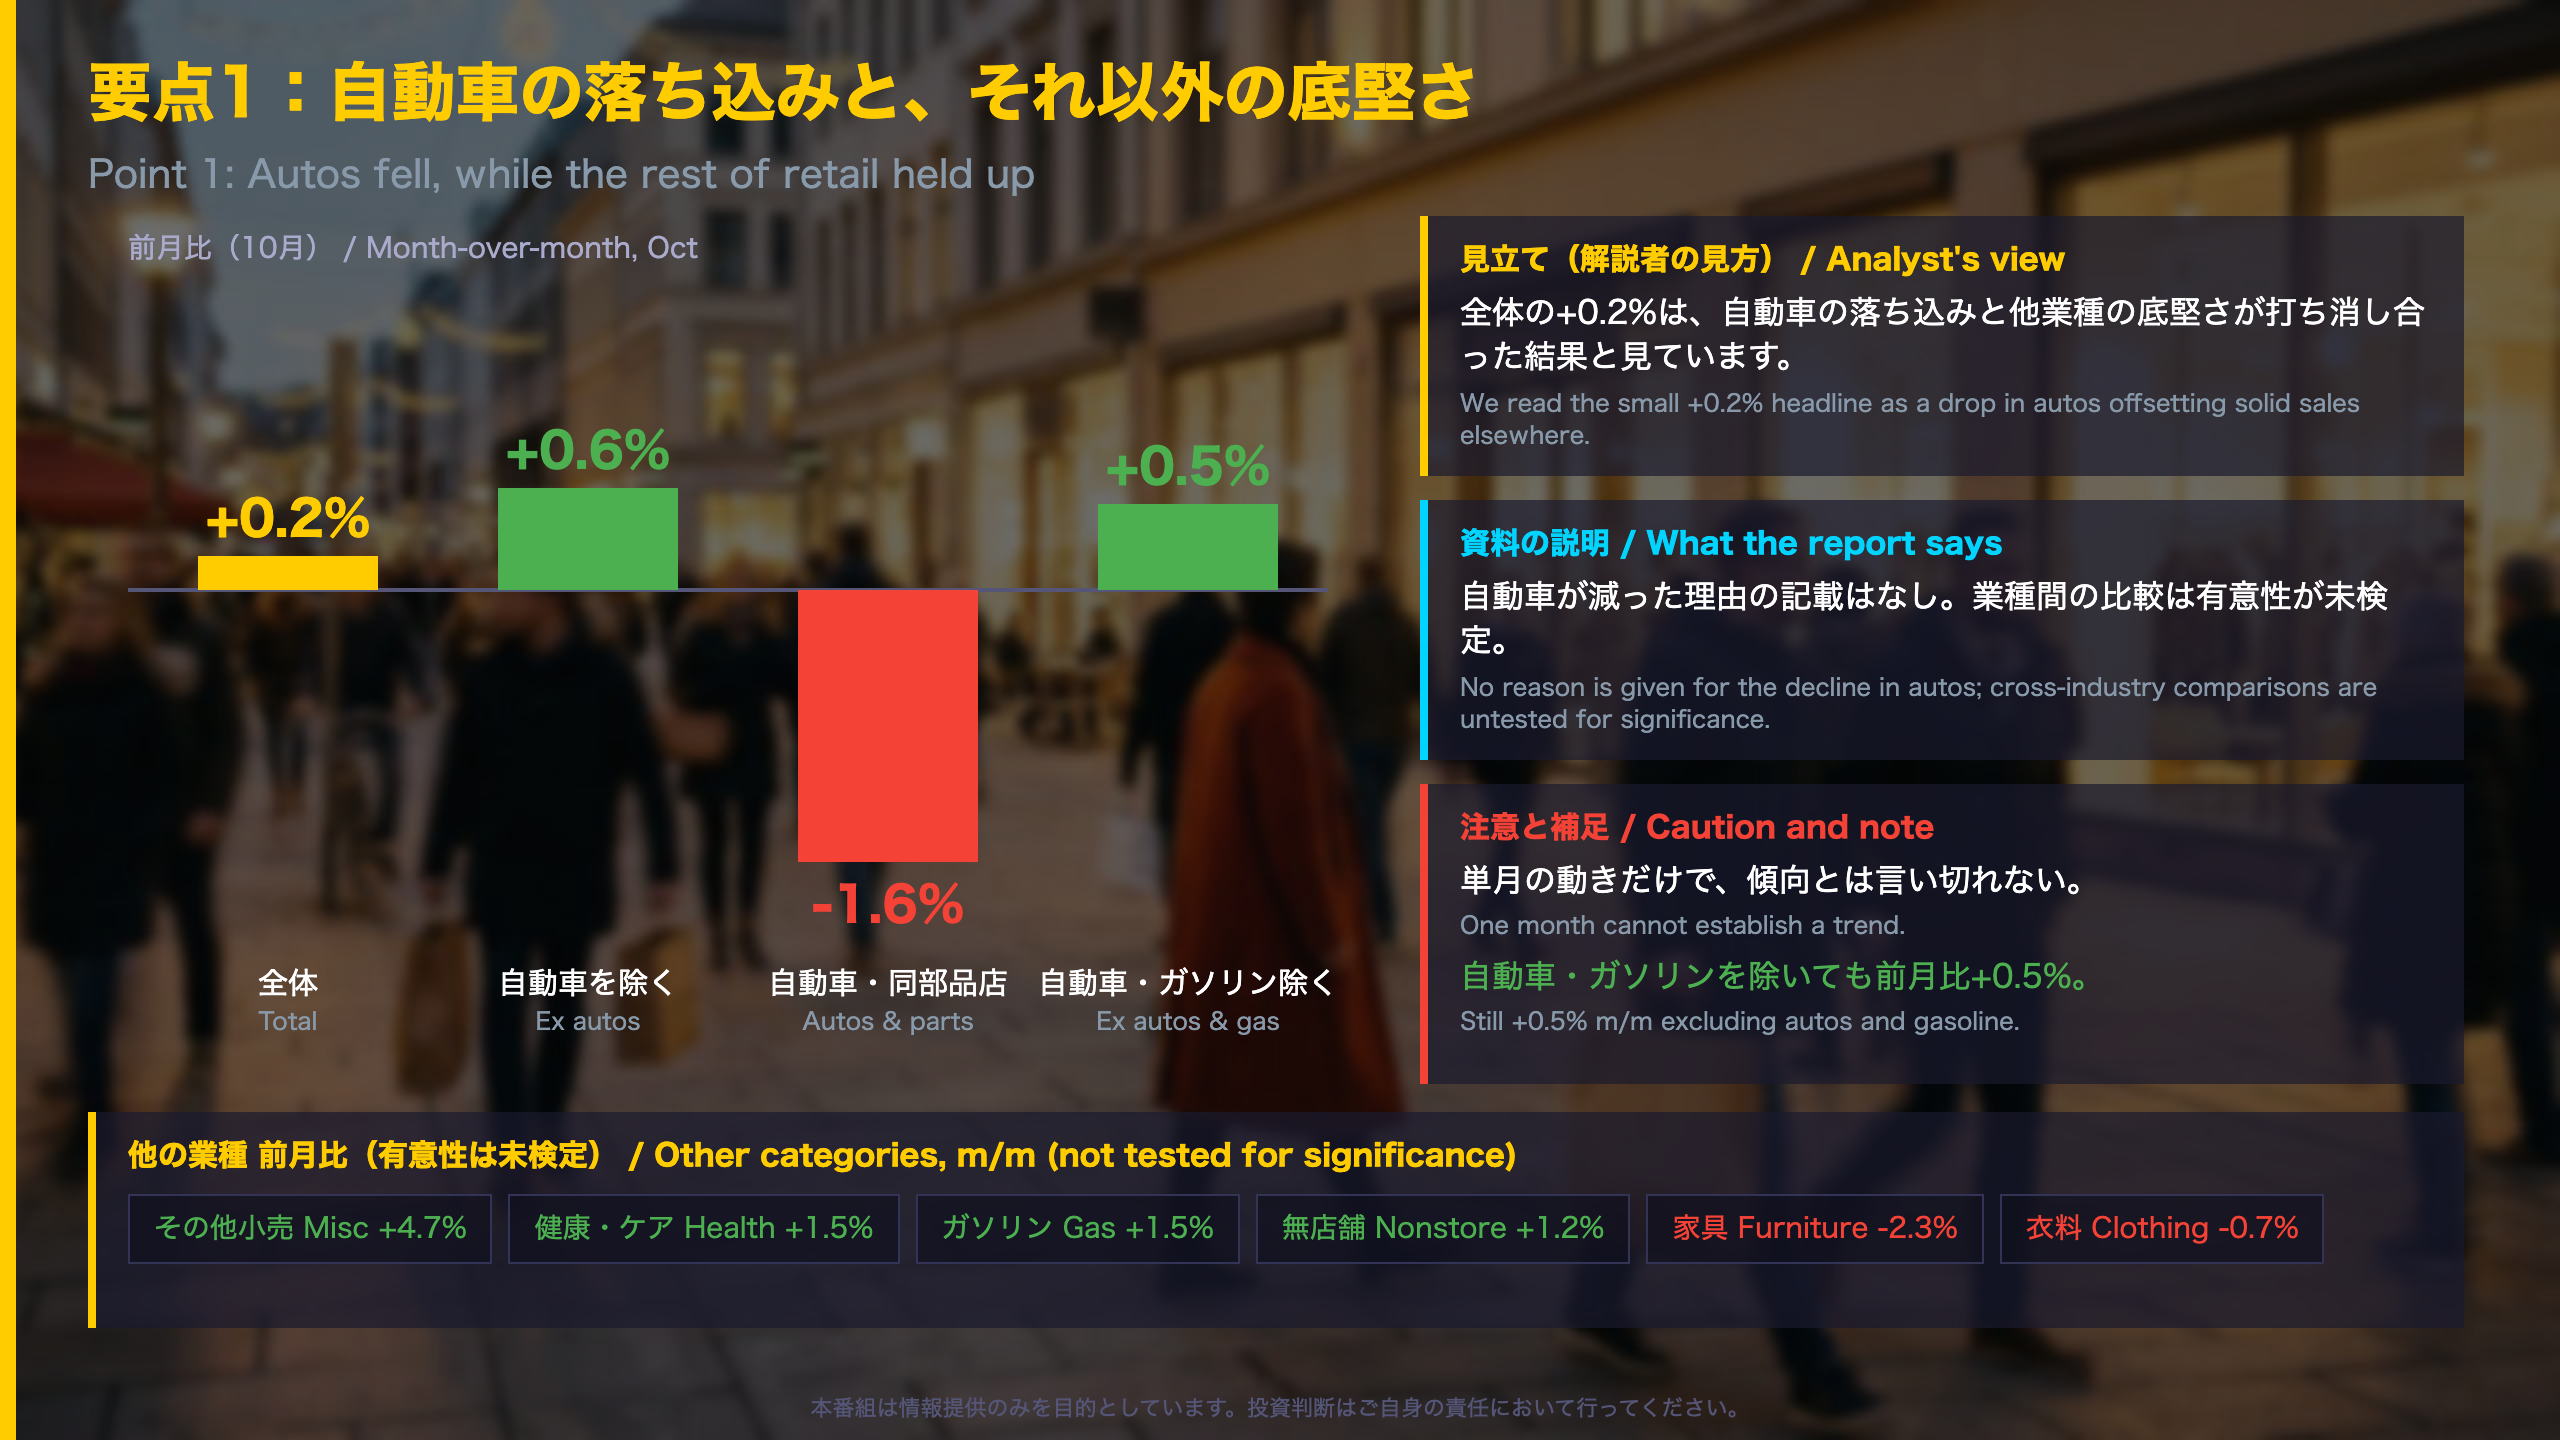
Autos Fell, the Rest Held Up
Reading the composition (October, m/m)
| Category | m/m | y/y |
|---|---|---|
| Total | +0.2% | +6.8% |
| Excl. motor vehicle & parts | +0.6% | +8.1% |
| Motor vehicle & parts dealers | -1.6% | +1.3% |
| Excl. autos and gasoline | +0.5% | +5.9% |
The headline is a small number made of offsetting parts. The same release shows miscellaneous retailers up 4.7%, health and personal care up 1.5%, nonstore retailers up 1.2%, furniture down 2.3% and clothing down 0.7%.
Why caution is warranted
The Census Bureau notes that “comparisons across industries have not been tested for significance.” Sampling noise at the industry level is also much larger than for the total: the median standard error for the m/m change is 0.2 points for total sales but 0.7 for motor vehicles, 1.5 for furniture and 2.2 for miscellaneous retailers.
Two readings
- Constructive: sales excluding autos and gasoline still rose 0.5%, which does not look like a broad pullback.
- Cautious: autos are up only 1.3% y/y versus 6.8% for the total, and several discretionary categories fell m/m. None of these industry moves is tested for significance.
Context for non-U.S. readers
In the U.S. series, “ex-autos” is a standard cut because vehicle sales are large and volatile. The report itself offers no reason for October’s decline.
Next check: the December 16 release of the November advance report.
前年同月比+6.8%の中身
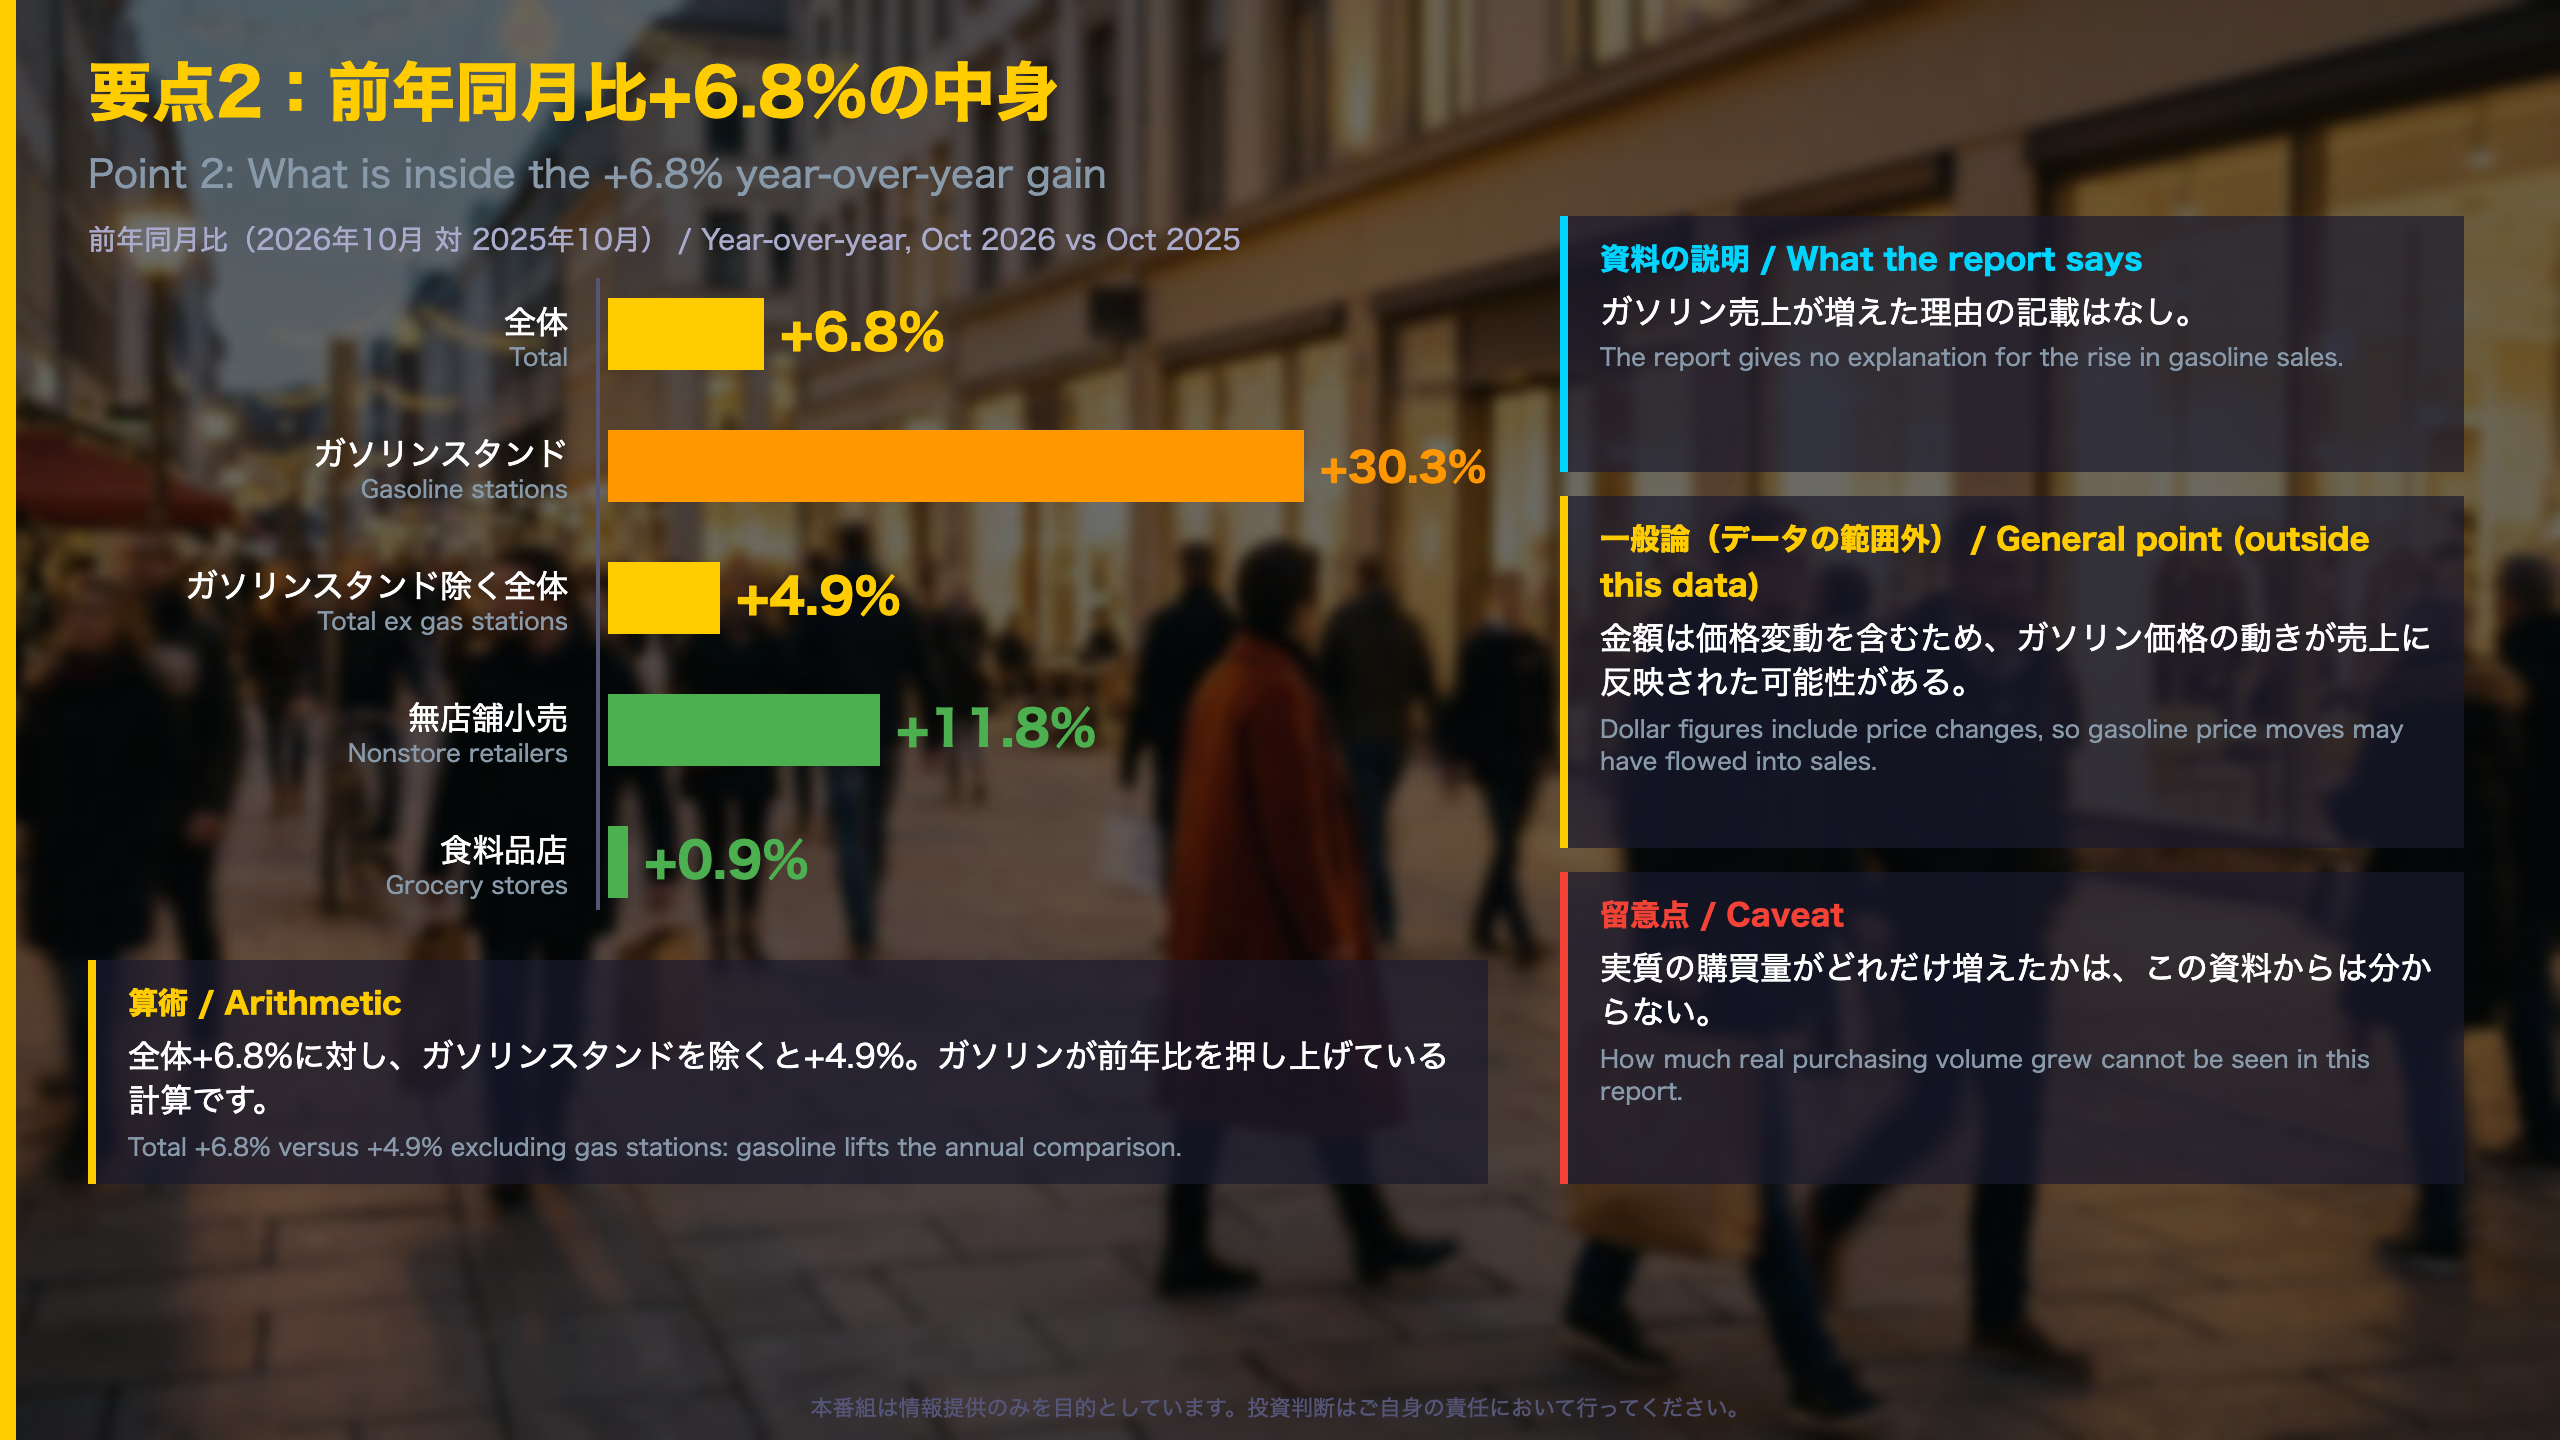
Decomposing the +6.8% Year-over-Year Gain
Where the annual growth sits (October y/y, nominal)
| Industry | y/y |
|---|---|
| Gasoline stations | +30.3% |
| Miscellaneous retailers | +13.3% |
| Nonstore retailers | +11.8% |
| Electronics & appliances | +7.7% |
| Food services | +7.0% |
| Grocery stores | +0.9% |
| Department stores | -1.6% |
Total sales are up 6.8% y/y. Excluding gasoline stations the figure is 4.9%; excluding autos and gasoline it is 5.9%. Gasoline stations account for roughly 9% of total sales ($68.6 billion of $748.2 billion, our calculation from the tables), so a 30.3% rise there matters arithmetically.
What the report does and does not say
The release is silent on why gasoline sales rose. The figures are not adjusted for price changes, so, as a general point outside this data, fuel price moves can flow directly into nominal sales. Real purchasing volume cannot be inferred from this report.
Two readings
- Constructive: all 13 major industries show positive y/y growth in nominal terms, and nonstore retailers are up double digits.
- Cautious: grocery (+0.9%), health (+1.0%) and autos (+1.3%) are modest, and part of the headline reflects gasoline.
Discipline on comparisons
September’s revised y/y (6.6%) and October’s (6.8%) differ by less than the ±0.5-point margin, so we do not describe acceleration. Industry-level comparisons are untested for significance.
Market context (general)
The report contains no policy or market information. Nominal y/y growth alone does not separate price from volume effects.
Next: the November advance report on December 16.
質疑で深める
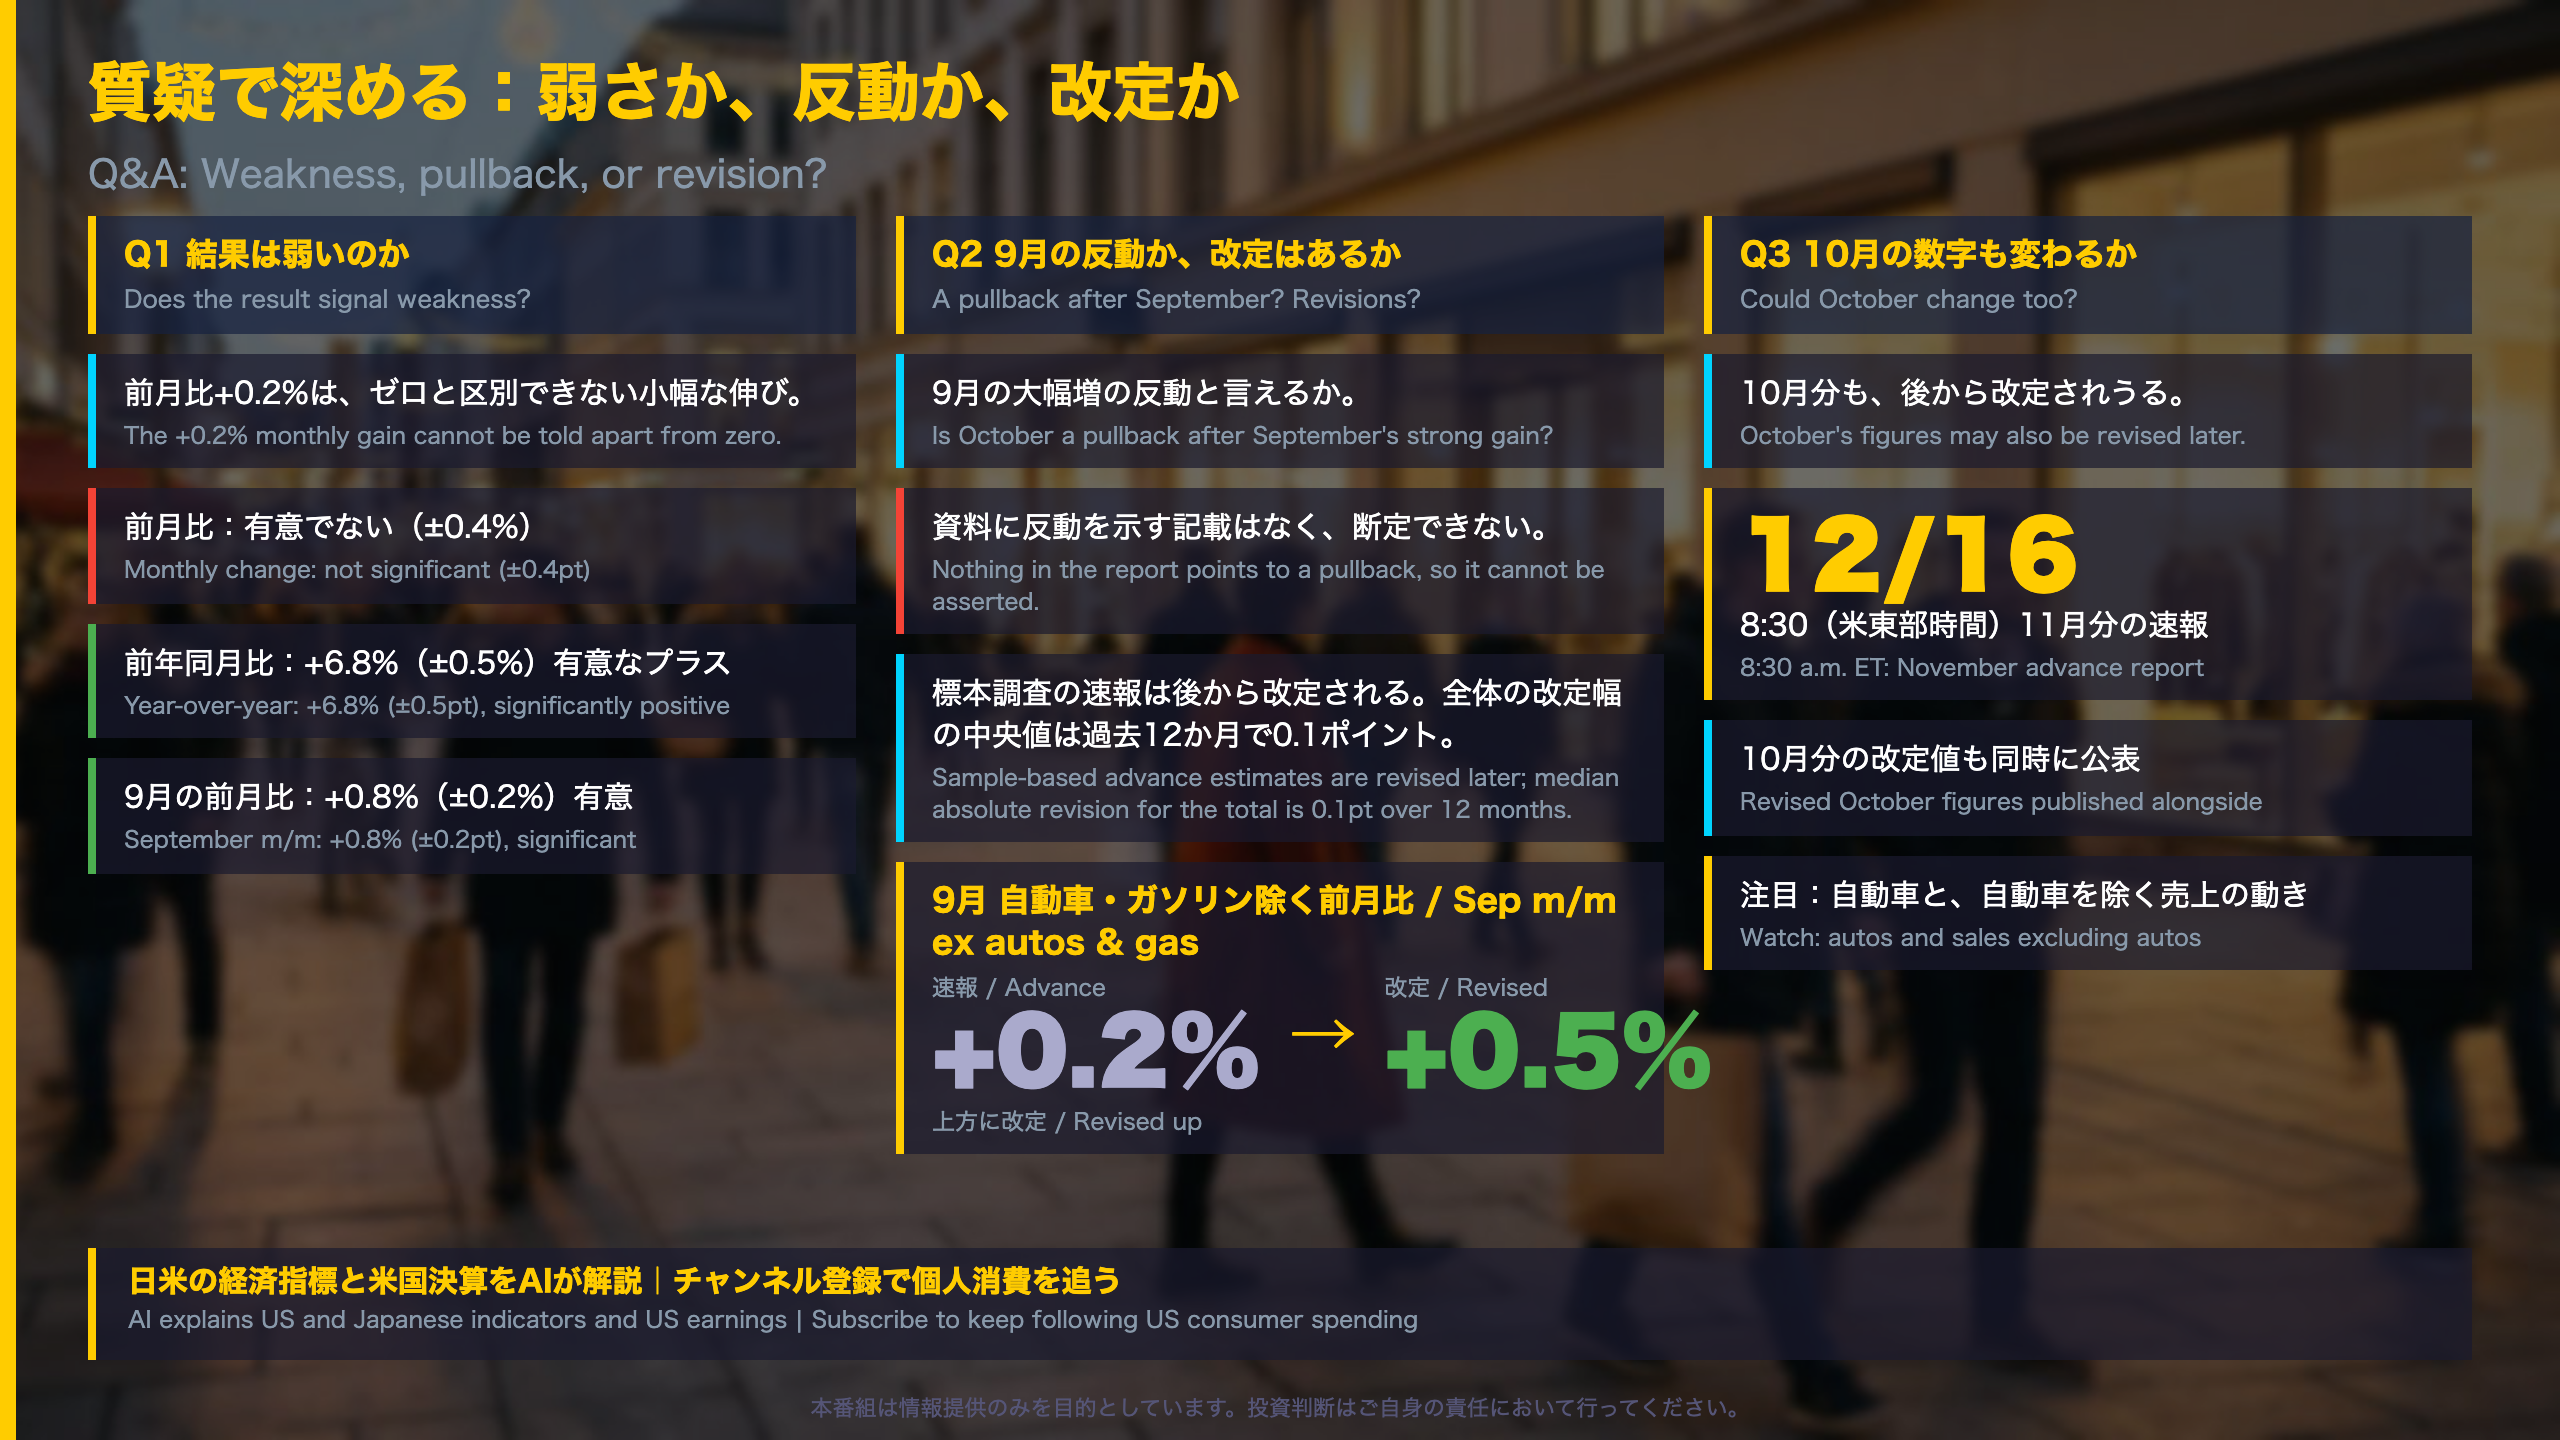
Revisions and Significance: How to Treat the October Number
How advance estimates have been revised
| Item | Prior report (advance) | This report (revised) |
|---|---|---|
| September sales | $745.0B | $746.6B |
| August sales | $739.3B | $740.5B |
| September m/m (total) | +0.8% | +0.8% (unrevised) |
| September m/m (ex autos & gas) | +0.2% | +0.5% |
Table 3 shows the median absolute revision to the total’s month-to-month change over the past 12 months is 0.1 point. The 0.3-point upward revision to September’s ex-autos-and-gas change was larger than that benchmark for the total series.
Why not call it a pullback?
It is tempting to say October was soft because September was strong. The report offers no support for that. October’s m/m change is not statistically significant, and there is no run of significant same-direction changes to call a trend, so we avoid asserting a payback effect.
Two readings
- Constructive: the +6.8% y/y gain is clearly positive, and September’s +0.8% m/m was significant.
- Cautious: October’s m/m change is not significant, industry moves are untested, and advance numbers can move.
Context for non-U.S. readers
The U.S. advance report is built from about 4,800 firms and later benchmarked to the Annual Integrated Economic Survey, which is why revisions are routine. The prior report also noted historical revisions published on September 28.
Market context (general)
The release contains no policy or market commentary. Revision size and significance are the statistical lens through which the number should be read.
Next
December 16, 8:30 a.m. ET: the November advance report plus revised October data. Check whether the m/m interval excludes zero, how large the October revision is, and what autos and ex-autos sales do.
Disclaimer: This article is for informational purposes only. All investment decisions are made solely at your own risk.