This article was automatically generated by the NFC Market Live AI analysis system. (Updated: 2026-11-17 00:12 JST)
📄 Primary Source
Banco Central do Brasil
https://api.bcb.gov.br/dados/serie/bcdata.sgs.24364/dados#01/09/2026
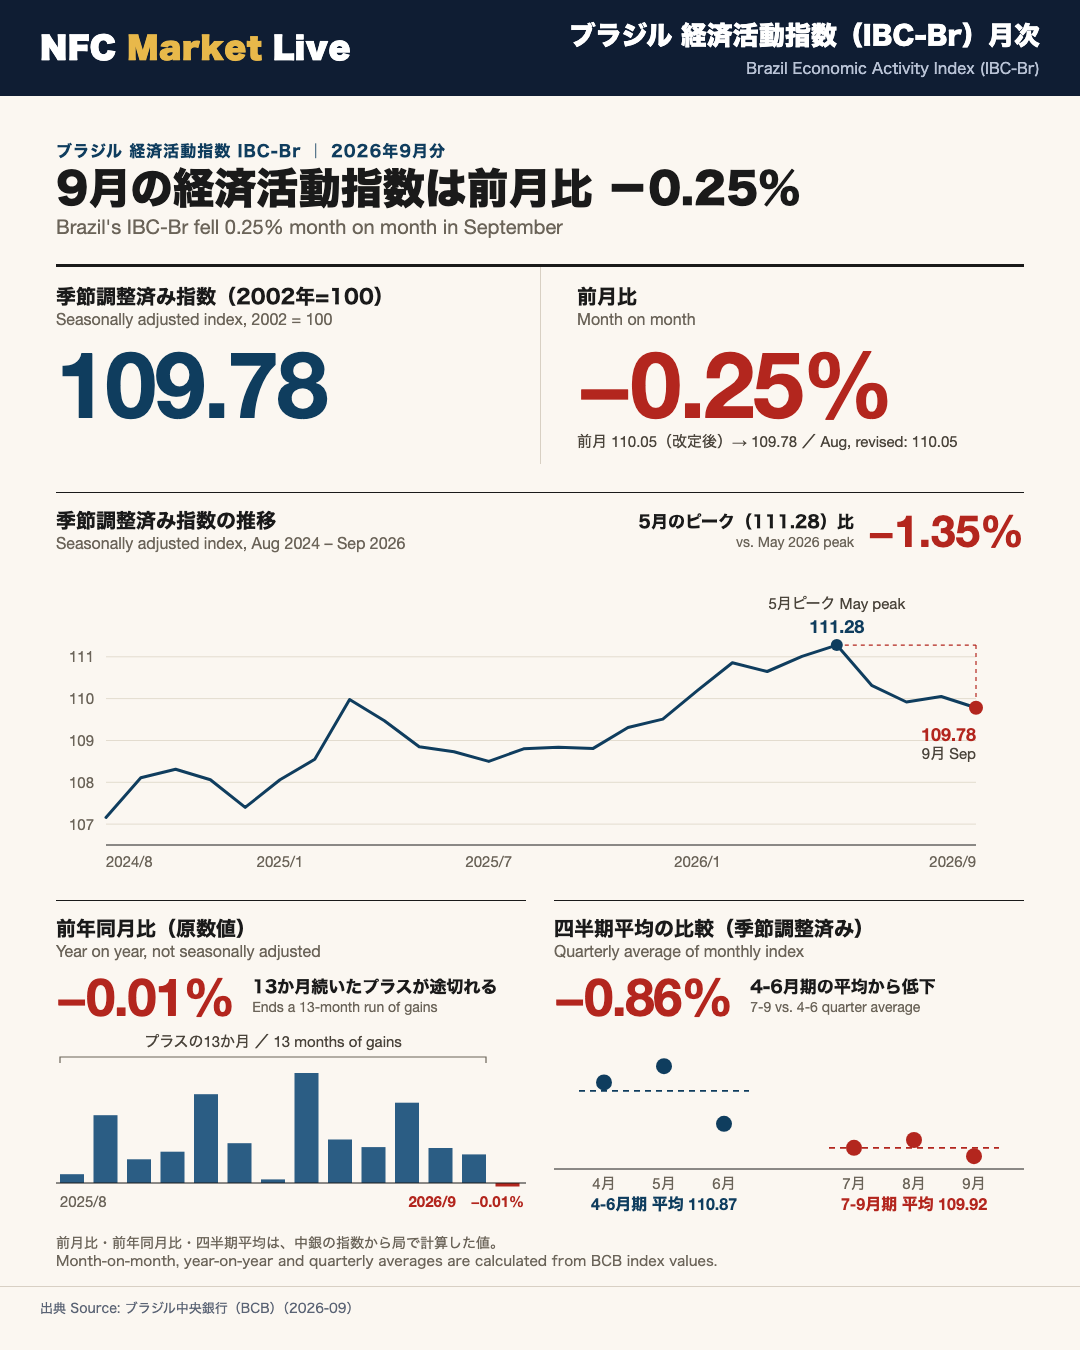
Brazil’s central bank (BCB) economic activity index (IBC-Br, 2002 = 100) for September 2026 stood at 109.78 on a seasonally adjusted basis, down 0.25% from August (our calculation from the BCB index). August was revised to 110.05 (+0.12% m/m) from 110.41 (+0.34%) in the previous release.
On the unadjusted series, year-on-year growth was -0.01%, ending a run of 13 positive readings visible in the table (August 2025 to August 2026). By contrast, the seasonally adjusted level is 0.86% above September 2025 (our calculation), so the picture depends on the comparison basis.
Recent monthly changes: July -0.36%, August +0.12%, September -0.25%. September’s level is the lowest since December 2025 (109.51), though monthly moves stayed within ±0.4%. The July-September monthly average is 0.86% below April-June (our calculation).
The source lists the Selic target at 13.75% as of 17 Nov 2026 and an IPCA target of 3% with a ±1.5-point band.
9月のIBC-Br:季節調整済みで前月比-0.25%
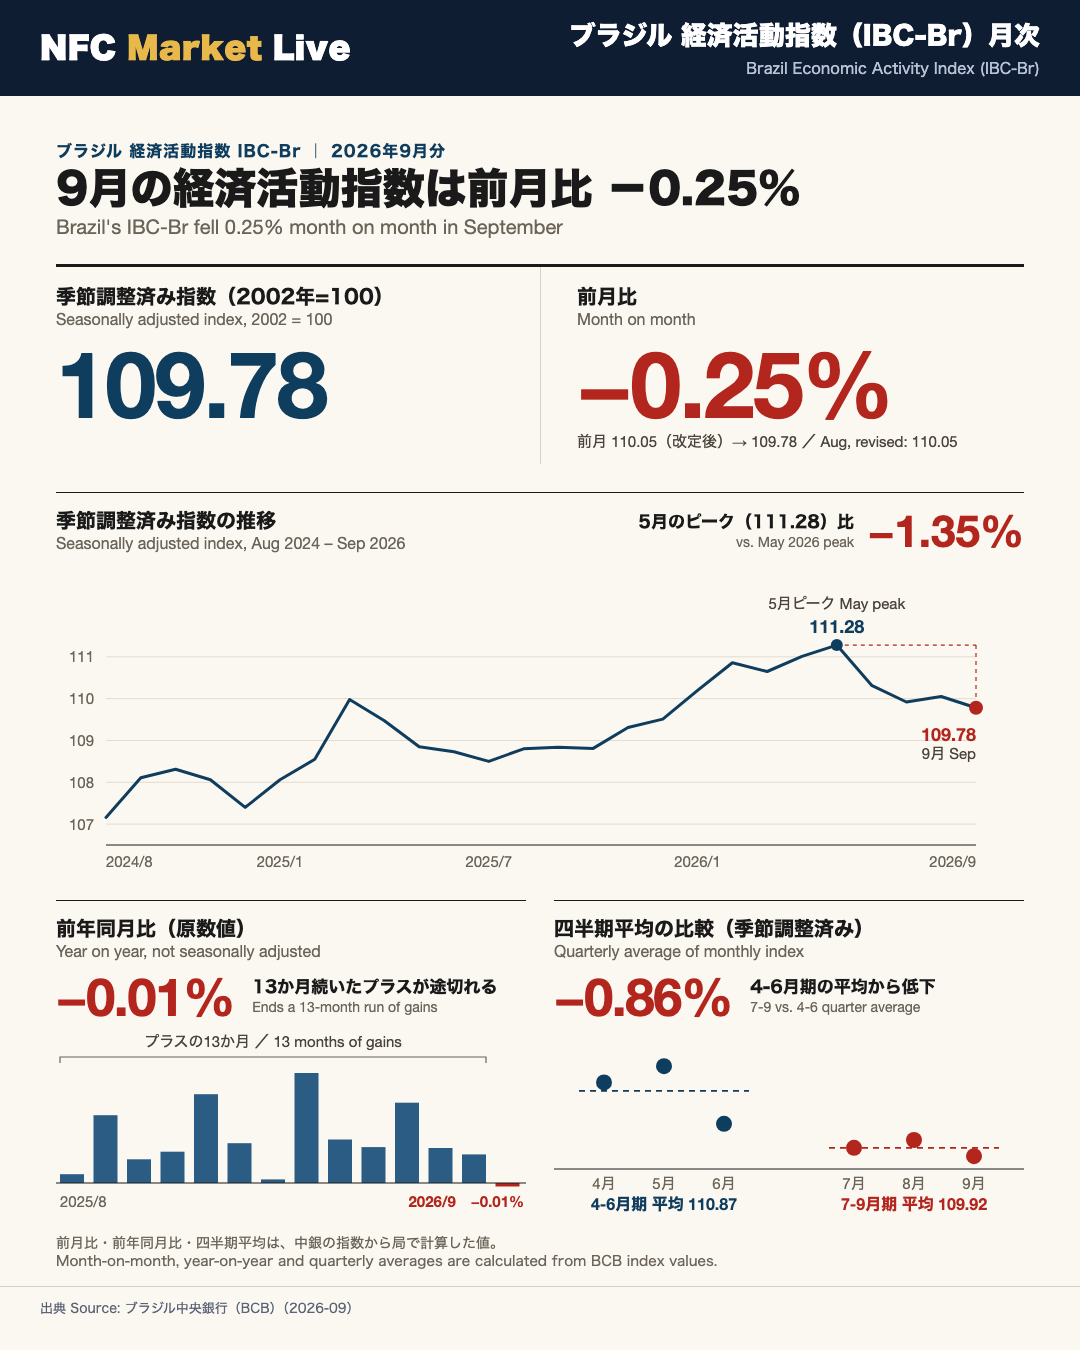
Brazil’s IBC-Br: September down 0.25% month on month
The Central Bank of Brazil (BCB) publishes the IBC-Br, a monthly economic activity index (2002 = 100). In the seasonally adjusted series, September 2026 came in at 109.78, down 0.25% from a revised 110.05 in August. Month-on-month and year-on-year changes here are our own calculations from the BCB index levels.
Last three months (seasonally adjusted, our calculation)
- July: 109.92 (-0.36%)
- August: 110.05 (+0.12%)
- September: 109.78 (-0.25%)
Strengths
- Against September 2025 (108.84), the seasonally adjusted level is 0.86% higher.
- From January to May 2026 the index rose in four of five months.
Weaknesses
- 109.78 is the lowest level since December 2025 (109.51) within the table provided.
- Declines in June (-0.86%), July and September mean the index has slipped from its May peak of 111.28, a 1.35% drop.
Context for readers outside Brazil
Unlike a headline growth rate such as US GDP, the IBC-Br is published as an index level, so changes must be computed from the levels. The BCB’s source note lists the policy rate (Selic) target at 13.75% as of 17 Nov 2026, the same figure as in the previous release. This programme does not forecast BCB decisions or currency moves.
前年同月比は-0.01%:13か月続いたプラスが途切れる
Year-on-year: -0.01%, ending a 13-month run of gains
On the unadjusted (raw) series, September 2026 stood at 109.43 versus 109.44 a year earlier, a year-on-year change of -0.01% (our calculation). Within the table, every month from August 2025 to August 2026 (13 months) showed positive year-on-year growth.
Raw year-on-year, 2026 (our calculation)
- Jan +1.31% / Feb +0.12% / Mar +3.62% / Apr +1.43%
- May +1.18% / Jun +2.64% / Jul +1.15% / Aug +0.94% (revised) / Sep -0.01%
Two readings
- Cautious: this is the first non-positive year-on-year reading in the table.
- Balanced: February 2026 was also near zero (+0.12%) and March reached +3.62%, so raw year-on-year figures swing widely from month to month. A single month is weak evidence of a turn (a low-confidence inference).
Note also that the seasonally adjusted level is 0.86% above a year earlier, versus -0.01% on the raw series. The source does not explain the gap, so we simply flag that the comparison basis matters.
Revision note
August’s year-on-year figure was revised from +1.21% to +0.94% between releases. September may likewise be revised in later releases, since the BCB restates past values with each publication.
改定と直近の推移:8月の上昇幅が+0.34%から+0.12%へ
Revisions: August’s gain cut from +0.34% to +0.12%
Comparing this release with the previous one (data as of 8 Nov 2026), most recent months were revised down.
| Month | Previous index | Current index | MoM, previous → current (our calc.) |
|---|---|---|---|
| May 2026 | 111.25 | 111.28 | +0.19% → +0.24% |
| Jun 2026 | 110.37 | 110.32 | -0.79% → -0.86% |
| Jul 2026 | 110.03 | 109.92 | -0.31% → -0.36% |
| Aug 2026 | 110.41 | 110.05 | +0.34% → +0.12% |
Takeaways
- August’s level fell 0.36 index points, so the rebound that looked clearer last time is now smaller.
- May was revised up slightly, so not every month moved lower.
- Revisions can flip signs further back: September 2025 went from -0.12% to +0.04%, and October 2025 from +0.02% to -0.03%. Small monthly moves should therefore be read with care.
Two views
- Weaker: the July-September levels (109.92, 110.05, 109.78) sit below the April-May readings of about 111, and the revisions went down.
- Steadier: monthly changes in July-September were all within ±0.4%, which can be read as a plateau around 110 rather than a sharp fall (an inference from several months of data).
The source gives no reason for the revisions, so none is offered here.
7-9月期の水準と、強さ・弱さの整理
Quarterly view and the balance of strengths and weaknesses
Quarter averages (our simple average of monthly seasonally adjusted data)
- Q2 2026 (Apr-Jun): about 110.87
- Q3 2026 (Jul-Sep): about 109.92
- Change: -0.86%
These are reference figures computed by us, not official quarterly values from the BCB.
| Strengths | Weaknesses |
|---|---|
| Seasonally adjusted level +0.86% vs a year earlier | September’s 109.78 is the lowest since Dec 2025 in the table |
| Index rose in four of five months, Jan-May 2026 | Q3 average is 0.86% below Q2 |
| Monthly changes in Jul-Sep within ±0.4% | Raw year-on-year at -0.01%, ending 13 months of gains |
Source premises
The inflation target is 3% for IPCA year-on-year with a tolerance band of 1.5 percentage points, set by the National Monetary Council (CMN) and operated by the BCB. The Selic target is listed at 13.75% as of 17 Nov 2026.
What to check next
Whether the October 2026 reading moves above the Q3 average (about 109.92), and how September itself is revised. We make no forecast of BCB policy or the Brazilian real.
Disclaimer: This article is for informational purposes only. All investment decisions are made solely at your own risk.