This article was automatically generated by the NFC Market Live AI analysis system. (Updated: 2026-11-16 07:06 JST)
Weekly global bond data compiled on November 16, 2026.
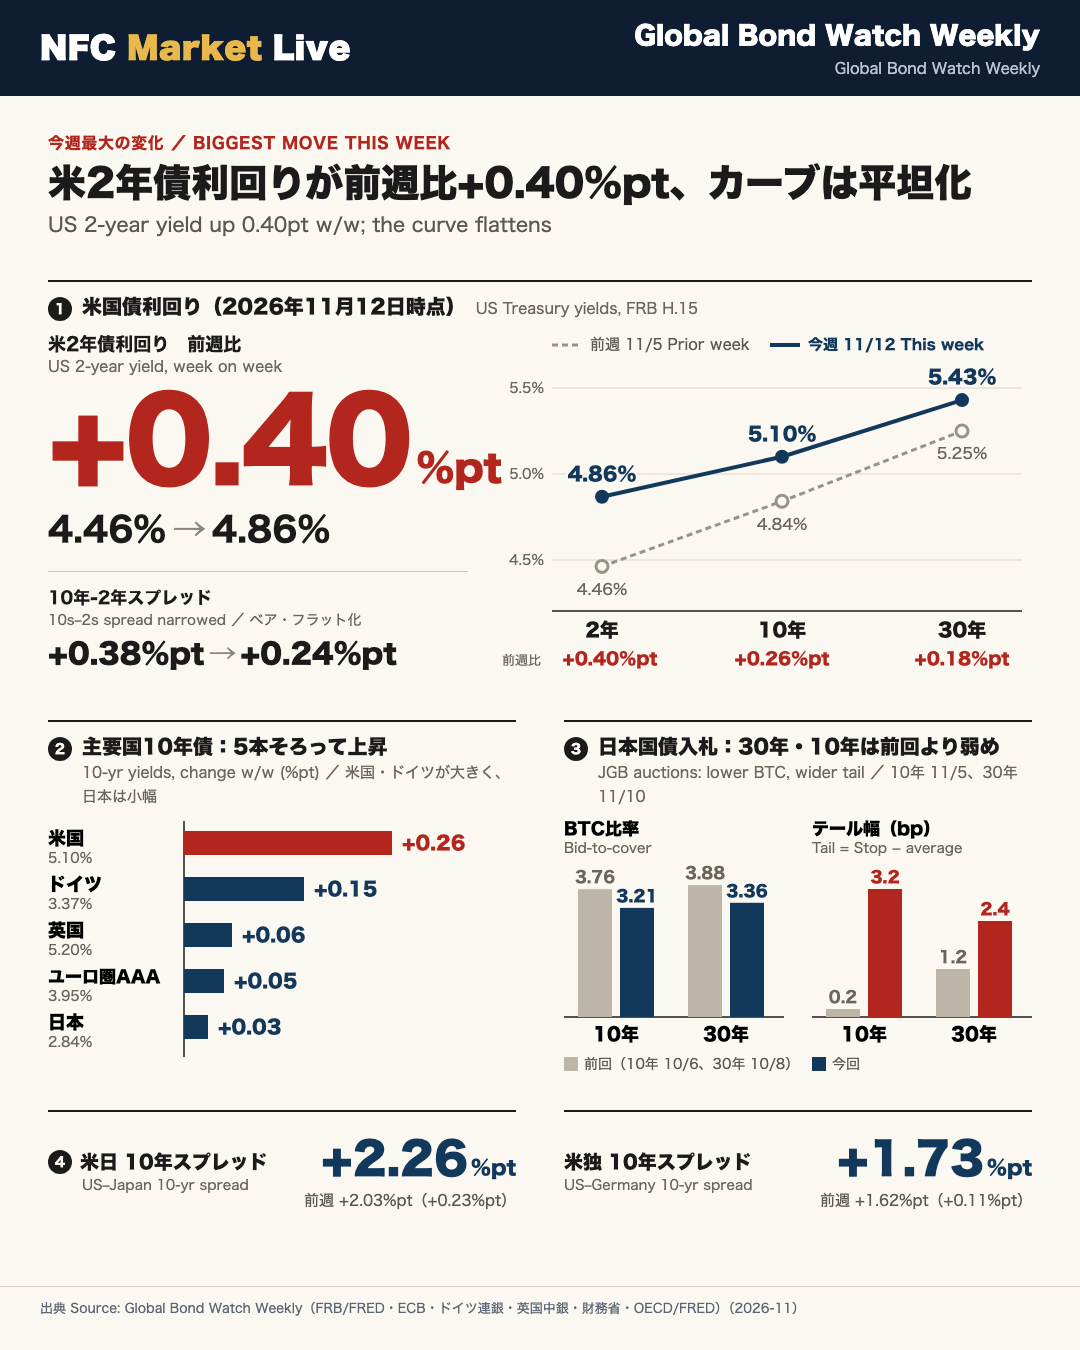
US: As of November 12, Treasury yields were 4.86% (2-year), 5.10% (10-year) and 5.43% (30-year), versus 4.46%, 4.84% and 5.25% a week earlier. Shorter maturities rose more, and the 10-year minus 2-year spread narrowed from +0.38pt to +0.24pt.
Europe: The euro-area AAA 10-year yield was 3.95% (prior week 3.90%). The German 10-year was 3.37% as of November 13 (prior 3.22%), and the UK 10-year was 5.20% as of November 11 (prior 5.14%).
Japan: As of November 12, JGB yields were 1.86% (2-year, unchanged), 2.84% (10-year) and 3.97% (30-year). The US-Japan 10-year spread widened from +2.03pt to +2.26pt, and the US-Germany spread from +1.62pt to +1.73pt. The BOJ policy rate was 1.04% as of September 2026.
JGB auctions: the November 10 30-year auction had a bid-to-cover of 3.36 (3.88 on October 8), and the November 12 5-year auction 3.67 (3.56 on October 14).
Sources: FRB/FRED, ECB, Bundesbank, BoE, MOF Japan, OECD/FRED
グローバル金利スナップショット / Global Rate Snapshot
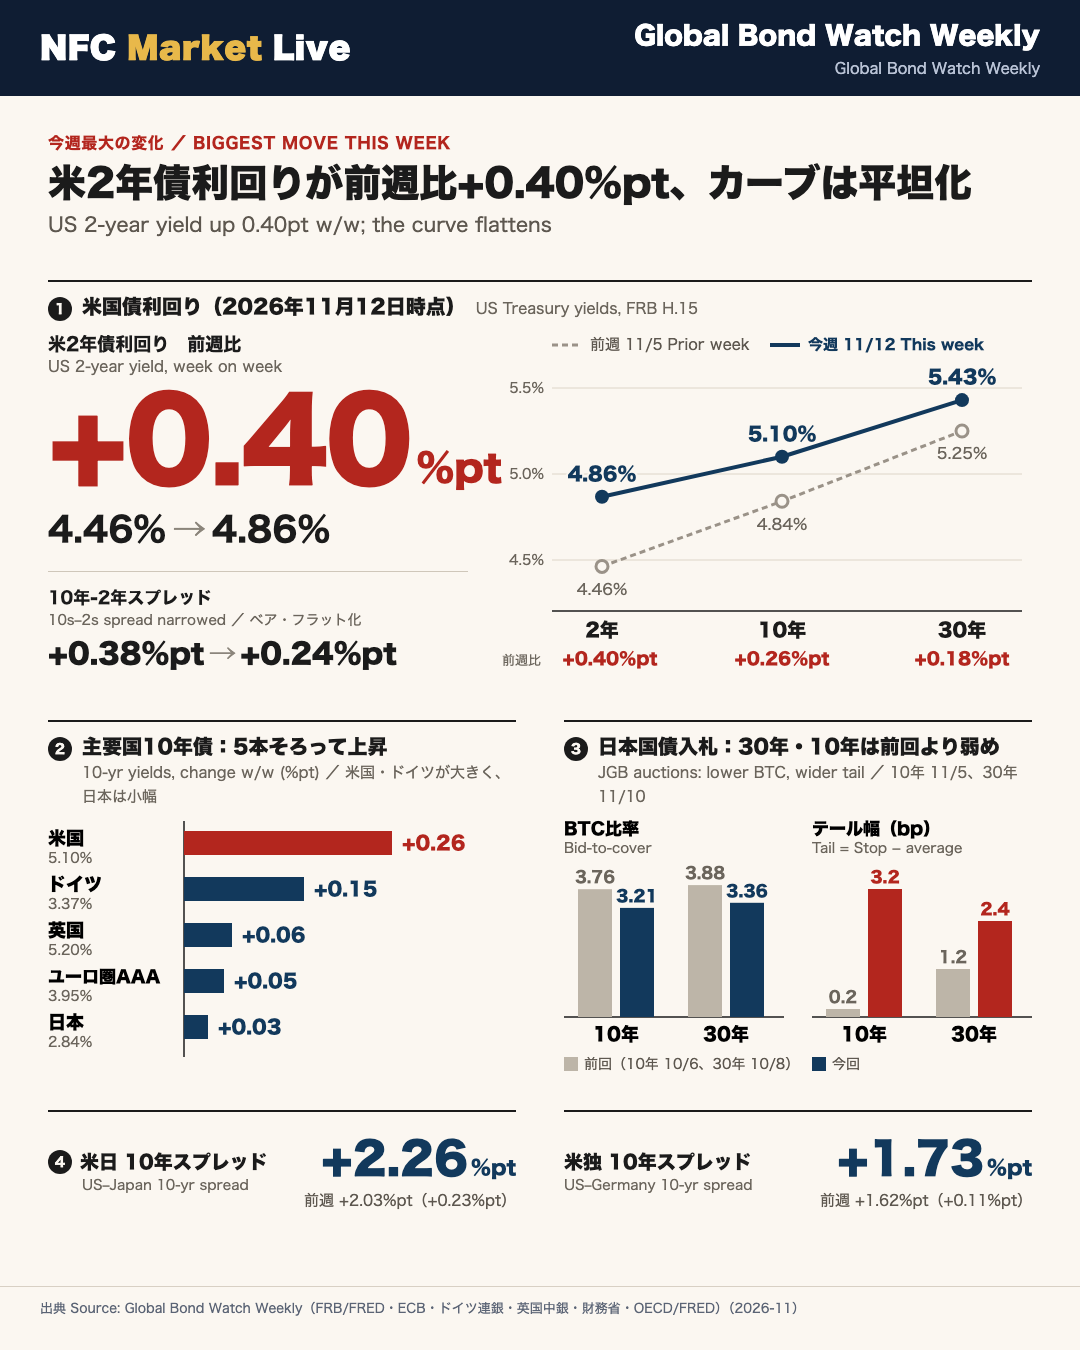
Biggest move this week: the US 2-year yield rose 0.40 percentage points week on week
According to the Federal Reserve’s H.15 series (via FRED, St. Louis Fed), US Treasury yields as of November 12, 2026 were 4.86% (2-year), 5.10% (10-year) and 5.43% (30-year). A week earlier (November 5) they were 4.46%, 4.84% and 5.25%. The shorter the maturity, the bigger the rise: +0.40pt, +0.26pt and +0.18pt. The 10-year minus 2-year term spread narrowed from +0.38pt to +0.24pt. Bond traders call this a bear flattening: yields rise while the curve gets flatter.
10-year yields across markets
| Market | This week | Prior week | Change |
|---|---|---|---|
| US (Nov 12) | 5.10% | 4.84% | +0.26pt |
| Japan (Nov 12) | 2.84% | 2.81% | +0.03pt |
| Germany (Nov 13) | 3.37% | 3.22% | +0.15pt |
| UK (Nov 11) | 5.20% | 5.14% | +0.06pt |
| Euro area AAA (Nov 12) | 3.95% | 3.90% | +0.05pt |
Context for readers outside Japan
The Japanese figures come from the Ministry of Finance (MOF), which publishes daily JGB yields. Euro-area AAA yields come from the ECB’s yield-curve statistics. French and Italian 10-year yields (4.48% as of September 2026 and 3.99% as of August 2026) are monthly OECD series, so they are not comparable with the daily data.
Reading the data with care
- All five 10-year yields rose, which points in a common direction. The size of the move differs, though: the US and Germany rose most and Japan only slightly.
- Observation dates differ by one to two days between markets.
- This is a one-week change. It does not by itself establish a trend.
Sources: FRB/FRED, ECB, Deutsche Bundesbank, Bank of England, MOF Japan, OECD/FRED.
米国債入札 Deep Dive / US Treasury Auction
US Treasury auction data were not available in this week’s source files
In both this week’s and last week’s reports, the nominal Treasury auction table sourced from TreasuryDirect shows ‘data retrieval failed’. The bid-to-cover ratio, high yield, indirect bidder share and offering size are therefore unavailable, and this article does not assess auction demand with numbers.
How to read a Treasury auction result
- Bid-to-cover ratio: total bids divided by the amount accepted. A higher ratio indicates deeper demand.
- Indirect bidders: a category that includes foreign central banks and other institutions bidding through intermediaries. It is widely used as a gauge of overseas demand for US debt.
- High yield (stop-out rate): the highest yield accepted in the auction.
- TIPS, floating-rate notes and cash management bills are excluded from this series.
What the secondary market shows
As of November 12, 2026, the 10-year yield stood at 5.10% (+0.26pt on the week) and the 30-year at 5.43% (+0.18pt), according to FRB H.15 data. Yields rose along the long end. Without auction results, we cannot tell whether supply and demand at auctions played a part.
Balanced view
- A yield level alone does not reveal how strong demand was.
- Higher yields also mean larger income for investors buying newly issued debt.
What to check next
Once TreasuryDirect data can be retrieved, compare the 10-year and 30-year bid-to-cover ratios with recent auctions and read them together with the indirect bidder share.
Sources: US Department of the Treasury (TreasuryDirect); Federal Reserve Board via FRED.
ヨーロッパ債券市場 / European Bond Markets
Euro-area AAA, German and UK 10-year yields all rose
| Indicator | This week | Prior week | Change | Date |
|---|---|---|---|---|
| Euro-area AAA 10y (ECB) | 3.95% | 3.90% | +0.05pt | Nov 12 |
| German Bund 10y (Bundesbank) | 3.37% | 3.22% | +0.15pt | Nov 13 |
| UK Gilt 10y (Bank of England) | 5.20% | 5.14% | +0.06pt | Nov 11 |
The five-business-day change was +0.11pt for the Bund (Nov 9 to Nov 13) and +0.07pt for the Gilt (Nov 5 to Nov 11). The German move was the largest of the three. The UK 10-year at 5.20% sat slightly above the US 10-year at 5.10% (Nov 12), although the observation dates differ by a day.
Why the OAT and BTP spreads need a warning label
The OAT-Bund spread appears to have narrowed from +126bps to +111bps, and the BTP-Bund spread from +77bps to +62bps. But French OAT (4.48%, September 2026) and Italian BTP (3.99%, August 2026) are monthly OECD series that did not change from last week. The only moving part is the daily Bund yield, which rose from 3.22% to 3.37%. The narrowing is therefore arithmetic. It should not be read as an improvement in French or Italian fiscal or political risk.
Institutional context
The ECB publishes AAA-rated euro-area government yield curves, a composite that is not the same as the German benchmark. The Deutsche Bundesbank provides the Bund series, and the Bank of England’s IADB database provides Gilt yields.
Balanced view
- Reassuring: the weekly moves were modest, not disorderly.
- Cautionary: UK yields remain above 5%, so the level itself deserves attention.
Sources: ECB, Deutsche Bundesbank, Bank of England, OECD via FRED.
日本国債・日銀政策金利 / JGB & BOJ
JGB yields edge higher; auctions are mixed by maturity
Yields (Ministry of Finance, as of Nov 12, 2026)
| Tenor | This week | Prior week (Nov 5) | Change |
|---|---|---|---|
| 2y | 1.86% | 1.86% | unchanged |
| 10y | 2.84% | 2.81% | +0.03pt |
| 30y | 3.97% | 3.92% | +0.05pt |
The 10-year minus 2-year spread widened slightly from +0.95pt to +0.98pt. The Bank of Japan (BOJ) policy rate was 1.04% as of September 2026, taken from an OECD monthly series. The 2-year JGB yield sits 0.82pt above that rate. Because the policy rate series is monthly, it may not capture the latest BOJ decision.
Auction results
The tail is the stop-out yield minus the average yield, expressed in sen (0.01 yen of price); a wider tail suggests uneven demand. Here it is computed from the published yields.
| Date | Tenor | Bid-to-cover (prior) | Tail (prior) |
|---|---|---|---|
| Nov 12 | 5y | 3.67 (3.56) | 0.4 (0.5) |
| Nov 10 | 30y | 3.36 (3.88) | 2.4 (1.2) |
| Nov 5 | 10y | 3.21 (3.76) | 3.2 (0.2) |
| Oct 29 | 2y | 4.03 (3.89) | 0.7 (0.7) |
| Oct 20 | 20y | 5.84 (4.01) | 0.6 (1.3) |
Balanced reading
- Stronger: the 5-, 2- and 20-year auctions saw bid-to-cover rise from the previous round. The 20-year ratio of 5.84 is the highest in the table.
- Softer: the 30- and 10-year auctions saw lower coverage and wider tails. For reference, the August 4 10-year auction had coverage of 2.56 and a 46-sen tail, so the latest results are better than that.
- Each result is a single auction, so no trend can be asserted.
Sources: Ministry of Finance Japan; OECD via FRED.
FX・CFDへの含意 / Trade Implications
Reading yield spreads alongside the NFC HMM regimes
This week’s spreads
| Spread | This week | Prior week | Change |
|---|---|---|---|
| US-Japan 10y (USD/JPY carry basis) | +2.26pt | +2.03pt | +0.23pt |
| US-Germany 10y (USD/EUR gauge) | +1.73pt | +1.62pt | +0.11pt |
The wider US-Japan gap reflects a US 10-year rise (+0.26pt) far larger than Japan’s (+0.03pt). Yield differentials of this kind are associated with USD/JPY, but this dataset contains no currency prices, so no direction can be asserted. The OAT-Bund (+111bps) and BTP-Bund (+62bps) figures use monthly French and Italian data and are only reference values.
NFC HMM regime states
NFC’s hidden Markov models (HMM) classify each central bank’s policy stance into regimes. Current readings, all at 100.0% confidence:
– ECB (EUR): Moderate (prior week: Neutral)
– BOE (GBP): Restrictive Hold (unchanged)
– US (USD): Slack Recovery (unchanged)
– BOJ (JPY): Hawkish (prior week: Tightening)
Regime IDs are unchanged for all four models. The ECB and BOJ labels changed in name only.
Alignment and gaps
- Consistent: the BOE ‘Restrictive Hold’ label sits alongside a 10-year Gilt yield of 5.20%. The BOJ ‘Hawkish’ label is not contradicted by a JGB 10y-2y spread of +0.98pt.
- Possible gap: the US ‘Slack Recovery’ label coexists with a 0.40pt weekly rise in the 2-year yield. The JGB 2-year yield was also flat week on week despite the BOJ ‘Hawkish’ label.
Risk-on or risk-off?
Yields rose in the US, Germany, UK, Japan and the euro-area AAA composite. Without equity or credit data in this report, a risk-on or risk-off verdict is not drawn here.
Sources: FRB/FRED, ECB, Bundesbank, BoE, MOF Japan, US Treasury, OECD/FRED.
Disclaimer: This article is for informational purposes only. All investment decisions are made solely at your own risk.