This article was automatically generated by the NFC Market Live AI analysis system. (Updated: 2026-11-10 00:08 JST)
📄 Primary Source
U.S. Census Bureau
https://www.census.gov/wholesale/pdf/mwts/currentwhl.pdf
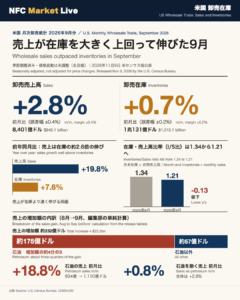
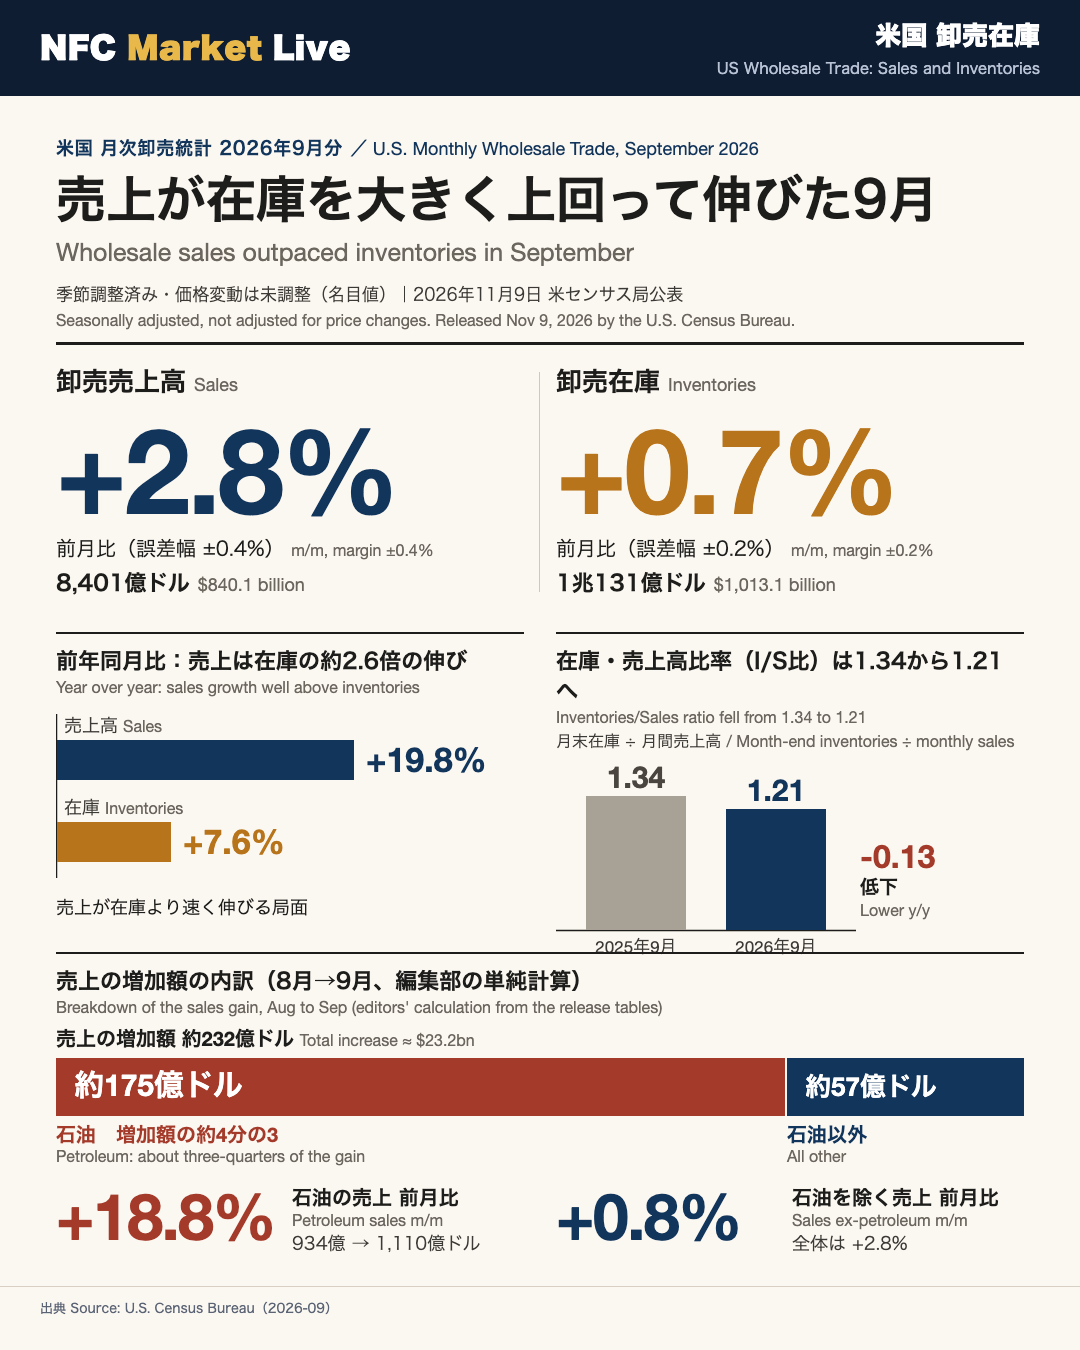
The U.S. Census Bureau released its Monthly Wholesale Trade report for September 2026 on November 9, 2026. Seasonally adjusted sales of merchant wholesalers were $840.1 billion, up 2.8 percent (±0.4 percent) from August and up 19.8 percent (±0.7 percent) from a year earlier. Inventories were $1,013.1 billion, up 0.7 percent (±0.2 percent) from August, revised from the advance estimate of 0.6 percent, and up 7.6 percent (±1.1 percent) from a year earlier.
The inventories/sales ratio was 1.21, versus 1.34 in September 2025. Durable goods sales rose 1.3 percent and nondurable goods sales rose 4.4 percent from August. Petroleum sales were up 18.8 percent and petroleum inventories up 10.6 percent. Automotive sales fell 1.2 percent and drugs sales fell 1.5 percent.
The data reflect revisions based on the 2023 and 2024 Annual Integrated Economic Survey. August sales growth was revised to 2.0 percent. Figures are seasonally adjusted but not adjusted for price changes. The October report is scheduled for December 9, 2026.
概要:売上が在庫を大きく上回って伸びた9月
Overview: Sales Outpaced Inventories in September
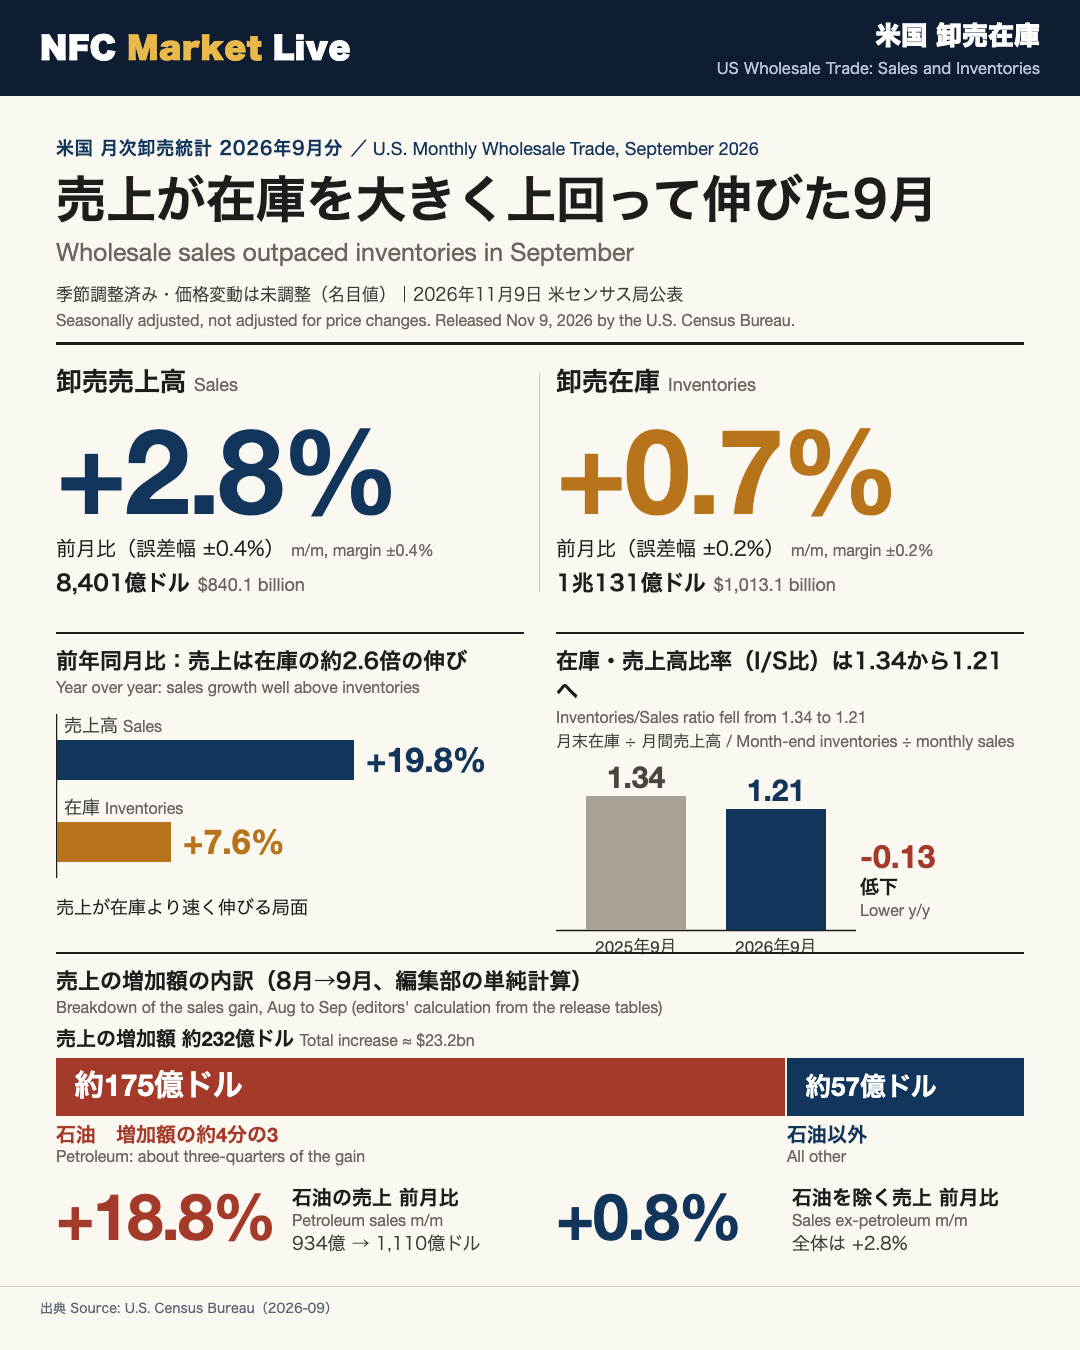
The U.S. Census Bureau’s Monthly Wholesale Trade Survey covers merchant wholesalers, the firms that buy goods and resell them to retailers, manufacturers and other businesses. Sales offices run by manufacturers are excluded. The report for September 2026, released on November 9, 2026, showed seasonally adjusted sales of $840.1 billion (+2.8% m/m, ±0.4%) and inventories of $1,013.1 billion (+0.7% m/m, ±0.2%). Both are nominal figures, not adjusted for price changes.
Key readings
- Sales: +19.8% y/y (±0.7%).
- Inventories: +7.6% y/y (±1.1%). The monthly gain was revised up from the advance estimate of 0.6%.
- Inventories/sales (I/S) ratio: 1.21, versus 1.34 a year earlier. The ratio shows how many months of sales sit in stock, so a lower reading means stock is smaller relative to sales.
Reading both sides
Sales growing much faster than inventories is a lean-stock picture. Two caveats apply. A large share of the monthly sales gain came from petroleum wholesalers, and the figures include price effects. This is also the first release after the annual revision based on the 2023 and 2024 Annual Integrated Economic Survey (AIES), so levels differ from earlier publications. For example, August inventories were shown as $964.2 billion in the October release and are now $1,006.2 billion.
Context
The Census Bureau series is a U.S. data point and differs in coverage from inventory measures in other countries. Wholesale inventories are one input among several used in compiling inventory investment in GDP, but the release itself does not discuss GDP. The next report, covering October, is scheduled for December 9, 2026.
売上の中身:石油の急増と、業種ごとのばらつき
What Drove the Sales Gain
September wholesale sales were $840.1 billion, up 2.8% from August. Durable goods sales were $424.1 billion (+1.3%) and nondurable goods sales were $416.1 billion (+4.4%).
Petroleum did much of the work
Petroleum wholesalers’ sales rose from $93.4 billion in August to $111.0 billion in September, up 18.8%. By our simple calculation from the tables, that is about three quarters of the roughly $23 billion total monthly increase. Excluding petroleum, sales rose about 0.8%. Because the series is not adjusted for price changes, price effects may be part of the petroleum move.
Mixed picture across categories
- Up: metals +6.7%, farm products +4.4%, machinery +2.7%, electrical goods +2.6%.
- Down: drugs -1.5%, automotive -1.2%, furniture -1.0%, computer equipment -1.0%.
On a year-over-year basis, durable goods sales are up 23.8% and nondurable goods sales are up 15.9%. Computer equipment (+57.2%) and electrical goods (+42.9%) stand out. Several durable categories growing strongly against a year earlier suggests demand was not confined to one segment, although nominal values cannot separate price from volume.
Two readings
- Constructive: even excluding petroleum, sales grew about 0.8% in the month, and August’s growth was revised up to 2.0%.
- Cautious: the monthly gain was concentrated in one sector, and the report does not say whether it will persist. Several categories declined.
Context for non-U.S. readers
This survey is a sample of roughly 4,200 firms. Monthly changes carry sampling error, shown in the report as 90% confidence intervals (±0.4% for the total sales change). The Census Bureau does not offer market commentary in this release.
在庫の中身:緩やかな積み増しと、石油・衣料の増加
Inventories: A Modest Build, Concentrated in a Few Categories
End-of-September wholesale inventories were $1,013.1 billion, up 0.7% from August and up 7.6% year over year. Durable goods inventories were $630.0 billion (+0.6% m/m, +8.0% y/y). Nondurable goods inventories were $383.1 billion (+0.9% m/m, +7.0% y/y).
Biggest movers (month over month)
- Up: petroleum +10.6%, apparel +2.6%, electrical goods +2.5%, chemicals +1.3%.
- Down: farm products -7.4%, alcohol -1.8%, metals -0.9%, groceries -0.8%.
Petroleum inventories were $43.8 billion, up 51.9% from a year earlier. By our simple calculation from the tables, inventories excluding petroleum rose only about 0.3% in the month.
How to read it
- Sampling caution: the farm products drop of 7.4% looks large, but the coefficient of variation for the preliminary inventory estimate in that category is 9.5%, the highest among the categories shown. A single-month swing there deserves care.
- Restocking or weak demand? The report does not say why inventories rose. Inventory growth below sales growth is consistent with stock not building excessively this month, but that is a one-month observation. Cross-checking against retail sales and industrial production is needed.
Comparison with the prior release
In the October 8 release, August inventories were up 0.5% m/m, and July was revised to +1.4%. After the annual revision, August is +0.6% and September +0.7%. The monthly pace is similar, but levels moved: August inventories were $964.2 billion in the earlier release and are $1,006.2 billion now.
Two readings
- Constructive: the pace of accumulation is moderate, and the 7.6% annual rise is well below annual sales growth of 19.8%.
- Cautious: the build is concentrated in petroleum and apparel, so the sales trend in those categories matters.
For context, these are U.S. wholesale-level figures. The release does not comment on GDP, prices or monetary policy.
I/S比と統計の読み方:改定・誤差・次回予定
The I/S Ratio and How to Read the Data
What the ratio says
The inventories/sales (I/S) ratio divides end-of-month inventories by that month’s sales. September’s reading was 1.21, versus 1.34 a year earlier. Durable goods stand at 1.49 (1.70 a year ago) and nondurable goods at 0.92 (1.00). Petroleum (0.39) and groceries (0.73) are lean, while apparel (2.41) and machinery (2.65) carry more stock relative to sales. By construction, a month of unusually strong sales makes the ratio fall, so the ratio should be read together with the level of sales.
The October release showed 1.18 for August, but that was before the annual revision. The gap to today’s 1.21 mixes revision effects with real movement, so a direct comparison is not advisable.
The revision matters
This report incorporates the 2023 and 2024 Annual Integrated Economic Survey (AIES), the Census Bureau’s annual benchmark of business activity. Revised data were published on October 26, 2026. August inventories moved from $964.2 billion to $1,006.2 billion. Month-over-month changes should be compared within the revised series.
Reliability
- Sales growth of 2.8% (±0.4%) and inventory growth of 0.7% (±0.2%) are statistically significant at the 90% level.
- The sample is about 4,200 firms. Response rates were 56.7% for sales and 60.4% for inventories, versus 59.8% and 61.7% in the prior report.
- Category-level figures can carry large sampling error.
Two readings
- Constructive: the gap between sales and inventory growth lowers the I/S ratio from a year ago.
- Cautious: the sales gain is concentrated in petroleum, levels shifted with the revision, and response rates dipped slightly.
What comes next
The October report is scheduled for December 9, 2026. Items to check are whether sales growth broadens beyond petroleum, the path of the I/S ratio, and how much the September figures are revised. The Census Bureau’s release does not include policy or market commentary.
Disclaimer: This article is for informational purposes only. All investment decisions are made solely at your own risk.