This article was automatically generated by the NFC Market Live AI analysis system. (Updated: 2026-11-09 07:05 JST)
Government bond yields eased across the US, Europe and Japan this week (Global Bond Watch Weekly, data as of Nov 9, 2026).
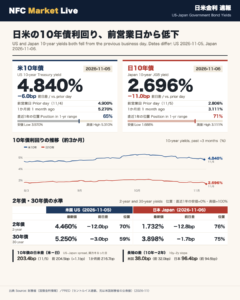
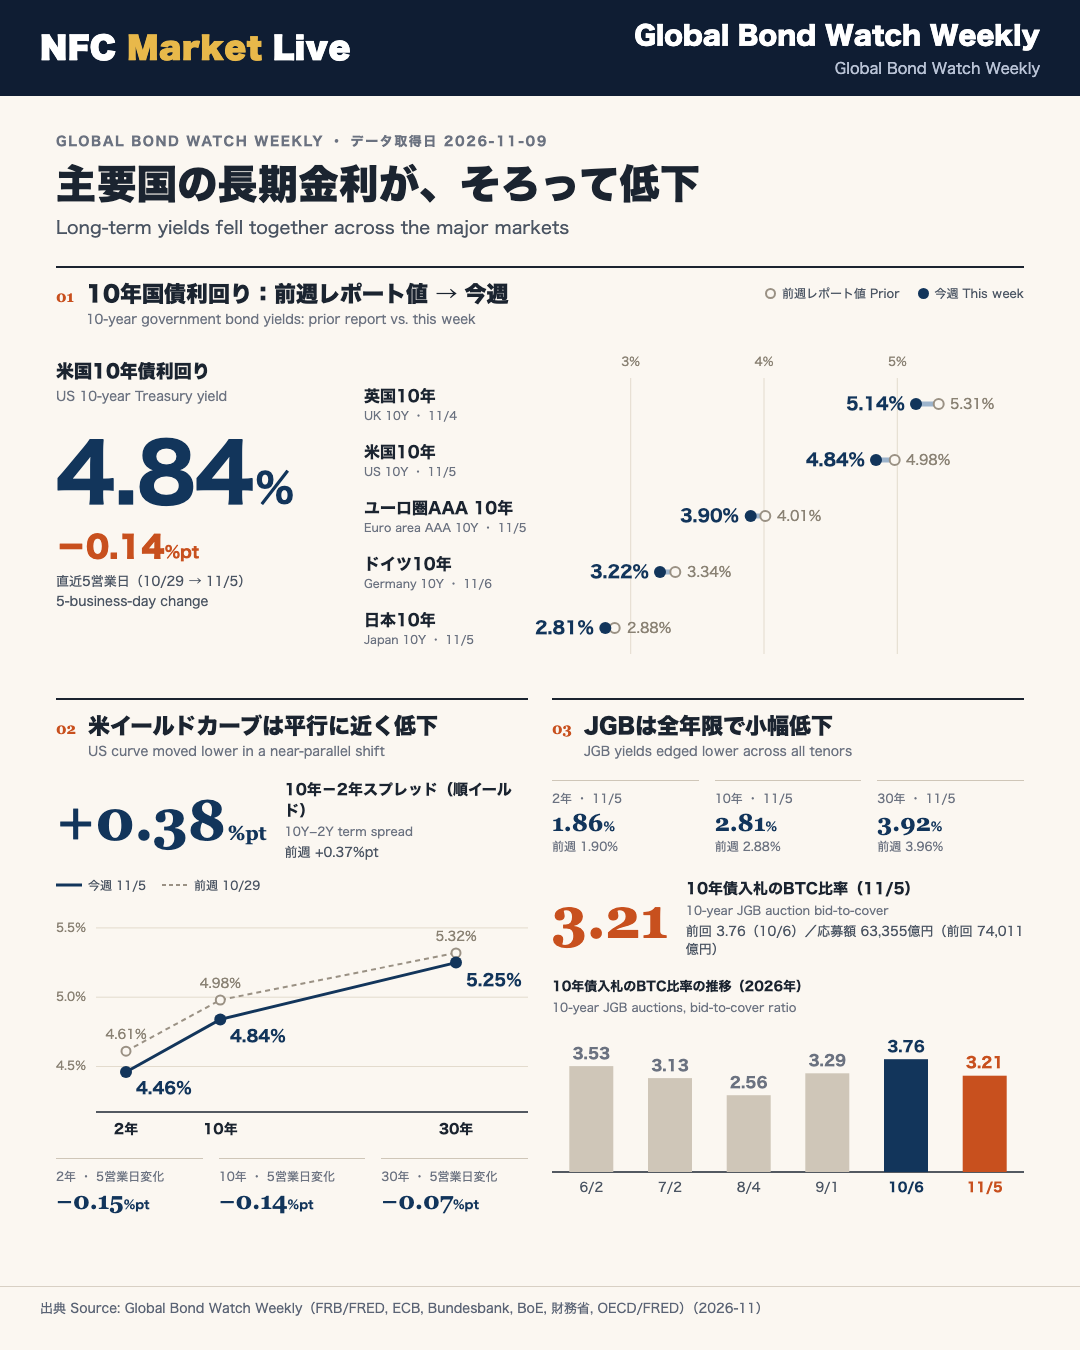
US Treasuries (FRB H.15, as of Nov 5): the 2-year yield was 4.46% (-0.15pt over five business days), the 10-year 4.84% (-0.14pt) and the 30-year 5.25% (-0.07pt). The 10s-2s spread stood at +0.38pt, an upward-sloping curve.
In Europe, the euro-area AAA 10-year yield was 3.90% (Nov 5, ECB), the German Bund 3.22% (Nov 6, -0.09pt) and the UK Gilt 5.14% (Nov 4, -0.12pt). French (4.48%, Sep) and Italian (3.99%, Aug) 10-year yields are monthly figures; the OAT-Bund spread was +126.0bps and the BTP-Bund spread +77.0bps.
In Japan, MOF data showed JGB yields of 1.86% (2-year), 2.81% (10-year) and 3.92% (30-year) as of Nov 5. The 10s-2s spread was +0.95pt, and the policy rate was 1.04% (Sep 2026, OECD monthly). The US-Japan 10-year spread was +2.03pt and the US-Germany spread +1.62pt.
The Nov 5 10-year JGB auction recorded a bid-to-cover of 3.21, an average yield of 2.768% and a stop-out yield of 2.800%.
NFC HMM regimes: ECB Neutral, BOE Restrictive Hold, US Slack Recovery, BOJ Tightening.
グローバル金利スナップショット
Biggest change this week: long-term yields fell together in the US, Germany and the UK
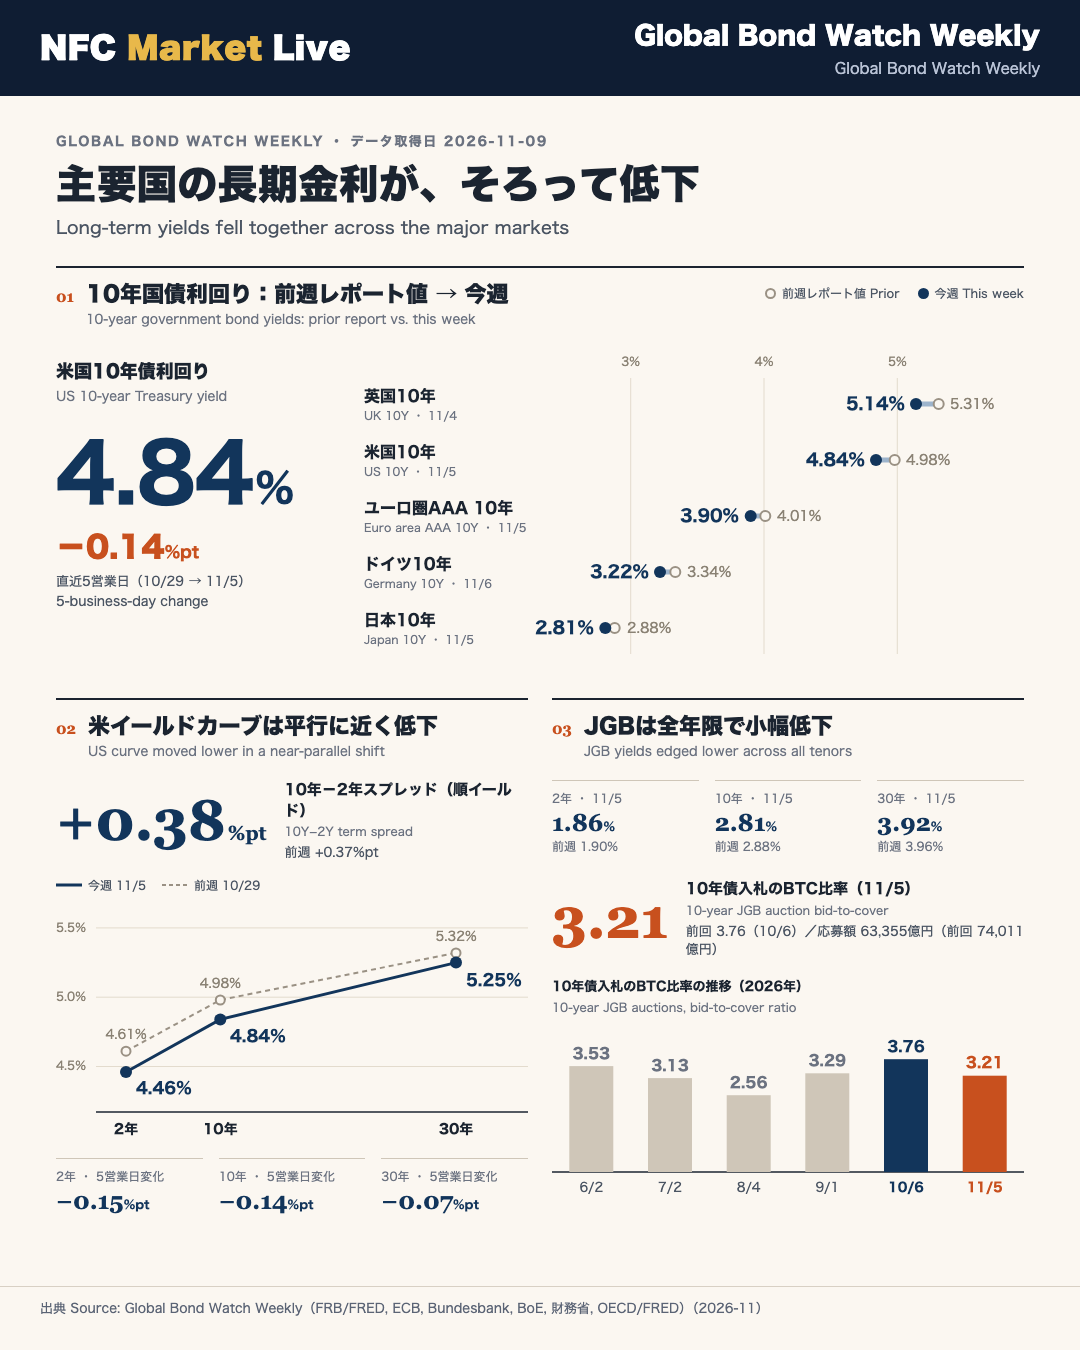
The US 10-year Treasury yield fell to 4.84% (as of Nov 5), down 0.14pt over five business days. The German 10-year Bund yield was 3.22% (Nov 6, -0.09pt) and the UK 10-year Gilt yield 5.14% (Nov 4, -0.12pt). Japan’s 10-year was 2.81% (Nov 5). Major government bond markets moved in the same direction.
Reading the data
- US curve: 2-year 4.46% (-0.15pt), 10-year 4.84% (-0.14pt), 30-year 5.25% (-0.07pt). The 10s-2s spread was +0.38pt, almost unchanged from +0.37pt the prior week, so the curve shifted down in a roughly parallel way. The 10s-30s gap, calculated from the two reports, widened from 0.34pt to 0.41pt, meaning the ultra-long end fell less.
- Euro area: the ECB’s AAA-rated 10-year spot yield was 3.90% (Nov 5), versus 4.01% in the prior report.
- France and Italy: 4.48% (Sep) and 3.99% (Aug) are monthly OECD figures. They are reference points, not this week’s moves.
Context for non-Japan readers
The US figures come from the Federal Reserve’s H.15 release via FRED. Japanese yields come from the Ministry of Finance (MOF). Because each source publishes on slightly different dates, the report states a five-business-day change for each series. Compare changes within a series rather than across them.
Our view
The decline across several countries suggests the move was broader than a single national story. However, the source material gives no reason for the fall, so it is best read as a description of what happened, not an explanation.
What to check next
Watch whether the US 10-year stays near 4.8% and the Bund near 3.2% in next week’s report.
Source: FRB/FRED®, ECB, Bundesbank, BoE, MOF Japan, OECD/FRED®
米国債入札 Deep Dive
Data status this week
The US Treasury auction table in the source report shows data retrieval failed for both this week and the prior week. Bid-to-cover, high yield, indirect bidder share and issuance size are therefore unavailable, and this article does not assess whether auction demand strengthened or weakened.
How to read Treasury auctions
| Metric | What it measures | How to read it |
|---|---|---|
| Bid-to-cover | Total bids divided by the amount offered | Higher means deeper demand |
| Indirect bidders % | Share awarded to foreign central banks and similar institutions | A rough gauge of overseas demand |
| High yield (stop-out rate) | The highest yield accepted at auction | Compare with secondary-market yields to judge demand |
What we can observe
In the secondary market (FRB H.15, as of Nov 5), the 10-year Treasury yield was 4.84% (-0.14pt over five business days) and the 30-year was 5.25% (-0.07pt). Both were lower than the prior week. These are trading yields, not auction results, so they do not directly measure auction demand.
Why long-end auctions matter
Long-dated auctions are watched because the 10-year and 30-year sectors reflect how the market absorbs government debt issuance. With the current data gap, this week’s figures cannot support a conclusion about fiscal supply pressure either way.
What to check next
- Whether TreasuryDirect data is retrieved next week, so bid-to-cover and indirect bidder share can be compared with the previous 10-year and 30-year auctions.
- How each auction’s stop-out rate compares with prevailing secondary-market yields.
Source: U.S. Department of the Treasury, TreasuryDirect
ヨーロッパ債券市場
Euro-area AAA, Germany and the UK all moved lower
The ECB’s euro-area AAA-rated 10-year spot yield was 3.90% (as of Nov 5), down from 4.01% (Oct 29) in the prior report. The German 10-year Bund yield was 3.22% (Nov 6, -0.09pt over five business days) and the UK 10-year Gilt yield 5.14% (Nov 4, -0.12pt).
Yields at a glance
| Series | This week | Prior report |
|---|---|---|
| Euro-area AAA 10y (ECB, daily) | 3.90% (Nov 5) | 4.01% (Oct 29) |
| German Bund 10y (Bundesbank, daily) | 3.22% (Nov 6) | 3.34% (Oct 30) |
| UK Gilt 10y (BoE, daily) | 5.14% (Nov 4) | 5.31% (Oct 28) |
The UK 10-year remains the highest yield among the European series covered here.
A statistical caution on spreads
- OAT-Bund spread: +126.0bps (prior week +114.0bps)
- BTP-Bund spread: +77.0bps (prior week +65.0bps)
French (4.48%, Sep 2026) and Italian (3.99%, Aug 2026) yields are monthly OECD figures and are unchanged from the prior report, while the Bund is a daily series that fell from 3.34% to 3.22%. The wider spreads therefore reflect the lower Bund yield and do not show that French or Italian bonds were sold this week. Judging French fiscal and political risk or Italian sovereign risk would need daily yields for both countries.
Context for global readers
Bunds are the euro-area benchmark safe asset, and OAT and BTP spreads versus Bunds are the standard gauges of French and Italian risk premia. The Gilt is priced off Bank of England policy and UK fiscal factors, so it can differ from continental trends. This week all three daily series fell together.
Our view
The simultaneous decline suggests a shared direction across European government bonds, though the source gives no stated reason.
What to check next
The next monthly OECD update for France and Italy, and whether the Gilt stays above 5%.
Source: ECB; Deutsche Bundesbank; Bank of England; OECD via FRED®
日本国債・日銀政策金利
JGB yields edged lower across the curve
According to Ministry of Finance (MOF) data as of Nov 5, 2026, JGB yields were 1.86% (2-year), 2.81% (10-year) and 3.92% (30-year), each lower than the prior report (1.90%, 2.88%, 3.96% as of Oct 29). The 10s-2s spread was +0.95pt (prior +0.98pt). The Bank of Japan policy rate shown is 1.04% (September 2026, OECD monthly), which may not capture the latest policy decisions. The US-Japan 10-year spread narrowed slightly to +2.03pt from +2.10pt.
JGB auction demand
| Date | Tenor | Bid-to-cover | Average yield | Stop-out yield |
|---|---|---|---|---|
| Nov 5, 2026 | 10y | 3.21 | 2.768% | 2.800% |
| Oct 29, 2026 | 2y | 4.03 | 1.905% | 1.912% |
| Oct 20, 2026 | 20y | 5.84 | 3.723% | 3.729% |
| Oct 6, 2026 | 10y | 3.76 | 3.101% | 3.103% |
10-year auction versus the previous one
- Bid-to-cover fell to 3.21 on Nov 5 from 3.76 on Oct 6. Bids totaled 6,335.5 billion yen versus 7,401.1 billion yen.
- The tail (stop-out minus average yield), calculated from the table, was about 3.2 sen on Nov 5 versus about 0.2 sen on Oct 6. The source’s tail column shows a dash for these auctions. A wider tail indicates more dispersed bidding.
- The average yield fell from 3.101% to 2.768%.
Other sectors told a different story: the Oct 29 2-year auction’s bid-to-cover rose to 4.03 from 3.89, and the Oct 20 20-year auction’s 5.84 was the highest in the 30-auction table.
Context for global readers
Japanese auctions are held by the MOF, with bid-to-cover measuring total bids against the amount accepted. JGB yields matter globally because they anchor the yen carry trade and reflect expectations around BOJ policy normalization.
Our view
Demand for the 10-year sector may have been softer than at the previous auction, but one auction is a single data point, and the 2-year and 20-year results were firm. It is too early to call a deterioration.
What to check next
Whether the next 10-year auction keeps bid-to-cover above 3 and whether the tail narrows.
Source: Ministry of Finance Japan; OECD via FRED®
FX・CFDへの含意(Trade Implications)
Linking yield spreads to NFC HMM regimes
The NFC Hidden Markov Model (HMM) currently classifies the ECB as Neutral, the BOE as Restrictive Hold, the US as Slack Recovery and the BOJ as Tightening, each with 100.0% confidence. Compared with last week, the ECB label changed from Moderate to Neutral and the BOJ label from Hawkish to Tightening, but the regime ID stayed at 2 for both. The names changed while the IDs did not, so avoid over-reading the relabeling.
Spreads and currency pairs
| Spread | This week | Prior week |
|---|---|---|
| US-Japan 10y (USD/JPY) | +2.03pt | +2.10pt |
| US-Germany 10y (EUR/USD) | +1.62pt | +1.64pt |
| OAT-Bund (monthly, reference) | +126.0bps | +114.0bps |
| BTP-Bund (monthly, reference) | +77.0bps | +65.0bps |
USD/JPY. The US-Japan 10-year spread narrowed because the US yield fell by 0.14pt versus 0.07pt for the JGB 10-year (2.88% to 2.81%). A narrower spread may be a mild headwind for the dollar-yen carry trade. At the same time, the 2-year JGB yield at 1.86% sits above the 1.04% policy rate (Sep 2026, monthly), which is consistent with the BOJ Tightening label. These are one-week observations.
EUR/USD. The US-Germany spread was nearly flat (+1.64pt to +1.62pt), in line with the ECB Neutral regime and the small decline in the AAA yield to 3.90%.
European risk sentiment. The wider OAT-Bund and BTP-Bund spreads mainly reflect a daily Bund yield falling against unchanged monthly OAT and BTP data, so they are weak evidence of rising European risk.
Risk-on versus risk-off
Broadly lower yields can be read as defensive, but the curve shape barely changed (the 2-year fell slightly more than the 10-year), so the signal is mixed.
What to check next
Whether the spreads hold this week’s levels, the monthly BOJ rate update, and the return of US auction data.
This is a description of correlations that may be relevant, not a directional forecast.
Source: FRB/FRED®, ECB, Bundesbank, BoE, MOF Japan, U.S. Treasury, OECD/FRED®
Disclaimer: This article is for informational purposes only. All investment decisions are made solely at your own risk.