This article was automatically generated by the NFC Market Live AI analysis system. (Updated: 2026-11-07 07:06 JST)
📄 Primary Source
Ministério do Desenvolvimento
https://balanca.economia.gov.br/balanca/publicacoes_dados_consolidados/tabelas/nota/Nota.pdf
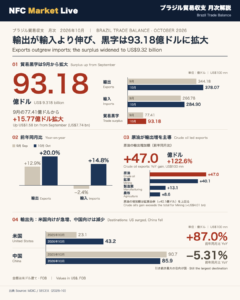
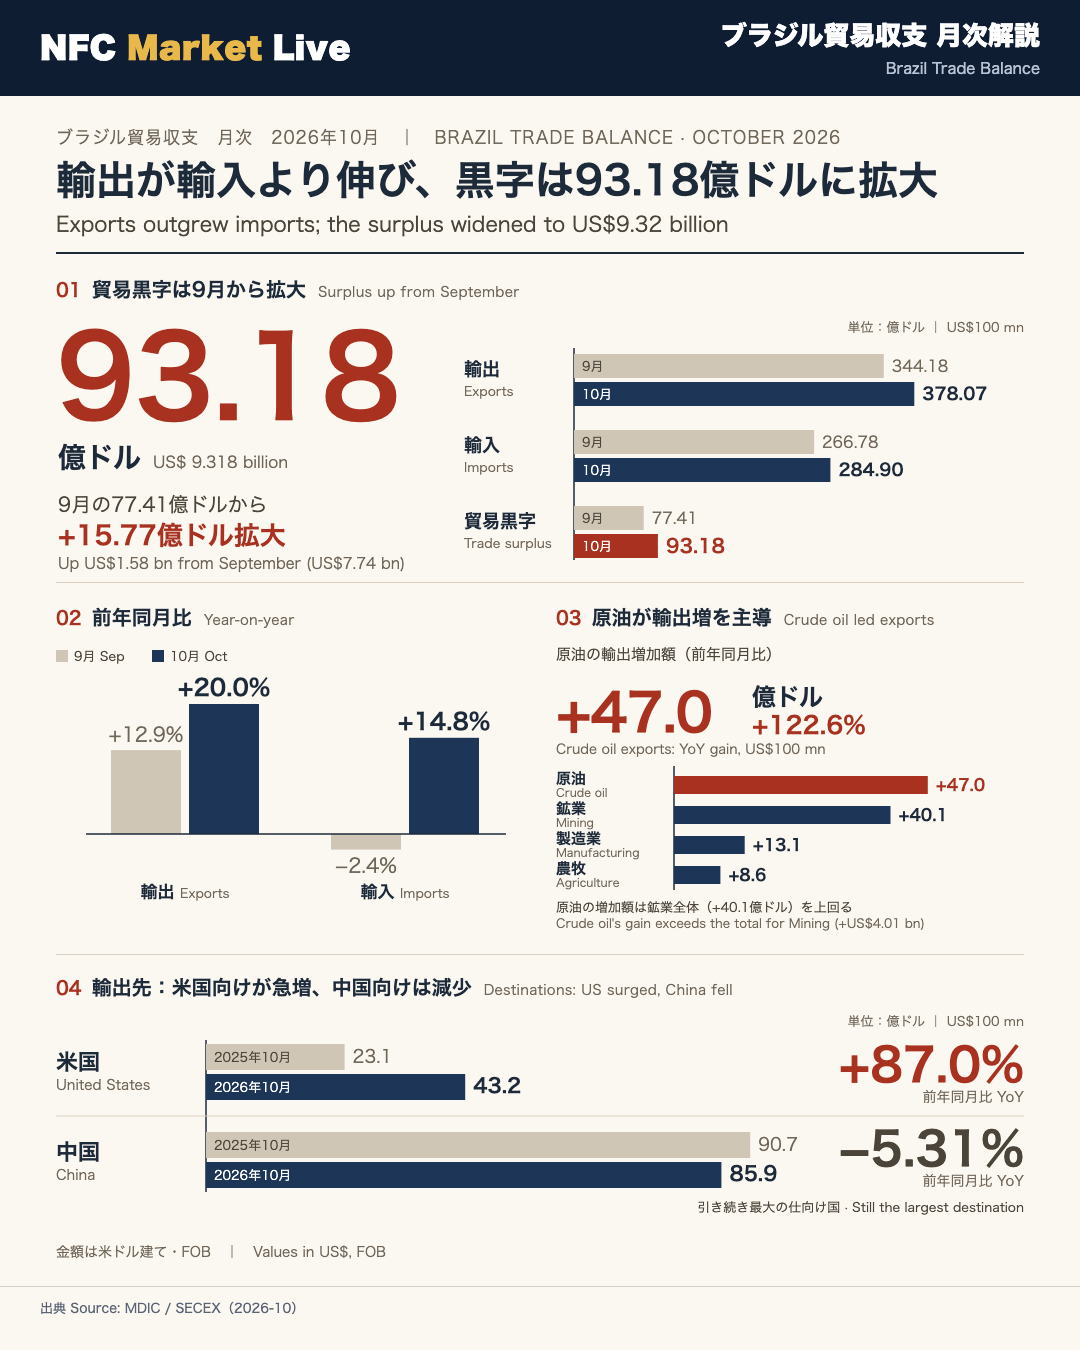
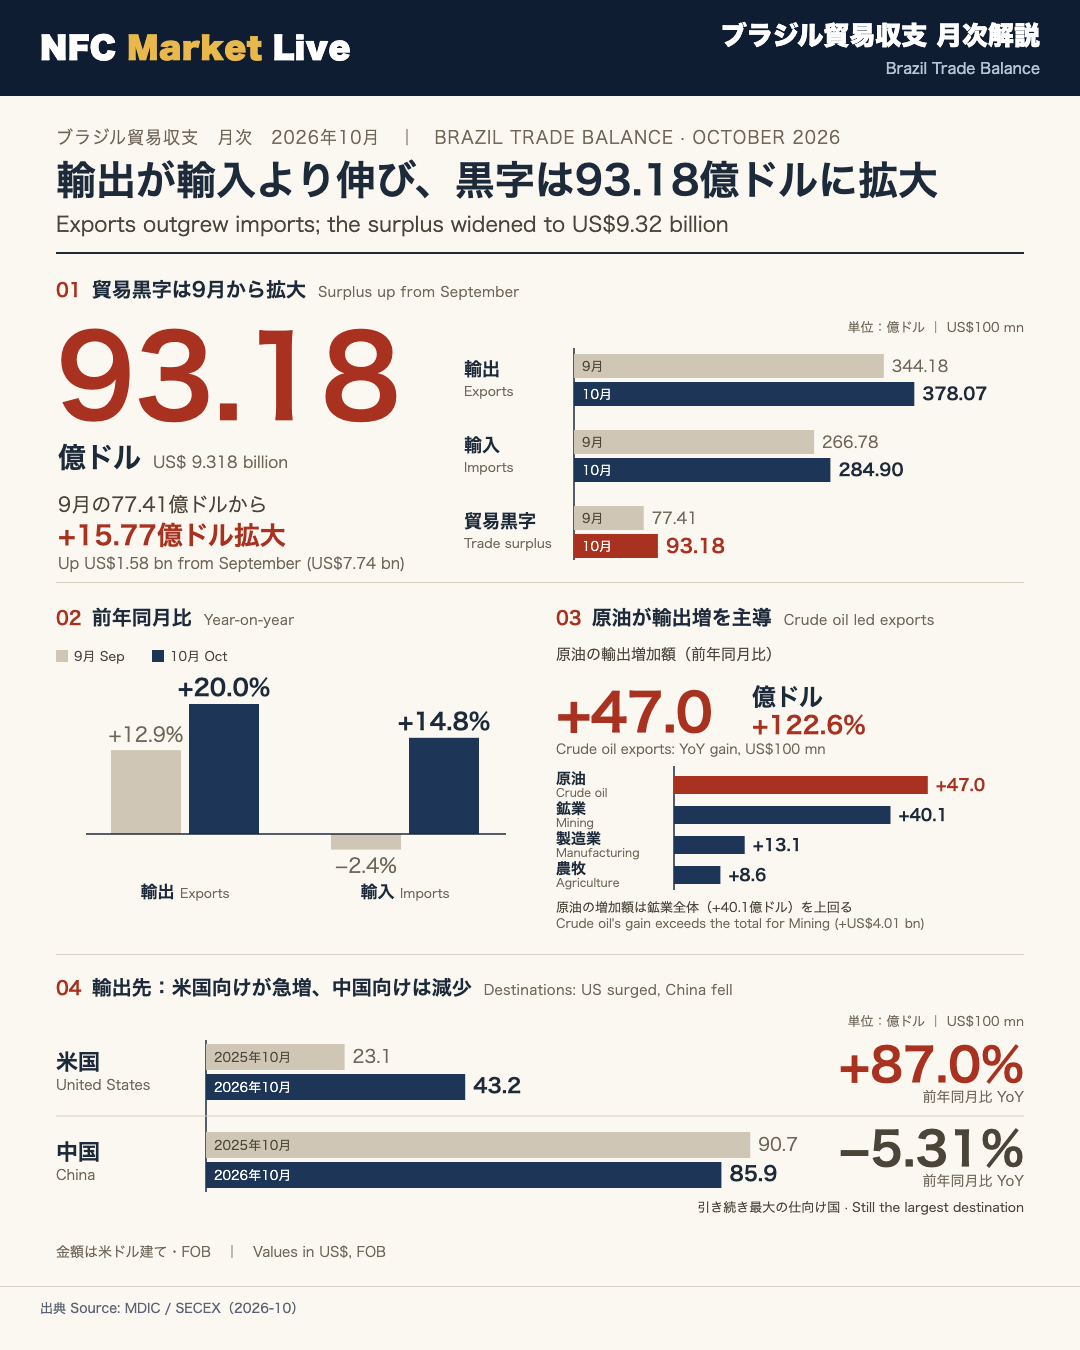
Brazil’s Ministry of Development, Industry, Trade and Services (MDIC) reported October 2026 exports of US$37.81 billion and imports of US$28.49 billion, leaving a trade surplus of US$9.32 billion, up from US$7.74 billion in September.
Exports rose 20.0% year on year (from US$31.51 billion) and imports rose 14.8% (from US$24.82 billion). Total trade came to US$66.30 billion, up 17.7%. January-October exports reached US$321.88 billion (+11.2%) and imports US$250.84 billion (+6.1%), for a cumulative surplus of US$71.04 billion.
By sector, extractive exports rose US$4.01 billion (+53.5%), manufactured goods US$1.31 billion (+7.7%) and agriculture US$0.86 billion (+12.8%). Crude oil was the largest single contributor at +US$4.70 billion (+122.6%). Exports to the United States rose 87.0%, while exports to China fell 5.31%.
On the import side, manufactured goods rose US$3.04 billion (+13.1%), led by fuel oils (+US$1.59 billion) and passenger cars (+US$0.57 billion). In September, imports had fallen 2.4% year on year, with platforms and floating structures down US$2.33 billion.
Source: MDIC / Secex, Balança Comercial Brasileira
10月の貿易収支:輸出も輸入も増え、黒字は93.18億ドルに拡大
Brazil’s October 2026 Trade Balance: The Big Picture
What this report is: Each month, SECEX, the foreign trade secretariat of Brazil’s Ministry of Development, Industry, Trade and Services (MDIC), publishes goods exports and imports on an FOB basis in US dollars. It is the main official gauge of Brazil’s external goods flows. A rough US analogue is the Census Bureau’s monthly trade release, though Brazil’s report is far more commodity-heavy.
Headline numbers
| US$ billion | Oct 2026 | Sep 2026 |
|---|---|---|
| Exports | 37.807 | 34.418 |
| Imports | 28.490 | 26.678 |
| Trade surplus | 9.318 | 7.741 |
| Total trade | 66.297 | 61.096 |
Year on year, exports rose 20.0% (September: +12.9%) and imports rose 14.8% (September: -2.4%). Total trade grew 17.7%. Year to date through October, exports are US$321.88 billion (+11.2%), imports US$250.84 billion (+6.1%) and the cumulative surplus US$71.04 billion, versus US$62.40 billion through September.
Strengths and caveats
- Positive: Both exports and imports grew strongly, and the surplus widened from September.
- Caveat: Import growth swung from -2.4% to +14.8% in a month. The report attributes September’s drop mainly to a US$2.33 billion fall in platforms and floating structures, a lumpy item. One month of data cannot establish a trend in domestic demand.
Independent view
Export growth outpaced import growth, so the surplus widened. A bounce in imports after September’s lumpy decline may be part of the October increase. This is an interpretation, not a statement from the report, and the November release will help test it.
Market context: A trade surplus is one component of the external accounts that investors watch when assessing the real (BRL). This report alone does not provide a directional signal for the currency.
Source: MDIC / Secex, Balança Comercial Brasileira
輸出:原油が最大の押し上げ、米国向けが急増、中国向けは減少
Brazil’s Exports in October: What Rose and Where It Went
Context for non-specialists: Brazil is a large exporter of commodities such as soybeans, crude oil, iron ore and copper ore. SECEX reports exports by sector, product and destination, all in US dollars (FOB), so price and volume effects are not separated.
Sector contributions (year on year)
| Sector | Oct | Sep | Jan-Oct |
|---|---|---|---|
| Extractive | +$4.01bn (+53.5%) | +$2.69bn (+39.8%) | +$16.14bn (+24.4%) |
| Manufacturing | +$1.31bn (+7.7%) | +$0.89bn (+5.3%) | +$9.84bn (+6.3%) |
| Agriculture | +$0.86bn (+12.8%) | +$0.32bn (+4.8%) | +$6.08bn (+9.2%) |
Crude oil stands out
Crude oil exports rose US$4.70 billion (+122.6%), up from +US$2.83 billion in September. Because this exceeds the whole extractive sector’s gain of US$4.01 billion, other extractive products must have declined in aggregate. Soybeans rose only 8.9% in October (+US$0.26 billion), though they are up 14.5% year to date (+US$5.81 billion).
Destinations
Exports to the United States rose 87.0% (roughly US$2.3 billion to US$4.3 billion). The report cites crude oil as the main product going to North America (+593.6%). Shipments to the Netherlands (+63.1%), India (+67.9%) and Japan (+52.1%, +US$0.2 billion) also rose. Exports to China fell 5.31% (US$9.07 billion to US$8.59 billion), although China remains the largest destination. Canada, South Korea and Germany also declined.
On a year-to-date basis, US-bound exports moved from -6.5% in September to +0.2% in October, while China’s cumulative growth eased from +12.0% to +10.0%.
Balanced reading
- Positive: All three sectors grew, and destinations were diversified across Asia, Europe and the Americas.
- Caution: October’s gain leaned heavily on crude oil, and China-bound sales fell.
Independent view: October’s strength may reflect a high dependence on resource exports, an interpretation rather than a point stated in the report. Watch whether crude oil and China-bound shipments hold up in November.
Source: MDIC / Secex, Balança Comercial Brasileira
輸入:燃料油・乗用車が増加、9月の落ち込みから反発
Brazil’s Imports in October: Rebound After a Lumpy September
Why imports matter: Imports are often read alongside domestic demand, since consumer goods, vehicles and machinery feed spending and investment. In Brazil’s data, single lumpy items such as oil platforms can distort monthly swings.
October by sector (year on year)
- Manufacturing: +US$3.04 billion (+13.1%)
- Extractive: +US$0.55 billion (+51.4%)
- Agriculture: +US$0.05 billion (+10.1%)
Year to date, manufacturing imports are up US$14.5 billion (+6.6%), while agricultural imports are down 8.2%.
Leading products in October
| Product | Increase | Growth |
|---|---|---|
| Fuel oils (excl. crude) | +$1.59bn | +108.4% |
| Passenger cars | +$0.57bn | +95.5% |
| Electric generators and parts | +$0.25bn | +213.5% |
| Copper | +$0.21bn | +129.6% |
| Auto parts | +$0.20bn | +27.6% |
Year to date, fuel oils (+US$5.79 billion), passenger cars (+US$4.66 billion), semiconductor devices (+US$2.09 billion) and data-processing machines (+US$1.74 billion) lead the increase.
The September base effect
In September, imports fell 2.4% year on year. The report names platforms and floating structures (-98.0%, -US$2.33 billion) and non-electric engines and machinery (-79.1%, -US$0.89 billion) as the main drags, with imports from Singapore down 95.7%. In October, such items no longer appear among the decliners, and total imports rebounded 14.8%.
Sources
Imports from China rose 17.1% (+US$1.1 billion) and from the United States 28.6% (+US$1.1 billion, including fuel oils from North America +US$1.5 billion). Imports from the Middle East fell 63.85%, with Saudi Arabia down 74.6% and Qatar down 95.5%.
Balanced reading
- Positive: Growth in cars, generators, data-processing equipment and semiconductor devices suggests solid consumption- and equipment-related demand.
- Caution: Fuel oils account for roughly half of October’s increase, and fuel oil exports also rose US$1.12 billion, so demand alone may not explain it.
Independent view: Part of October’s jump may reflect a rebound from September’s drop. This is an interpretation. Sustained car and machinery imports in November would strengthen the demand reading.
Source: MDIC / Secex, Balança Comercial Brasileira
強さと弱さのバランス:次に確認したい点
Putting October’s Trade Balance in Perspective
Strengths versus caveats
| Area | Strength | Caveat |
|---|---|---|
| Surplus | Up to US$9.32bn from US$7.74bn in September | Weekly surpluses ranged widely, from US$0.83bn to US$2.53bn |
| Exports | +20.0% YoY, all three sectors up | Crude oil’s +US$4.70bn is dominant |
| Imports | Cars, machinery and semiconductor devices higher | September was -2.4%; fuel oils concentrated the gain |
| Partners | US +87.0%, India +67.9%, broad spread | China -5.31%, Canada -16.22%, South Korea -36.07% |
Reading the data carefully
- Figures are in US dollars on an FOB basis, so price and volume effects are not separated.
- Single-month year-on-year comparisons depend on the prior-year base. September imports fell 2.4%, then rose 14.8% in October.
- Year-to-date growth is calmer (exports +11.2%, imports +6.1%). Treating one strong month as a structural shift would overreach.
What to watch next
- Surplus level: Using October’s US$9.32 billion as the reference, does November hold near it or move back toward September’s US$7.74 billion?
- Crude oil exports: October’s +US$4.70 billion (+122.6%) is the key item. Does the gain persist or broaden?
- China-bound exports: -5.31% in October; cumulative growth is +10.0%, down from +12.0% at the September cut-off.
- Import composition: Do fuel oil (+108.4%) and car (+95.5%) imports stay high, and do equipment-related items increase?
Market context
For international readers, the trade surplus is one input to Brazil’s external accounts, alongside services, income and capital flows. Commodity-linked exports mean the data also reflect global prices. On its own, this report offers no directional signal for the real (BRL) or Brazilian assets.
Independent view: October looks strong on headline numbers, with moderating factors in the details. The balanced reading is that the data are solid but need confirmation over several months.
Source: MDIC / Secex, Balança Comercial Brasileira
Disclaimer: This article is for informational purposes only. All investment decisions are made solely at your own risk.