This article was automatically generated by the NFC Market Live AI analysis system. (Updated: 2026-11-06 22:36 JST)
📄 Primary Source
Statistics Canada
https://www150.statcan.gc.ca/n1/daily-quotidien/261106/dq261106a-eng.htm
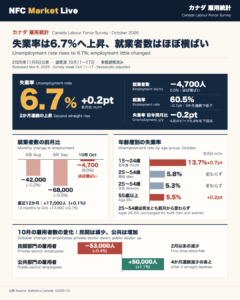
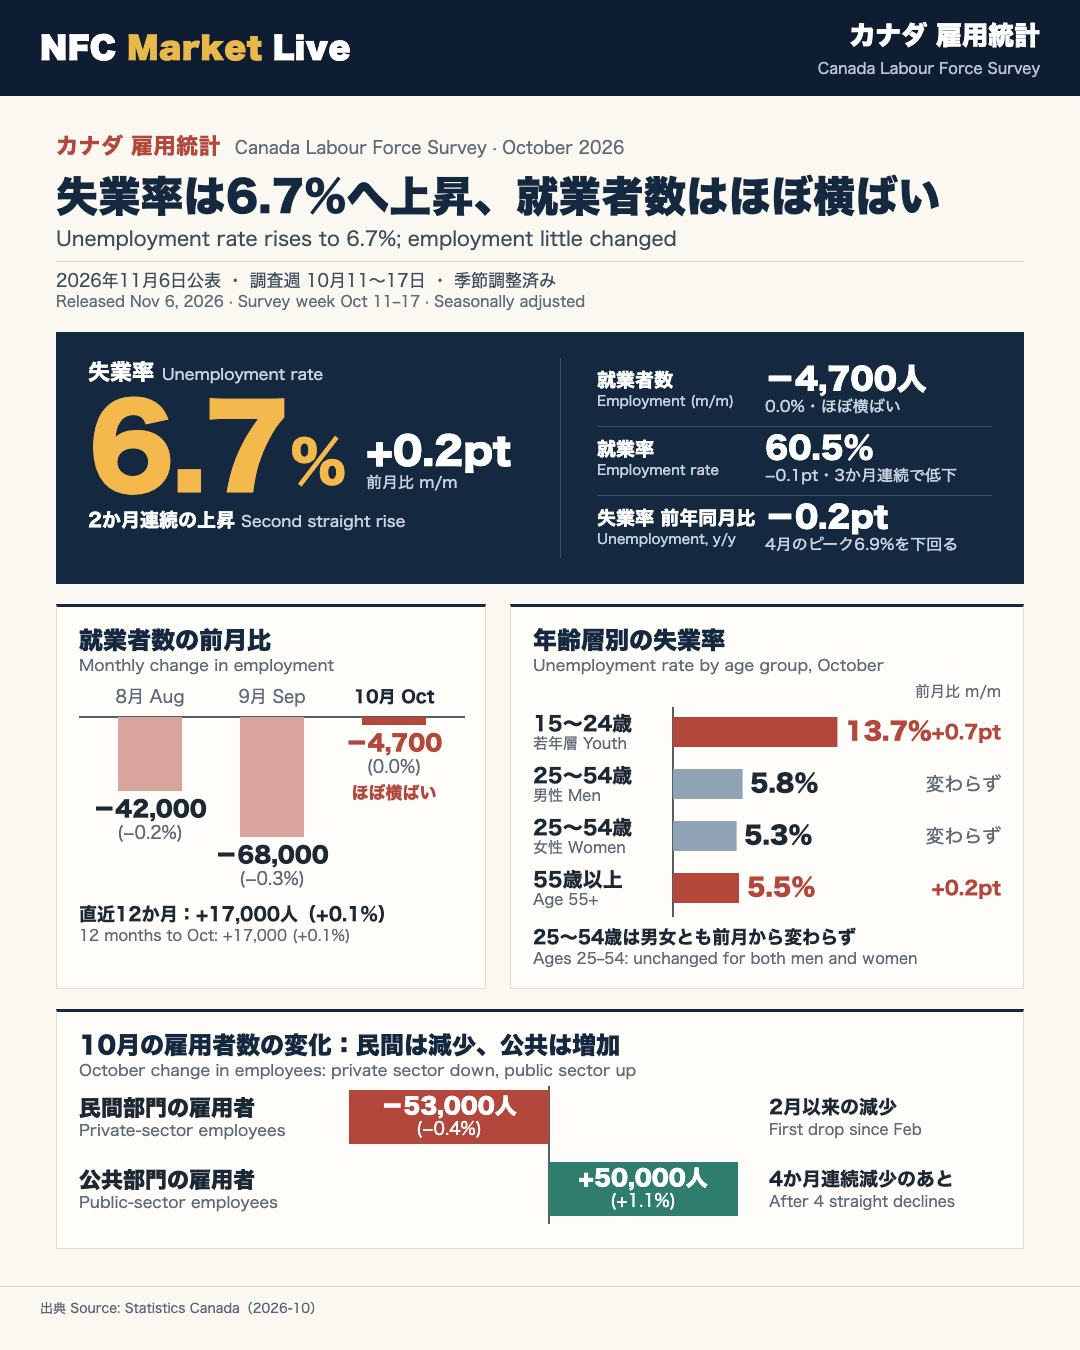
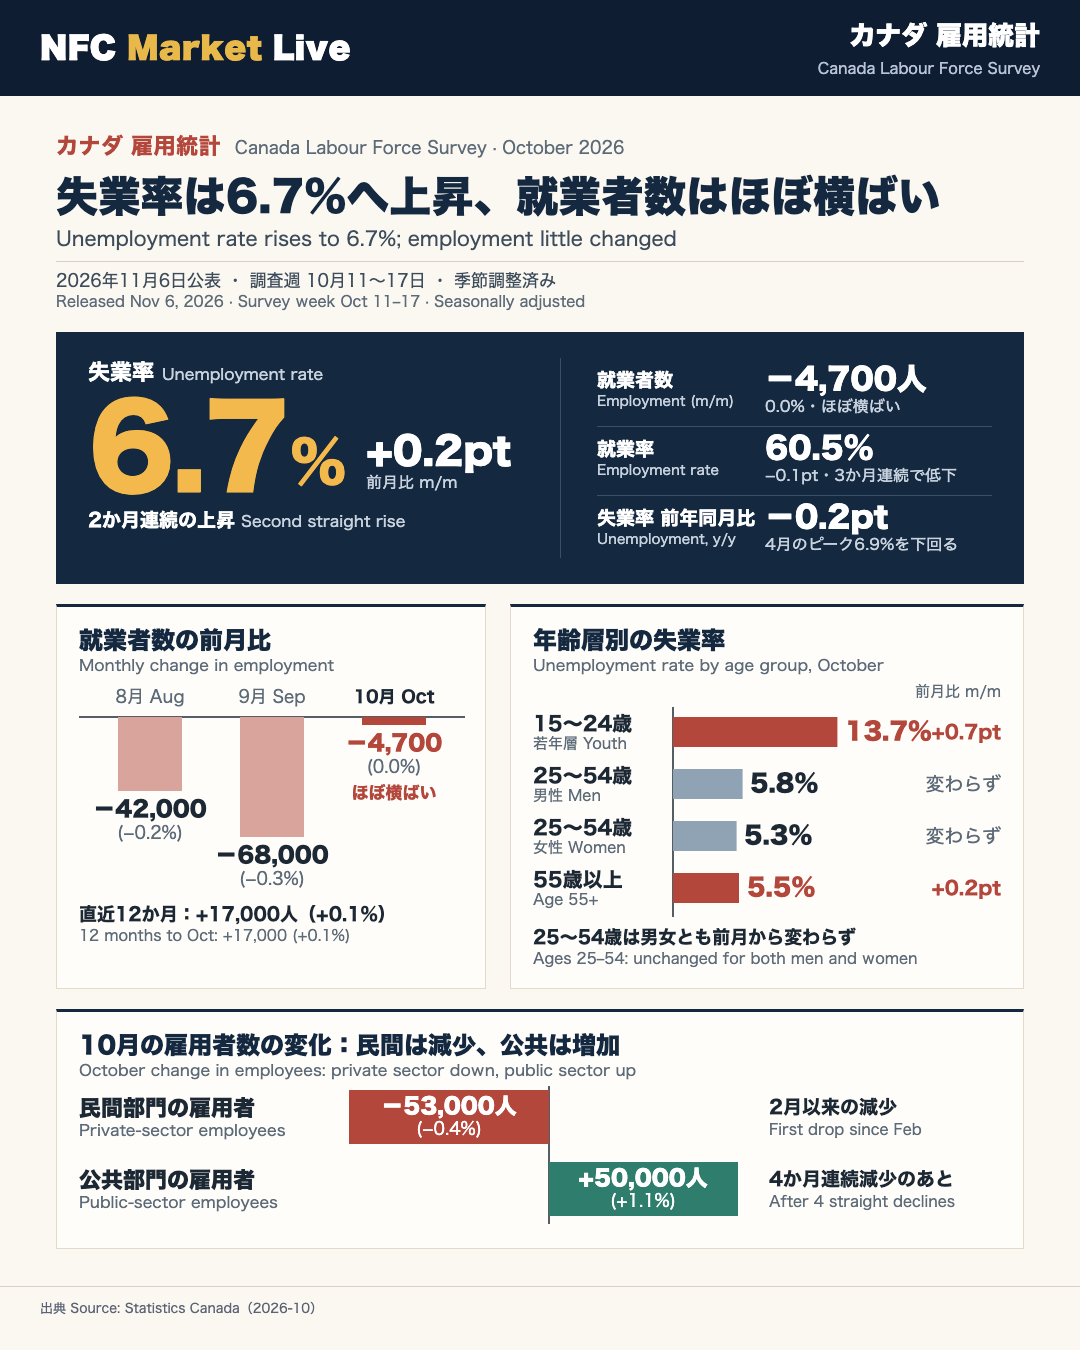
📊 Statistics Canada’s Labour Force Survey for October, released on November 6, 2026, shows employment little changed (-4,700; 0.0%) while the unemployment rate rose 0.2 percentage points to 6.7%. The employment rate fell 0.1 points to 60.5%, a third straight monthly decline.
📉 This follows employment declines of 68,000 in September and 42,000 in August. Private sector employees fell by 53,000, the first drop since February, while public sector employees rose by 50,000 (+1.1%). By industry, wholesale and retail trade lost 29,000 jobs, while construction (+16,000) and educational services (+15,000) gained.
👥 The youth (15-24) unemployment rate rose 0.7 points to 13.7%; core-aged rates were unchanged at 5.8% for men and 5.3% for women. Long-term unemployment accounted for 23.7% of the unemployed, up from 21.5% a year earlier.
🗺️ Employment fell by 24,000 in Alberta (unemployment rate 7.3%) and rose by 12,000 in British Columbia. Quebec’s rate fell 0.3 points to 5.7%.
💰 Average hourly wages rose 2.2% year over year to $37.89, after 2.3% in September. The unemployment rate remains below the April 2026 peak of 6.9%.
📅 The next release is on December 4, 2026 (November data; reference week November 8-14).
10月の労働力調査:就業者数は横ばい、失業率は6.7%へ上昇
What was released
Statistics Canada (StatCan), the federal statistical agency, published the October 2026 Labour Force Survey (LFS) on November 6, 2026. The reference week was October 11-17. The LFS is a monthly household survey of roughly 65,000 households and is the first of the labour market indicators StatCan publishes each month. In structure it resembles the household survey behind the US unemployment rate, whereas the US ‘nonfarm payrolls’ figure comes from an employer survey.
| Indicator | October | Change |
|---|---|---|
| Employment | ~21.1 million | -4,700 (0.0%) |
| Unemployment rate | 6.7% | +0.2 pts |
| Employment rate | 60.5% | -0.1 pts |
| Average hourly wages (y/y) | +2.2% ($37.89) | Sept: +2.3% |
“Employment was little changed in October (-4,700; 0.0%) and the employment rate fell 0.1 percentage points to 60.5%.”
A balanced reading
Resilience: The unemployment rate is 0.2 points below its year-earlier level and below the April 2026 peak of 6.9%. Core-aged (25-54) rates were unchanged at 5.8% for men and 5.3% for women. Construction (+16,000) and educational services (+15,000) added jobs.
Softness: The employment rate has fallen three months in a row, and employment declined in August (-42,000) and September (-68,000) before stalling in October. The unemployment rate has risen two months running, which StatCan attributes to more people searching for work (+33,000; +2.2%).
Statistical caveat
StatCan says its analysis focuses on changes that are statistically significant at the 68% confidence level, a lower bar than the 95% level often used elsewhere, and warns that monthly estimates carry more sampling variability than longer trends. A 4,700 change in employment is described simply as ‘little changed’.
Next release
The November LFS is due on December 4, 2026, covering the week of November 8-14.
雇用の中身:民間は減少、公共は反発、賃金は2.2%増
Employment trend
Employment edged down by 4,700 in October (0.0%), after falls of 42,000 in August and 68,000 in September. Over the past 12 months, however, employment is up only 17,000 (+0.1%), and the employment rate is 0.3 points lower. In other words, job growth has essentially stalled over the year, which fits a labour force that is not expanding much either.
By class of worker
| Category | October change | Year over year |
|---|---|---|
| Private sector employees | -53,000 (-0.4%) | +35,000 (+0.3%) |
| Public sector employees | +50,000 (+1.1%) | -70,000 (-1.5%) |
| Self-employed | little changed | +52,000 (+1.9%) |
“The number of private sector employees fell by 53,000 (-0.4%) in October, the first decline since February.”
The public sector gain followed four straight monthly declines totalling 148,000 (-3.2%), so it partly reverses a prior drop rather than marking a new trend.
Wages
Average hourly wages among employees rose 2.2% year over year to $37.89 (+$0.83), after 2.3% in September (not seasonally adjusted). Wage growth is one of the series the Bank of Canada (BoC), the country’s central bank, follows alongside core inflation measures.
Interpretation
The mix points in two directions: private payrolls dipped, but they are still slightly higher than a year ago, and self-employment is up 1.9%. Single-month swings in class-of-worker data should be treated cautiously. Note that this release text contains no full-time/part-time split or participation rate, so those cannot be assessed here.
失業率6.7%の中身:職探しの増加と就職率・長期失業
Why the rate rose (per StatCan)
The unemployment rate rose 0.2 points to 6.7%, a second consecutive increase, ‘as more people searched for work (+33,000; +2.2%)’. It remains 0.2 points below a year earlier and below the April 2026 peak of 6.9%. About 1.5 million Canadians were unemployed.
Flows and duration
| Measure | October | A year earlier | 2017-2019 avg. |
|---|---|---|---|
| Job-finding rate | 18.9% | 19.8% | 24.6% |
| Layoff rate | 0.7% | 0.6% | not stated |
| Long-term unemployed (27+ weeks) | 23.7% | 21.5% | 17.2% |
The job-finding rate is the share of people unemployed in September who found work in October. The layoff rate is the share employed in September who were laid off by October. Both are not seasonally adjusted.
Long-term unemployment by age: 55+ at 32.7% (27.9% a year ago), core-aged at 25.3% (23.3%), youth at 15.2% (14.4%).
Interpretation
With layoffs essentially flat but job-finding well below its pre-pandemic average, the data suggest that the difficulty is more about how long it takes to land a job than about a wave of dismissals. This is our reading, not a StatCan conclusion. For context, a layoff rate of 0.7% is a measure of inflows to unemployment, so it is a useful cross-check on whether a rising rate reflects weakening labour demand or more job seekers entering the market. StatCan itself points to the latter for October.
年齢層別:若年層の失業率が13.7%へ、25〜54歳は横ばい
Unemployment by age group, October
| Group | Rate | Monthly change |
|---|---|---|
| Youth (15-24) | 13.7% | +0.7 pts |
| Core-aged men (25-54) | 5.8% | unchanged |
| Core-aged women (25-54) | 5.3% | unchanged |
| Aged 55+ | 5.5% | +0.2 pts |
Youth
The youth unemployment rate rose 0.7 points to 13.7% ‘as employment edged down and more youth searched for work’, after three months of little variation. Year over year it was little changed. Among youth (not seasonally adjusted), the rate was 13.5% for students and 12.3% for non-students; 63.3% of youth were attending school (62.2% a year earlier). The youth employment rate was 54.0%, little changed on the month and the year.
Core-aged workers
Rates were unchanged for both men and women, and employment held steady. For women, the rate was 0.4 points lower than a year earlier.
Aged 55 and older
The rate rose 0.2 points to 5.5% as employment edged down (-14,000; -0.3%); it was little changed year over year.
“For those in the core age group (25 to 54 years old), the unemployment rate was unchanged for both men (5.8%) and women (5.3%).”
Takeaway
The October increase in the headline rate is concentrated among youth and older workers, while the core-aged group, which makes up the bulk of the labour force, was stable. Youth rates are volatile month to month, and StatCan’s 68% confidence convention means single-month moves deserve caution. For international readers: Canada’s youth rate is defined, as in the US, for ages 15-24 (US data typically use 16-24), so direct comparisons should be made carefully.
業種別・州別:卸売・小売が減少、建設と教育は増加。アルバータは悪化
Employment by industry (October)
| Industry | Monthly change | Year over year |
|---|---|---|
| Wholesale and retail trade | -29,000 (-1.0%) | -113,000 (-3.7%) |
| Construction | +16,000 (+0.9%) | +47,000 (+2.9%) |
| Educational services | +15,000 (+1.0%) | -48,000 (-3.0%) |
Year-over-year declines in wholesale and retail were concentrated in Ontario, Quebec and British Columbia. The educational services gain only partly offsets the September drop of 35,000 (-2.2%).
Provincial picture
- Alberta: employment -24,000 (-0.9%), unemployment rate 7.3% (+0.9 pts). This offset a similar-sized September gain (+23,000); employment is still up 41,000 (+1.6%) on the year.
- British Columbia: +12,000 (+0.4%), unemployment rate 6.3%, after -20,000 in September.
- Quebec: employment steady after a cumulative 68,000 (-1.5%) decline in August-September; unemployment rate fell 0.3 pts to 5.7% as fewer people searched for work, though it is 0.4 pts above a year ago.
- Ontario: employment little changed for a third month; unemployment rate +0.3 pts to 7.3%, but 0.3 pts lower than a year earlier.
- Newfoundland and Labrador +2,900 (+1.2%); Prince Edward Island -1,300 (-1.3%).
“Employment in Alberta fell by 24,000 (-0.9%) in October, offsetting a similar-sized increase in September.”
Interpretation
Provincial LFS figures are based on much smaller samples than the national estimate, so they swing more from month to month. Alberta’s drop reverses a September gain and employment remains higher year over year, so it is hard to call it a trend. Retail and wholesale, with a 3.7% annual decline across several large provinces, looks like the more persistent weakness in this release, while construction offers a counterweight (+2.9% y/y). For comparison, US sector data come from a separate employer survey, so industry detail is not directly comparable.
スポットライト:家計の苦しさが2022年以来初めて上昇、仕事への満足度は60.9%
Household financial strain
In October 2026, 29.7% of Canadians aged 15 and older lived in a household that had found it difficult to meet its financial needs (transportation, housing, food, clothing and other necessary expenses) over the previous four weeks. The share had fallen from 35.5% in October 2022 to 27.7% in October 2025, but rose 2.0 percentage points over the latest 12 months, the first increase since 2022.
By area (15 largest CMAs): highest in Southern Ontario, led by Oshawa (38.4%), Windsor (36.9%) and Hamilton (35.9%), all with unemployment rates above the national average; lowest in Québec City (15.7%).
By household type (core-aged persons): single-parent households 47.2%, couples with children 33.0%, couples without children 27.3% (+2.0 pts in a year).
“After recording a downward trend from October 2022 (35.5%) to October 2025 (27.7%), this proportion rose 2.0 percentage points in the 12 months ending in October 2026.”
Job satisfaction
This month’s LFS also asked employed Canadians aged 15-69 to rate job satisfaction on a 0-10 scale. 60.9% were ‘very satisfied’ (8-10), stable in recent years but a bit below 2023 (62.2%), when labour market conditions were more favourable.
- By age: 15-24 at 57.5%, 25-34 at 57.4%, 55-69 at 68.9%.
- By occupation: highest in natural resources/agriculture (68.5%) and management (67.4%); lowest in sales and service (54.3%), which also has the lowest average hourly wage of any broad group ($24.19).
Context
StatCan frames both items as parts of its Quality of Life framework, complementing headline labour statistics with measures of household well-being. The release does not explain why financial strain turned up, so the data should be read as a descriptive snapshot rather than a causal story. The geographic overlap between high strain and above-average unemployment in Southern Ontario is, however, stated in the source.
BOC・HMMの視点:失業率6.7%の水準とトレンド、次回の確認点
The observation variable
The Bank of Canada (BoC) hidden Markov model (HMM) uses the Canadian unemployment rate as an observation variable. This release updates it to 6.7%. What the data say about level and trend:
| Dimension | Reading |
|---|---|
| Level | 6.7%, below the April 2026 peak of 6.9% |
| Recent direction | Up 0.2 pts, a second consecutive rise |
| Year over year | 0.2 pts lower |
| Employment rate | 60.5%, third straight decline |
| Wages (y/y) | +2.2% (Sept: +2.3%) |
| Job-finding rate | 18.9% (2017-19 avg.: 24.6%) |
Cooling versus resilience
Signs of cooling: a third monthly fall in the employment rate, two consecutive rises in unemployment, a subdued job-finding rate, a higher long-term unemployment share (23.7%), and slightly slower wage growth.
Signs of resilience: the rate is below last year’s level and the April peak, the layoff rate is flat at 0.7%, core-aged unemployment was unchanged, and construction and education added jobs.
Our interpretation
Nothing in this release points to an overheating labour market. We read it as a mix of gradual cooling and underlying resilience. StatCan attributes the rise in unemployment to more people searching for work, not to higher layoffs, which matters for how the data are read. Still, this is a single month with sampling variability (StatCan uses a 68% confidence convention), so it should not be treated as a confirmed trend.
On the policy regime
The release contains no statement on BoC policy, and the model’s current regime (Hawkish/Neutral/Dovish) is not given in the source. Whether the regime continues or shifts therefore cannot be judged from this document alone; the figures are best viewed as an update to the unemployment input. For international readers, this contrasts with the US, where the Fed often looks at both household-survey unemployment and employer-survey payrolls; Canada’s LFS is the primary monthly labour indicator, with payroll-based data (SEPH) following later.
What to check next
The November LFS is due on December 4, 2026 (reference week November 8-14). Key points: whether the unemployment rate moves from 6.7%, and the direction of the employment rate (60.5%) and year-over-year wage growth (2.2%).
Disclaimer: This article is for informational purposes only. All investment decisions are made solely at your own risk.