📺 Watch the Full Video Analysis
This article was automatically generated by the NFC Market Live AI analysis system. (Updated: 2026-11-03 06:51 JST)
📊 A deep dive into Apple’s (AAPL) fiscal Q4 2026 results (Jul-Sep), released Nov 2.
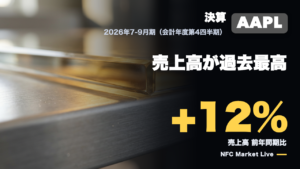
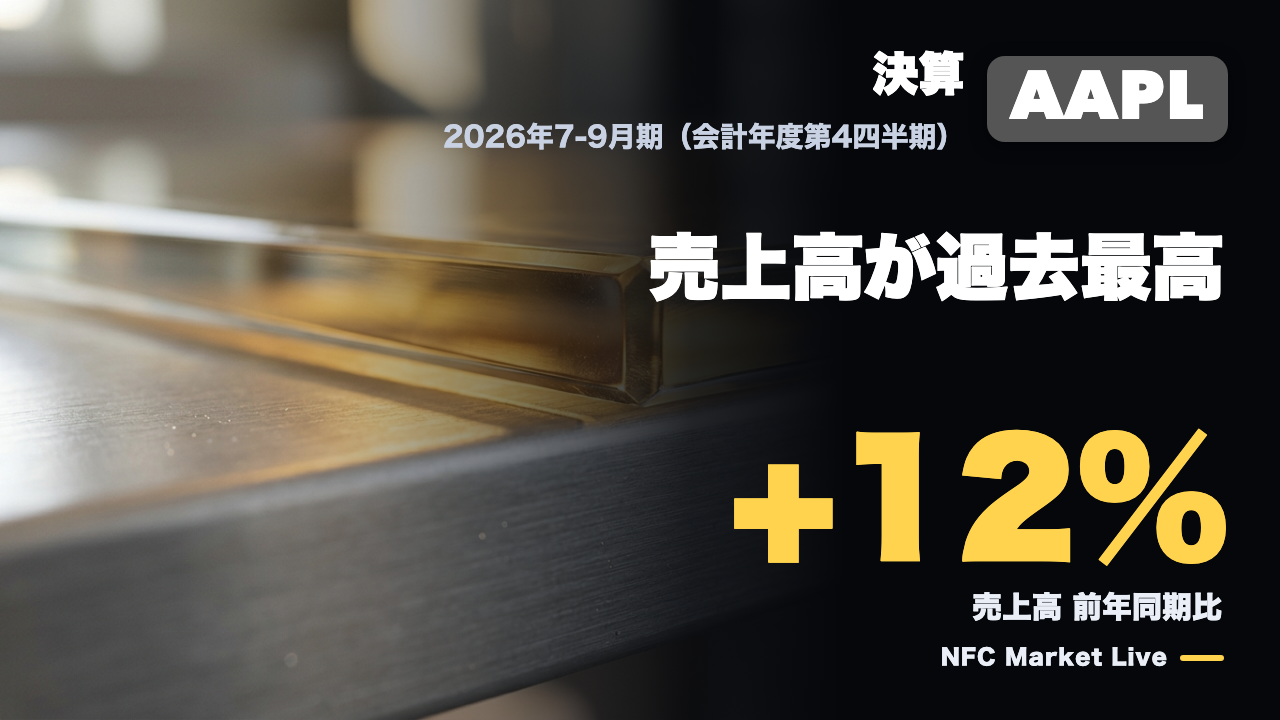
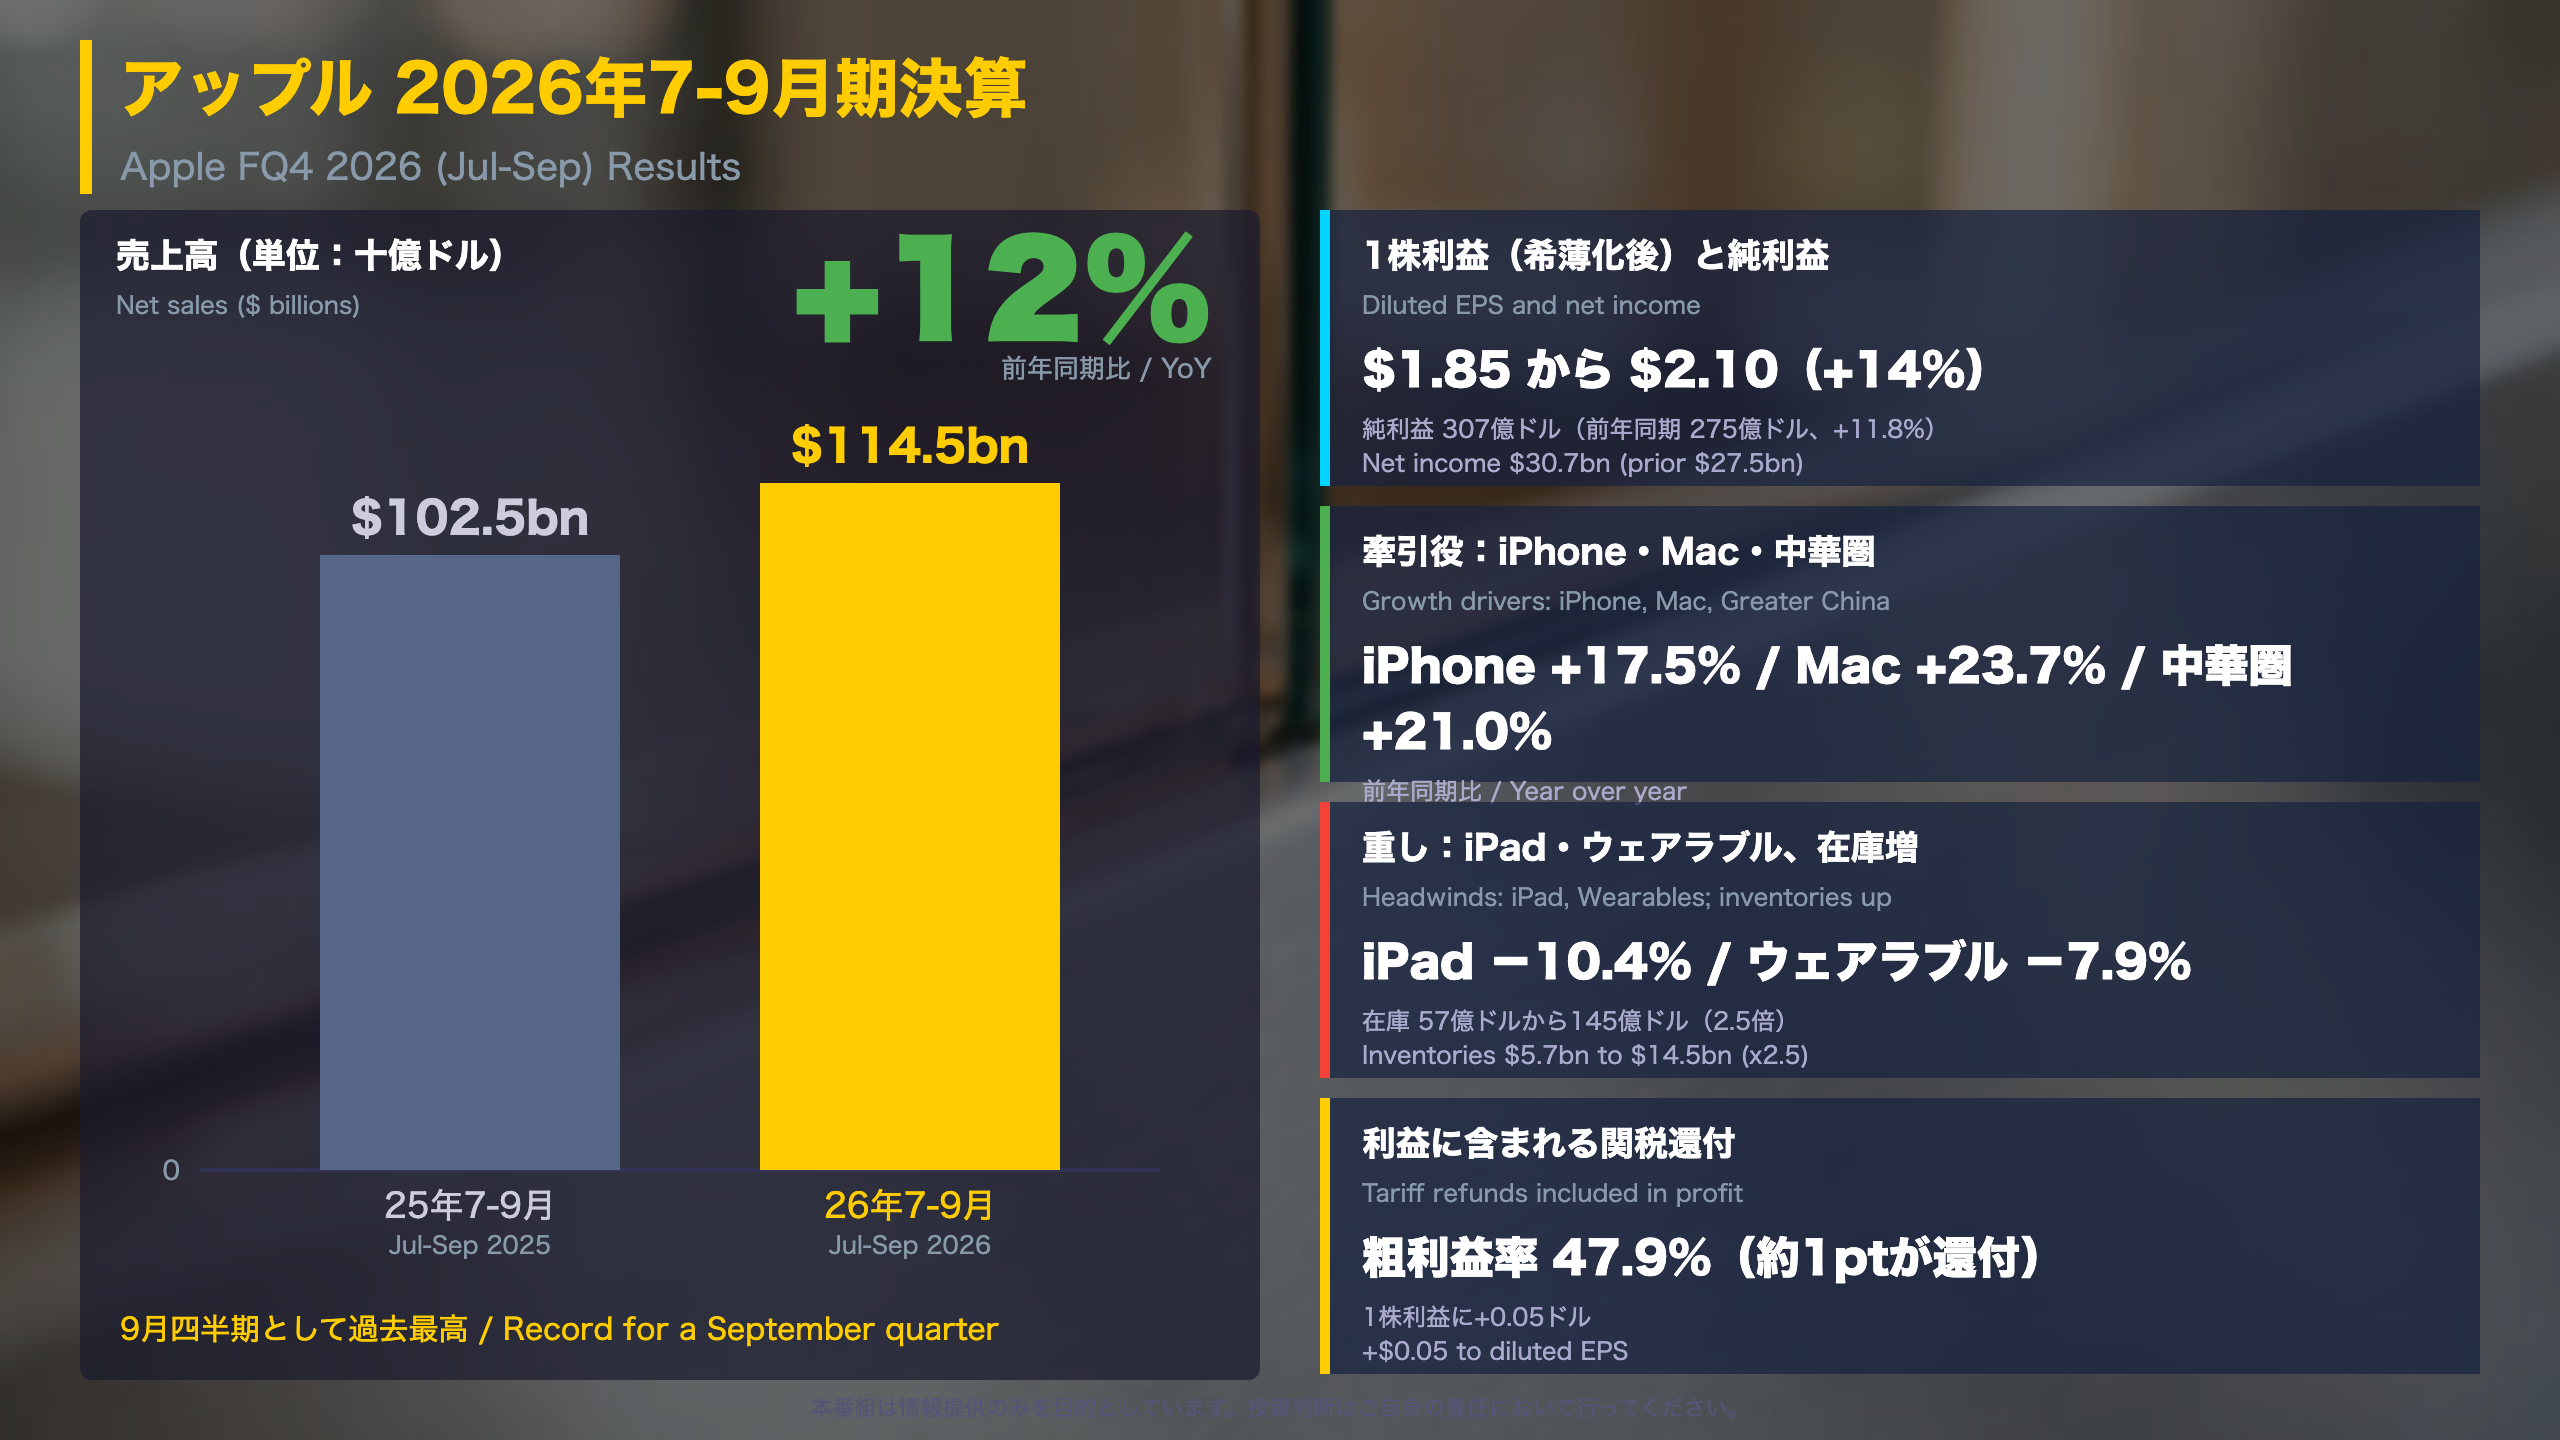
📈 Revenue was $114.5bn, up 12% YoY, and diluted EPS was $2.10, up 14%. iPhone, Mac and Greater China grew, and Services hit an all-time high.
⚠️ iPad and Wearables fell YoY. Gross margin includes about 1 point from tariff refunds, and inventories more than doubled from a year ago.
💡 The release gives no outlook; inventory trends are a key item to check next.
For information only, not investment advice.
決算サマリー:9月四半期で売上最高、中身にも注目
Apple’s FY2026 Q4: the full-year frame
What this document is. The release is Exhibit 99.1 to a Form 8-K filed with the U.S. Securities and Exchange Commission. Apple’s fiscal year ends in the last week of September, so its ‘fourth quarter’ covers July-September.
Headline figures
| Q4 FY26 | Q4 FY25 | |
|---|---|---|
| Net sales | $114.5bn | $102.5bn |
| Operating income | $35.6bn | $32.4bn |
| Net income | $30.7bn | $27.5bn |
| Diluted EPS | $2.10 | $1.85 |
Full-year sales were $478.8bn (+15.1%) and diluted EPS was $8.98 versus $7.46.
Why EPS grew faster than net income
Net income rose about 11.8% while EPS rose 14%. Diluted shares fell to 14.63bn from 14.86bn (about -1.6%), consistent with the $86.4bn of buybacks over the year.
Two readings
- Constructive: records for revenue, iPhone, net income and EPS in a September quarter; full-year operating cash flow of $145.1bn versus $111.5bn.
- Cautious: operating income grew about 9.9%, slower than sales, and part of the result reflects tariff refunds.
For Japan-based investors
The Japan segment (about $6.5bn) was the only one of five reporting regions to decline, at -1.4%.
What the release does not contain
No guidance for next quarter appears in the document, and Apple reports GAAP figures only here. The earnings call is at 2:00 p.m. PT on November 2, 2026.
深掘り1:どこが伸び、どこが落ちたか
Where growth came from: products and regions
Product categories (YoY)
| Category | Q4 sales | YoY |
|---|---|---|
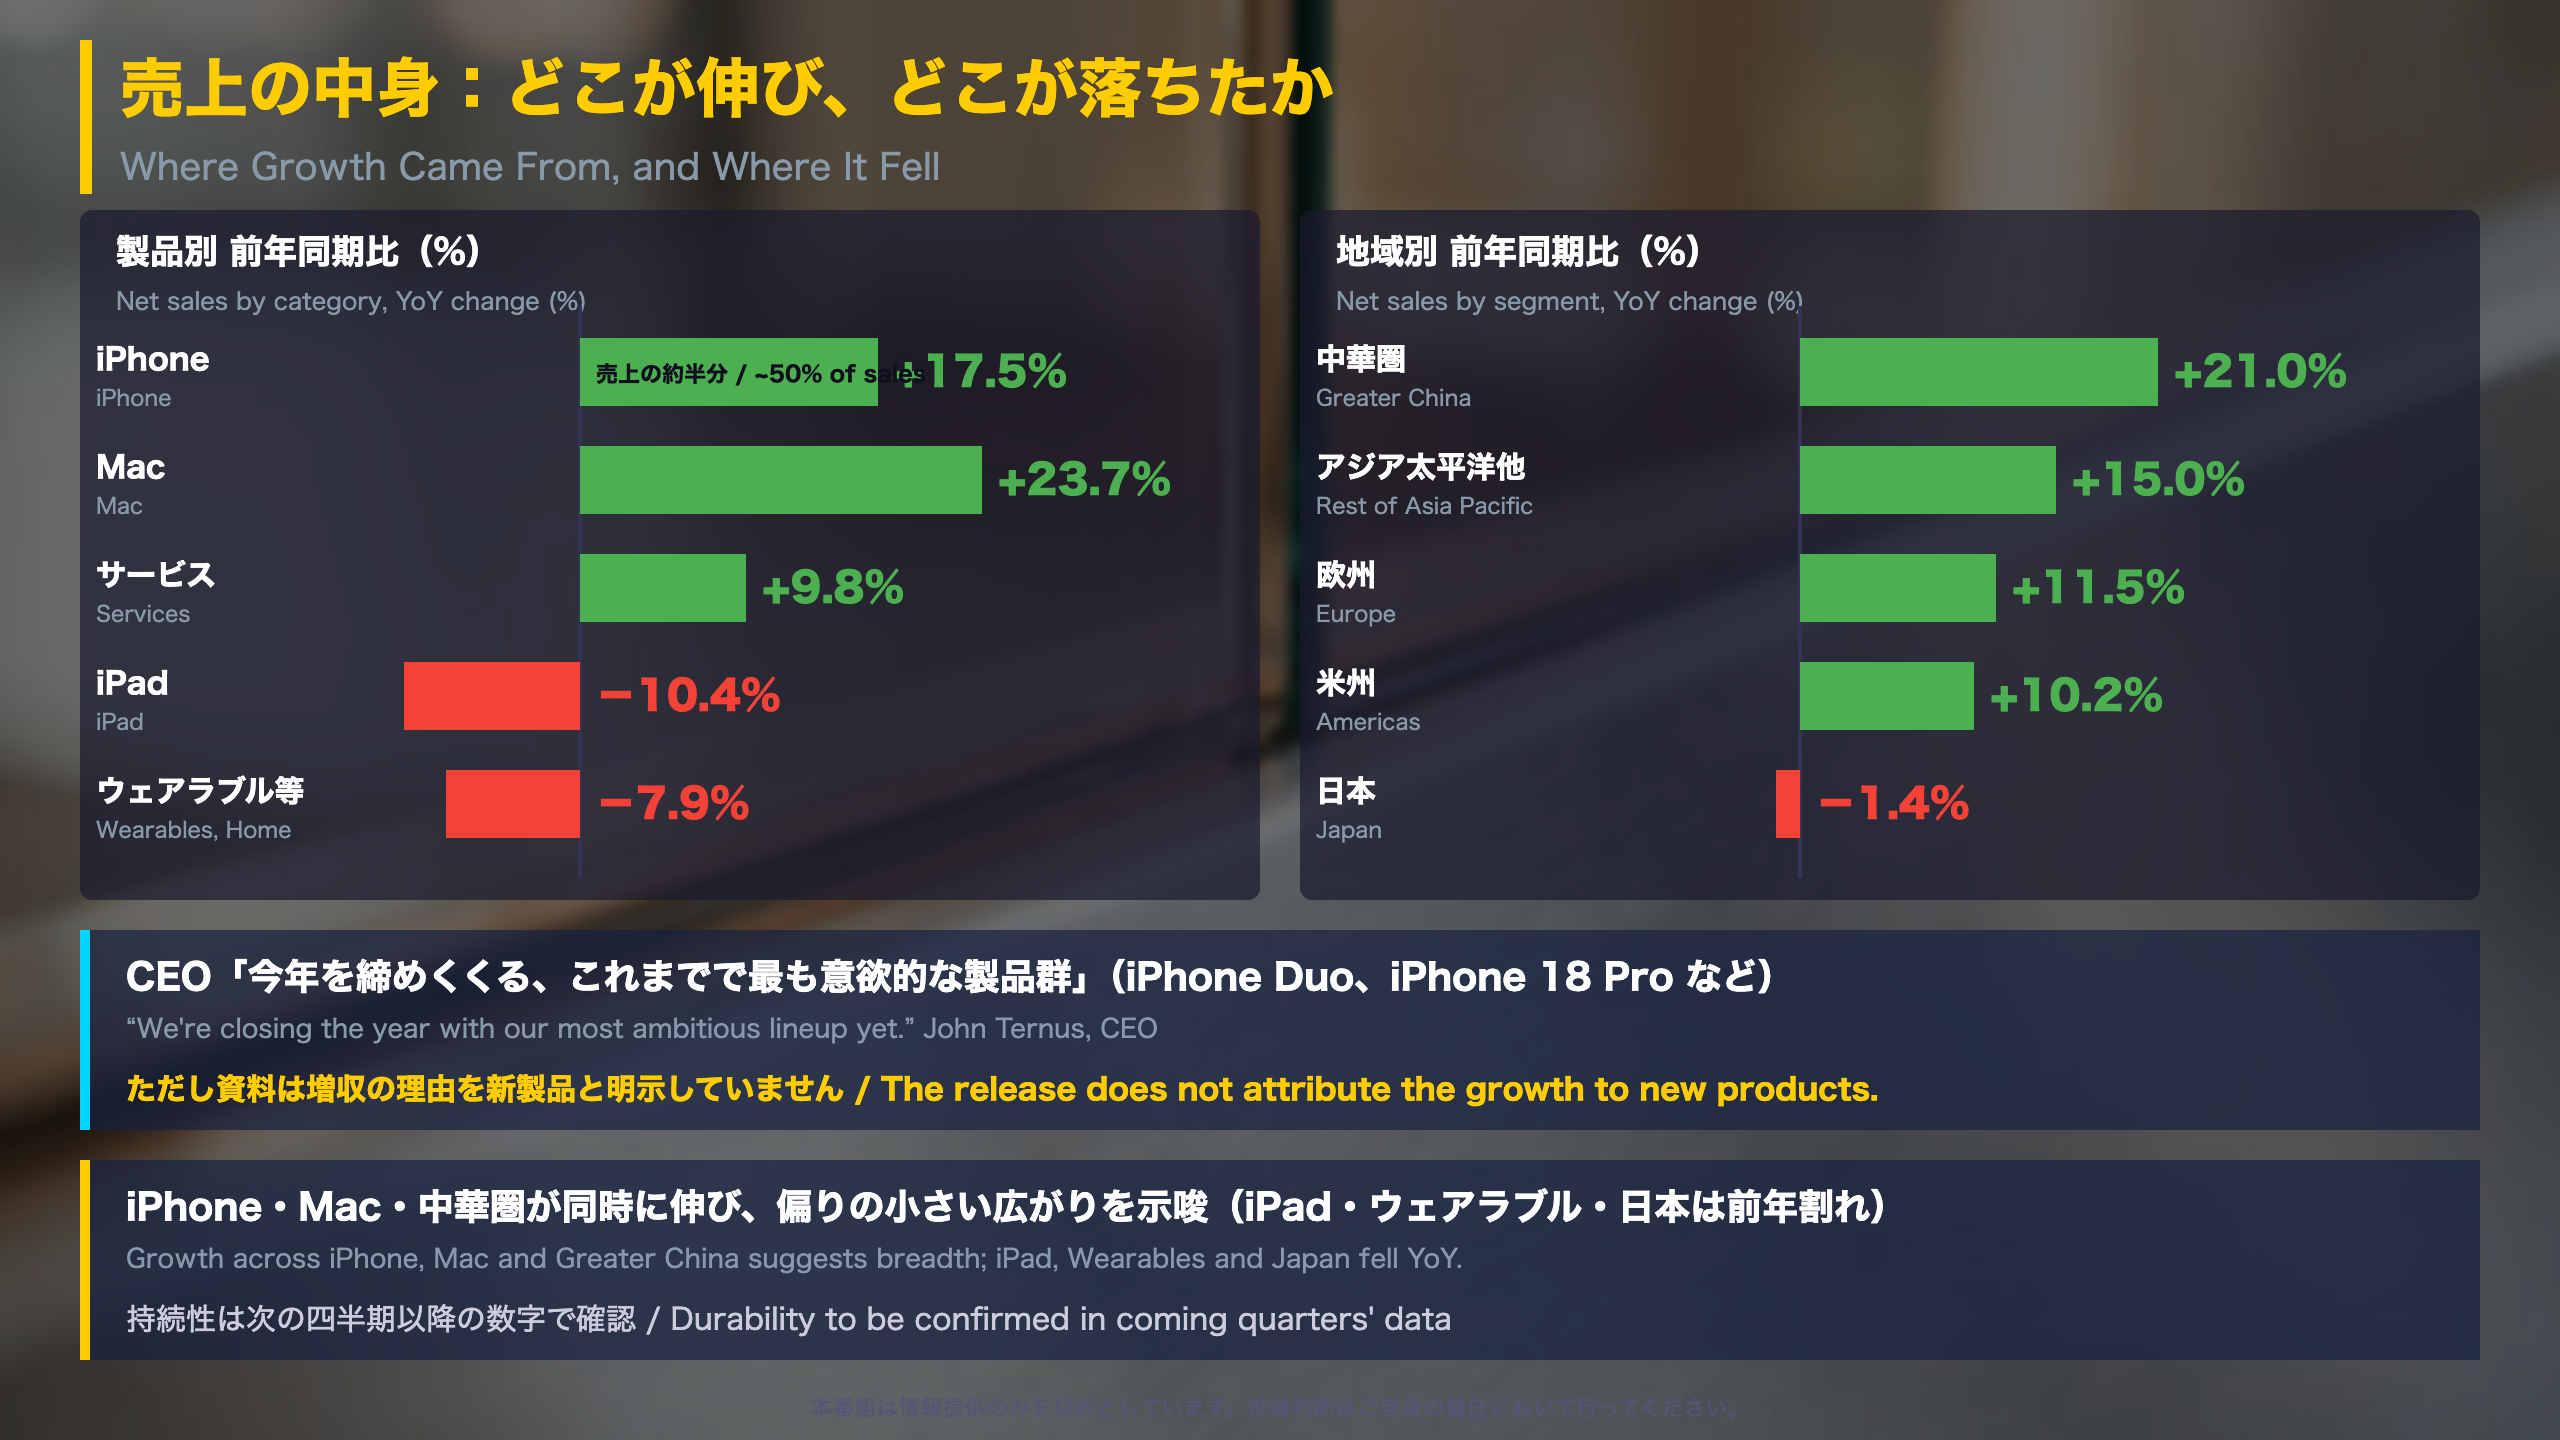
| iPhone | $57.6bn | +17.5% |
| Mac | $10.8bn | +23.7% |
| Services | $31.6bn | +9.8% |
| iPad | $6.2bn | -10.4% |
| Wearables, Home & Accessories | $8.3bn | -7.9% |
Regions
Greater China (+21.0% to $17.5bn) led the five reporting segments, followed by Rest of Asia Pacific (+15.0%), Europe (+11.5%) and the Americas (+10.2%). Japan fell 1.4% to $6.5bn, the only regional decline. For Japanese readers, that is worth noting given how closely Apple’s home-market trends are watched.
Full-year context
For the fiscal year, iPhone sales rose about 21% to $254.1bn and Greater China rose about 28% to $82.4bn, so the quarter’s growth rates were lower than the annual pace.
Reading the mix
- Gains in several products and regions at once suggest breadth rather than reliance on a single line.
- Services is a record, but at +9.8% it grew more slowly than total sales (about +12%).
- The release does not attribute growth to new products. CEO John Ternus says: ‘We’re closing the year with our most ambitious lineup yet.’
Durability can only be judged with later quarterly data; the release offers no forward view.
深掘り2:利益の中身(還付・研究開発費・在庫)
Quality of earnings, line by line
Tariff refunds
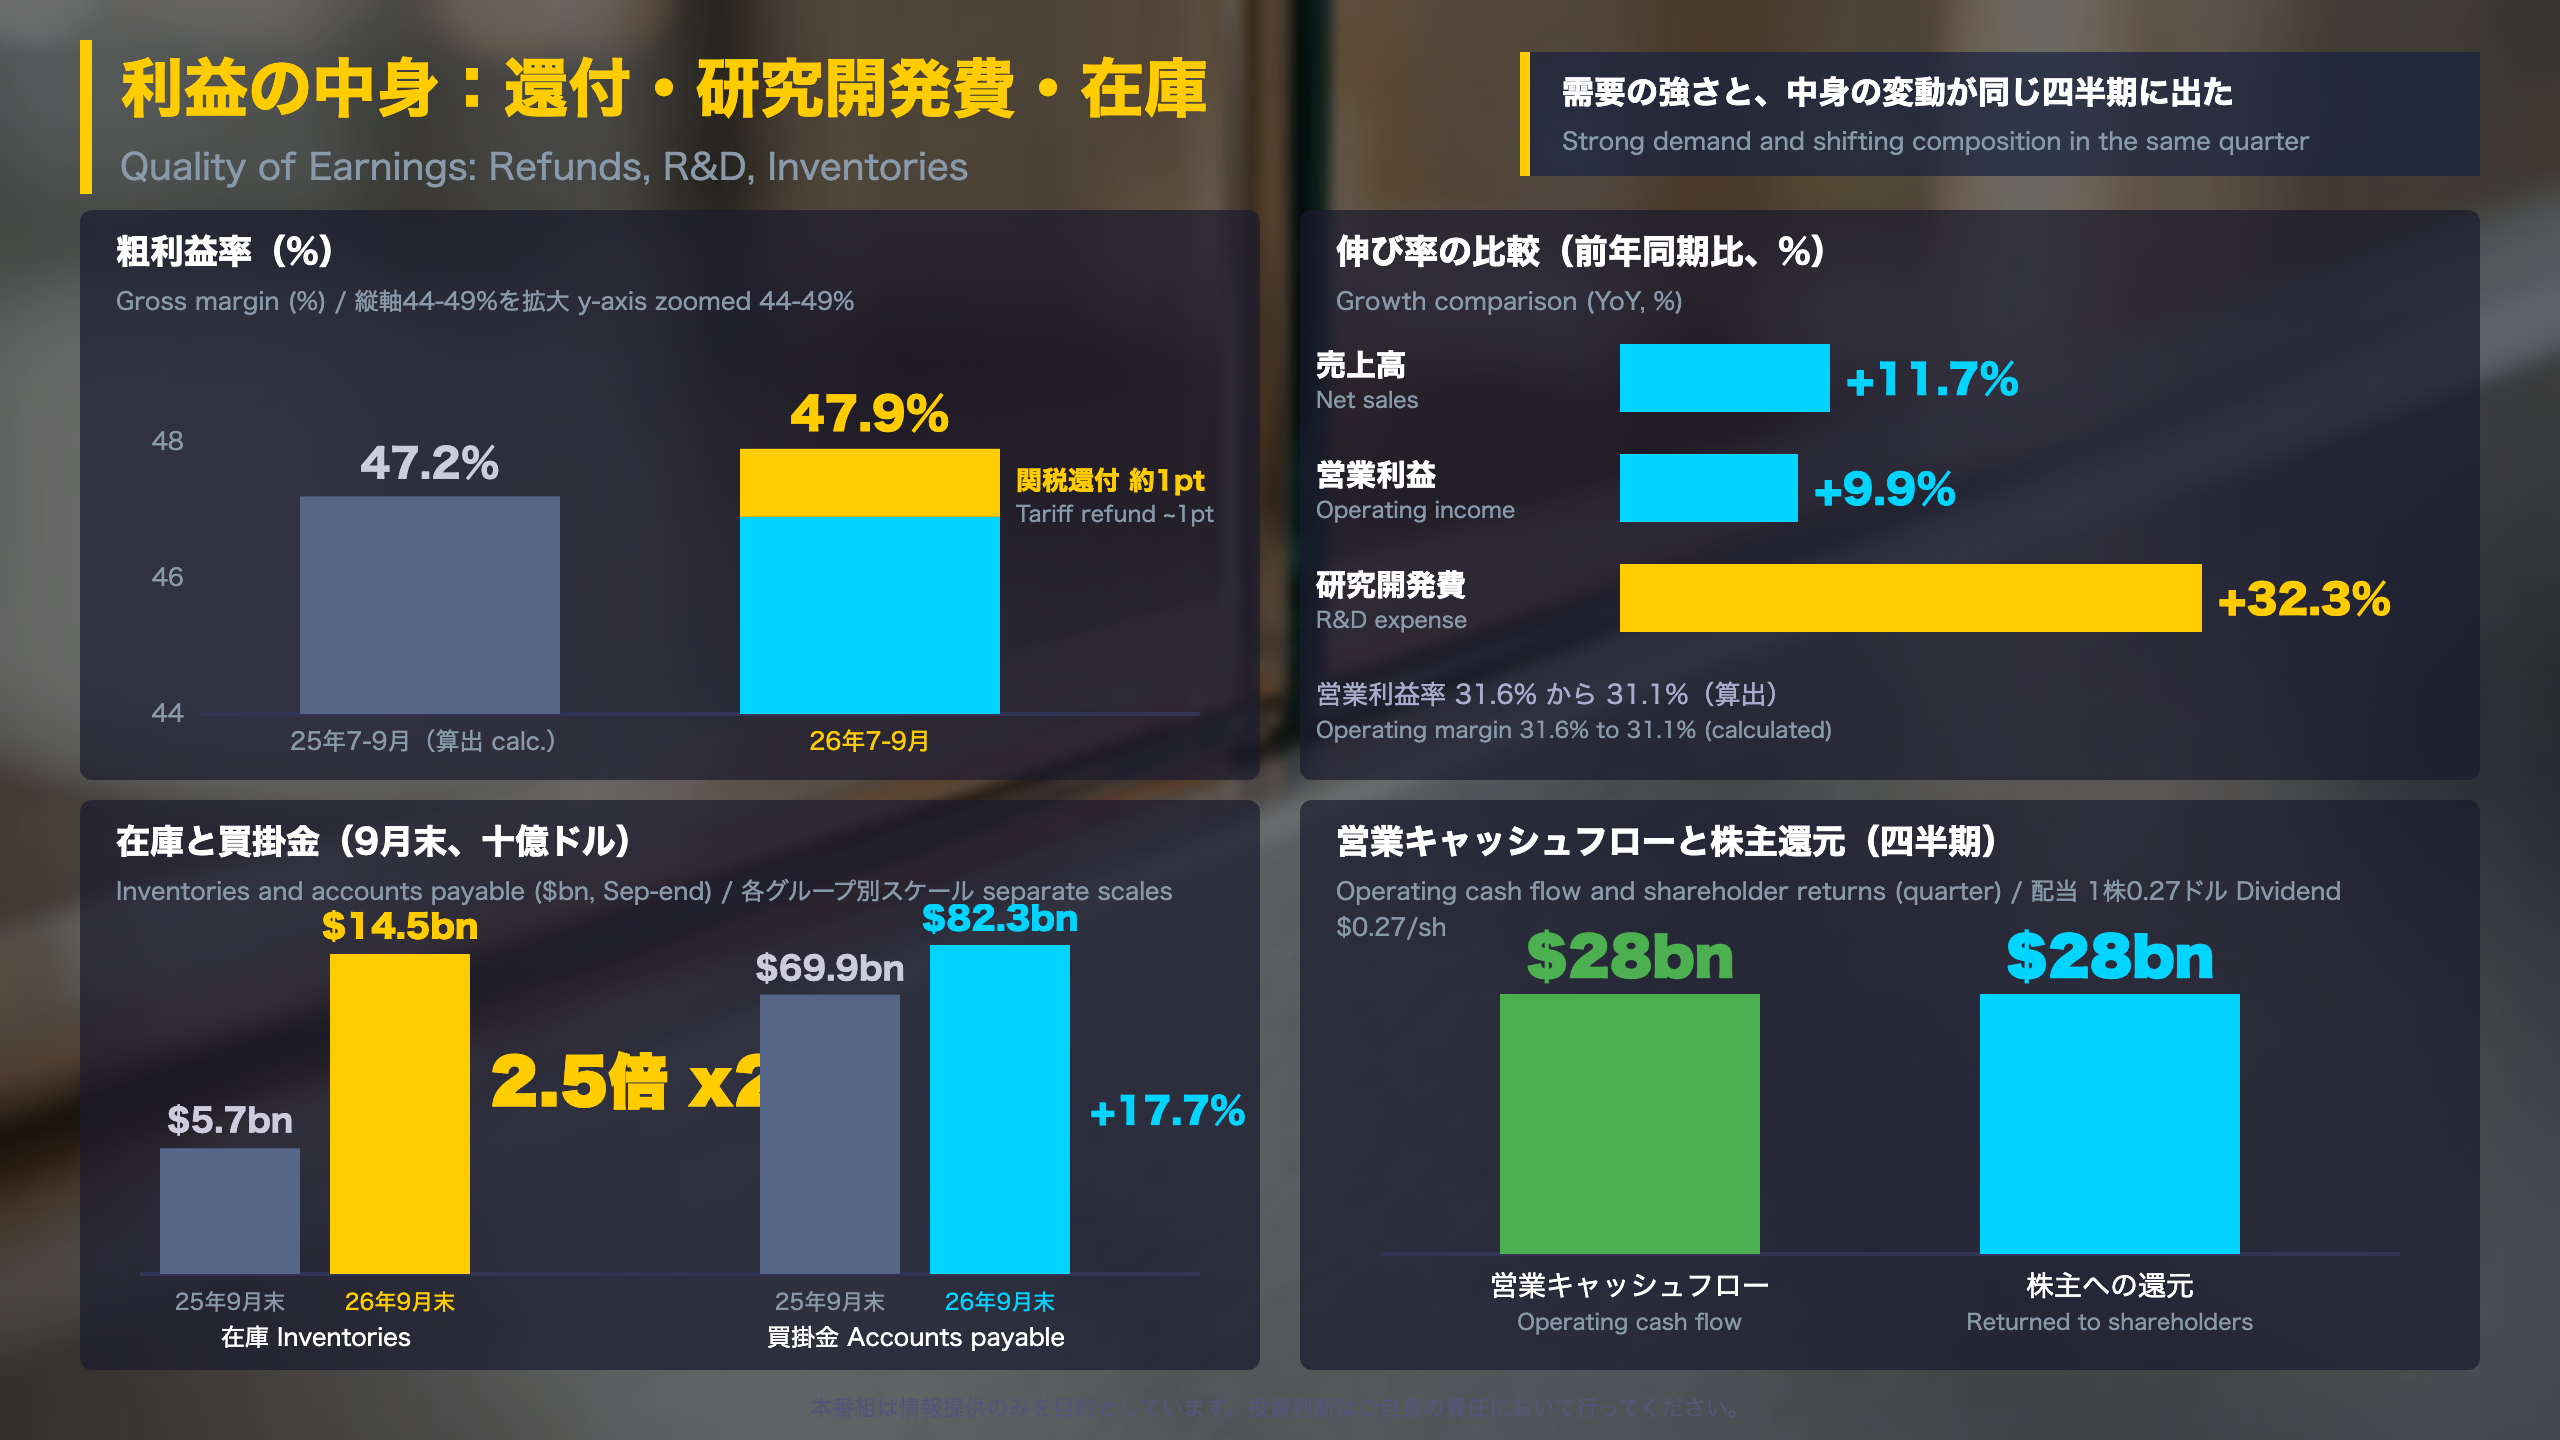
The release states that the 47.9% gross margin includes ‘a favorable impact of approximately 1 percentage point from tariff refunds’, and that diluted EPS includes a favorable $0.05. It does not say whether refunds will recur. Apple reports GAAP figures only in this release; no adjusted EPS is shown.
Margin structure (our calculation)
| Q4 FY26 | Q4 FY25 | |
|---|---|---|
| Total gross margin | 47.9% | ~47.2% |
| Products | ~37.2% | ~36.2% |
| Services | ~76.0% | ~75.3% |
Costs and tax
- R&D: $11.7bn, +32.3% YoY (full year $45.8bn).
- SG&A: $7.5bn, +5.8%.
- Effective tax rate: about 15.0% versus 16.3% a year ago.
Balance sheet
Inventories rose to $14.5bn from $5.7bn (about 2.5x), accounts payable to $82.3bn from $69.9bn, and intangible assets to $20.3bn from $11.1bn. The release gives no explanation for the inventory build.
Two readings
- Constructive: quarterly operating cash flow of $28bn, all returned to shareholders.
- Cautious: operating income (+9.9%) lagged sales (+12%), and inventory and refund effects are unexplained in the document.
質疑で深める:依存度・利益構造・在庫
Q&A supplement: profit mix, shareholder returns, dates
Revenue and gross profit mix (our calculation)
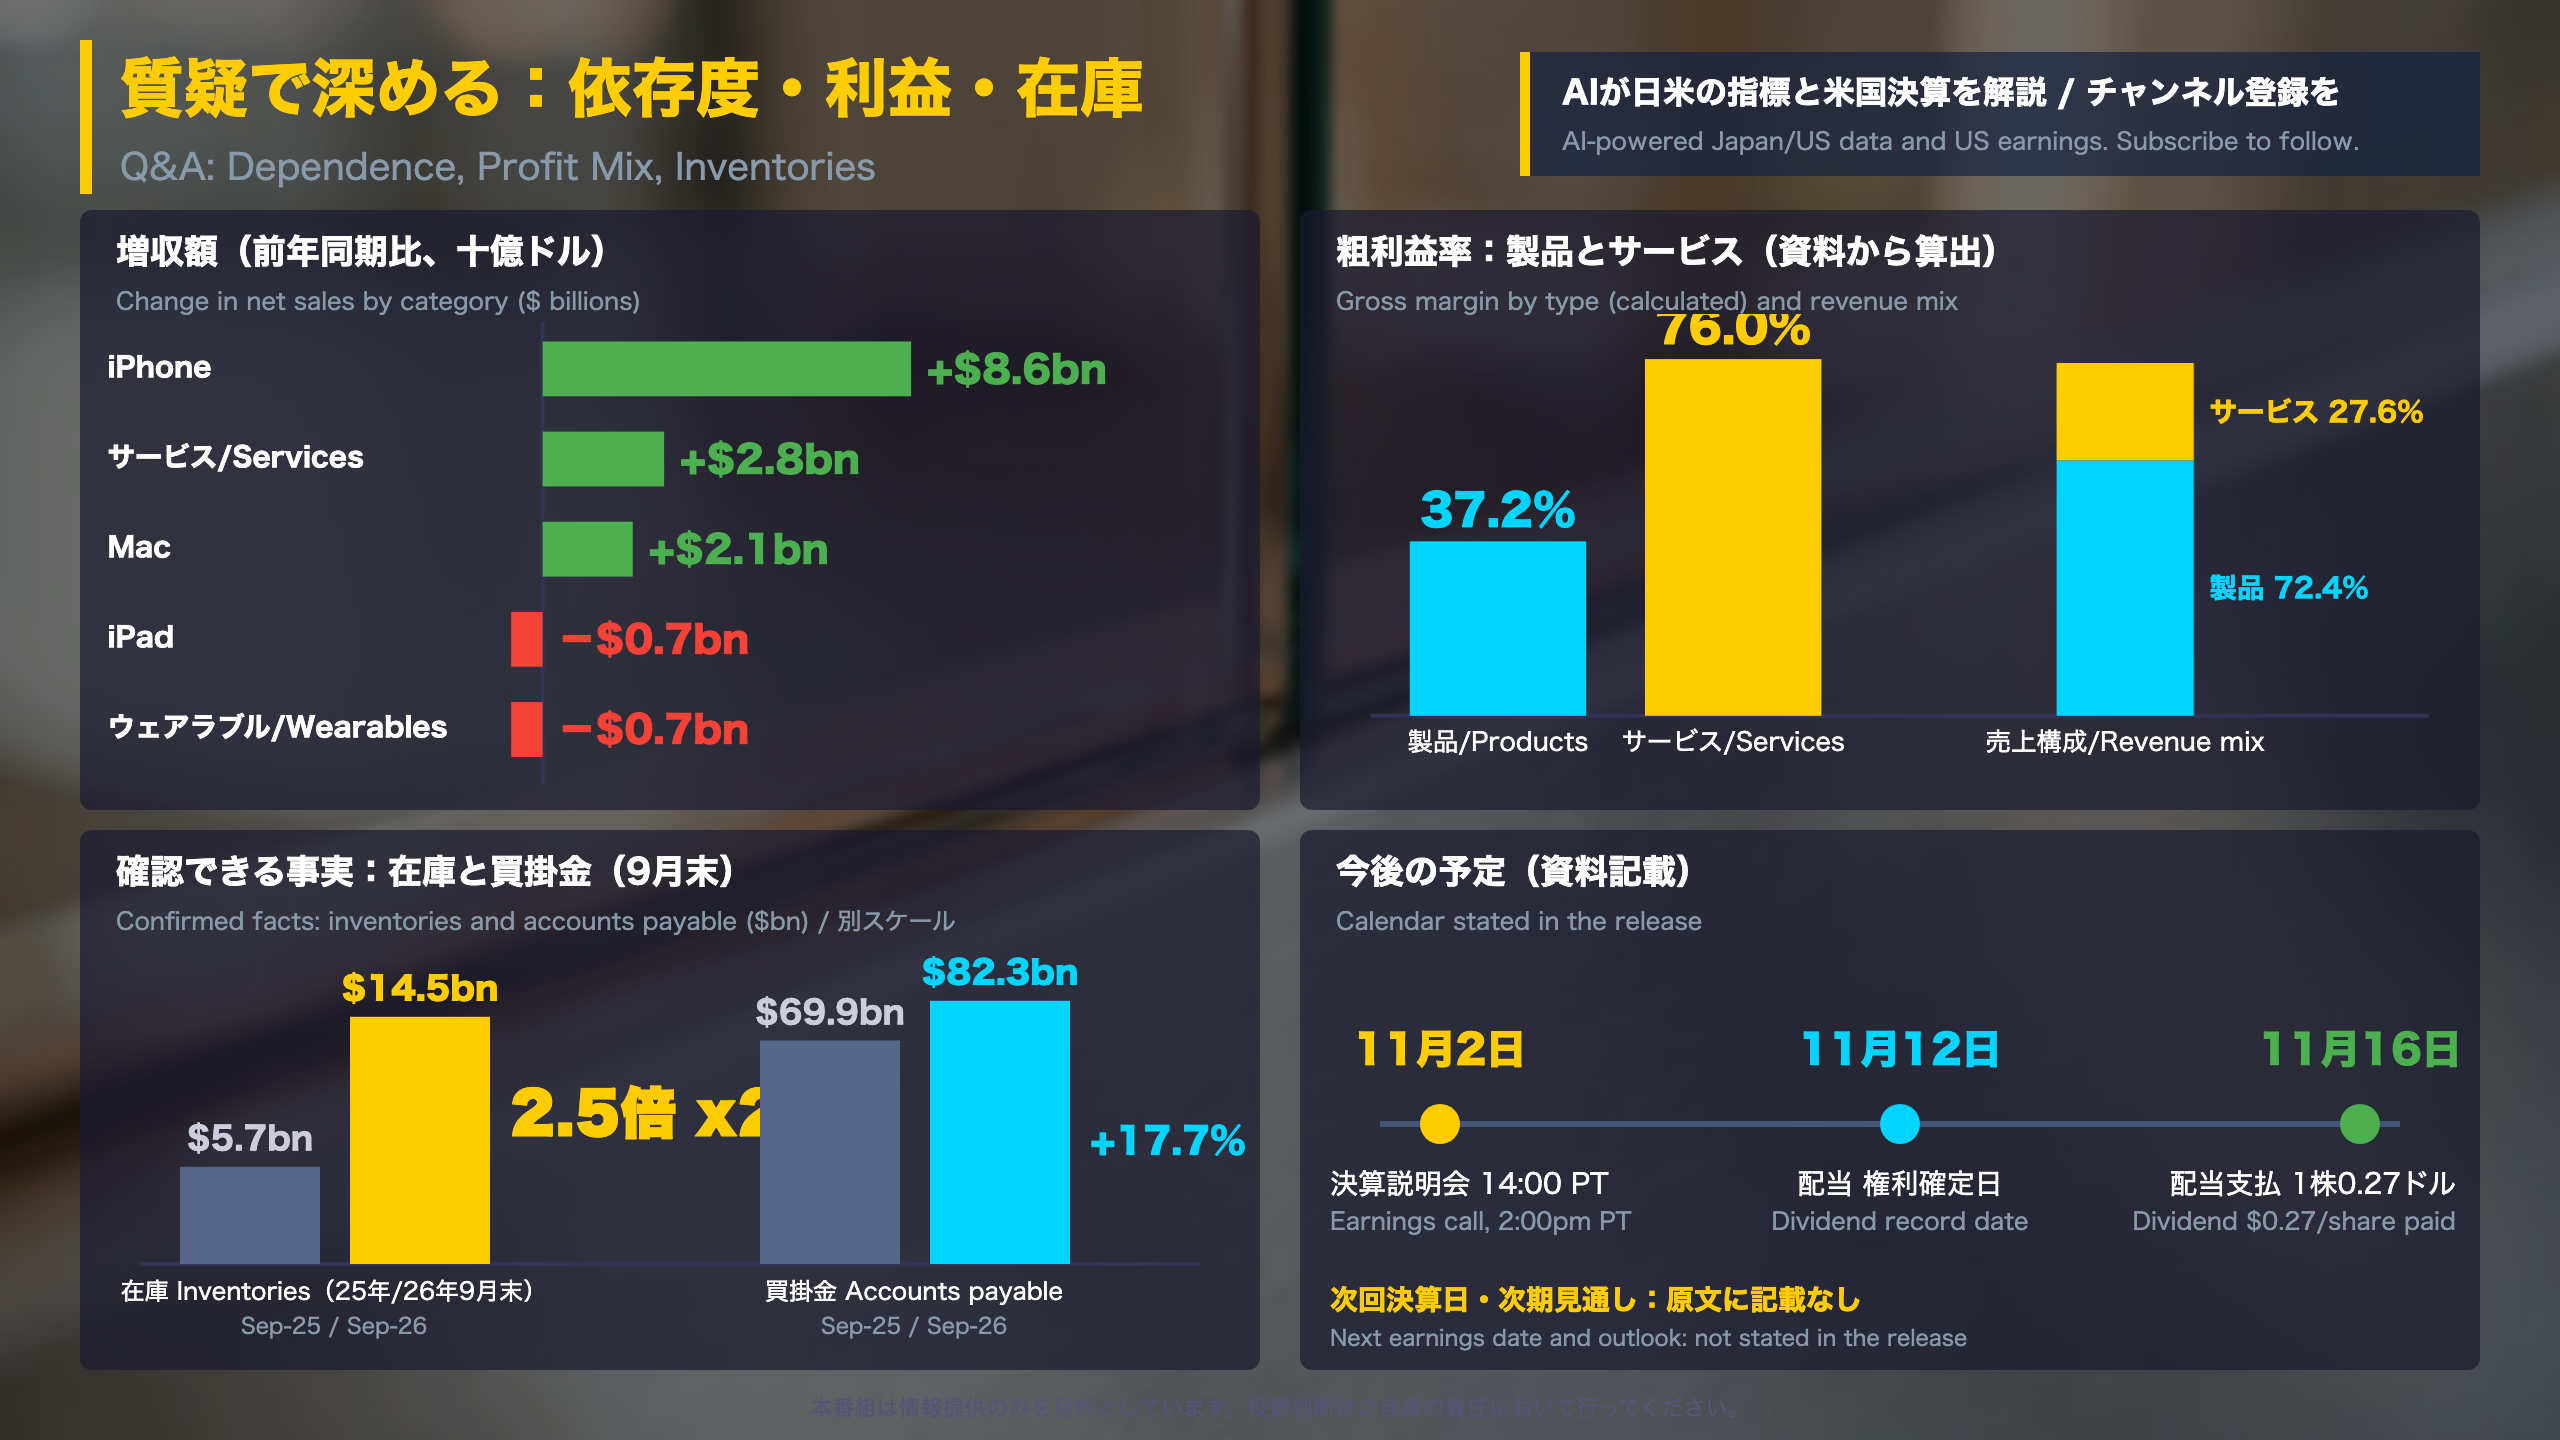
Q4 sales split into Products $82.9bn (72.4%) and Services $31.6bn (27.6%). In gross profit terms, Products contributed about $30.8bn and Services about $24.0bn, so Services, a little over a quarter of sales, generated roughly 44% of gross profit.
Dollar contribution to growth
Versus a year earlier, sales rose by $8.6bn at iPhone, $2.8bn at Services and $2.1bn at Mac, while iPad and Wearables each fell by about $0.7bn.
Shareholder returns
- $28bn returned in the quarter, according to the CFO.
- Full-year buybacks of $86.4bn (prior year $90.7bn) and dividends of $15.7bn (prior $15.4bn).
- Shares outstanding of 14.53bn versus 14.77bn.
Calendar stated in the release
| Date | Event |
|---|---|
| Nov 2, 2:00 p.m. PT | Earnings call (webcast) |
| Nov 12 | Dividend record date |
| Nov 16 | Dividend payable, $0.27 per share |
Two views
- Concentration view: iPhone added the most dollars.
- Diversification view: Services supplies about 44% of gross profit.
The release contains no outlook and no next earnings date, so this analysis stays with reported facts.
Disclaimer: This article is for informational purposes only. All investment decisions are made solely at your own risk.