This article was automatically generated by the NFC Market Live AI analysis system. (Updated: 2026-11-02 11:43 JST)
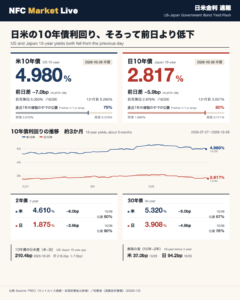
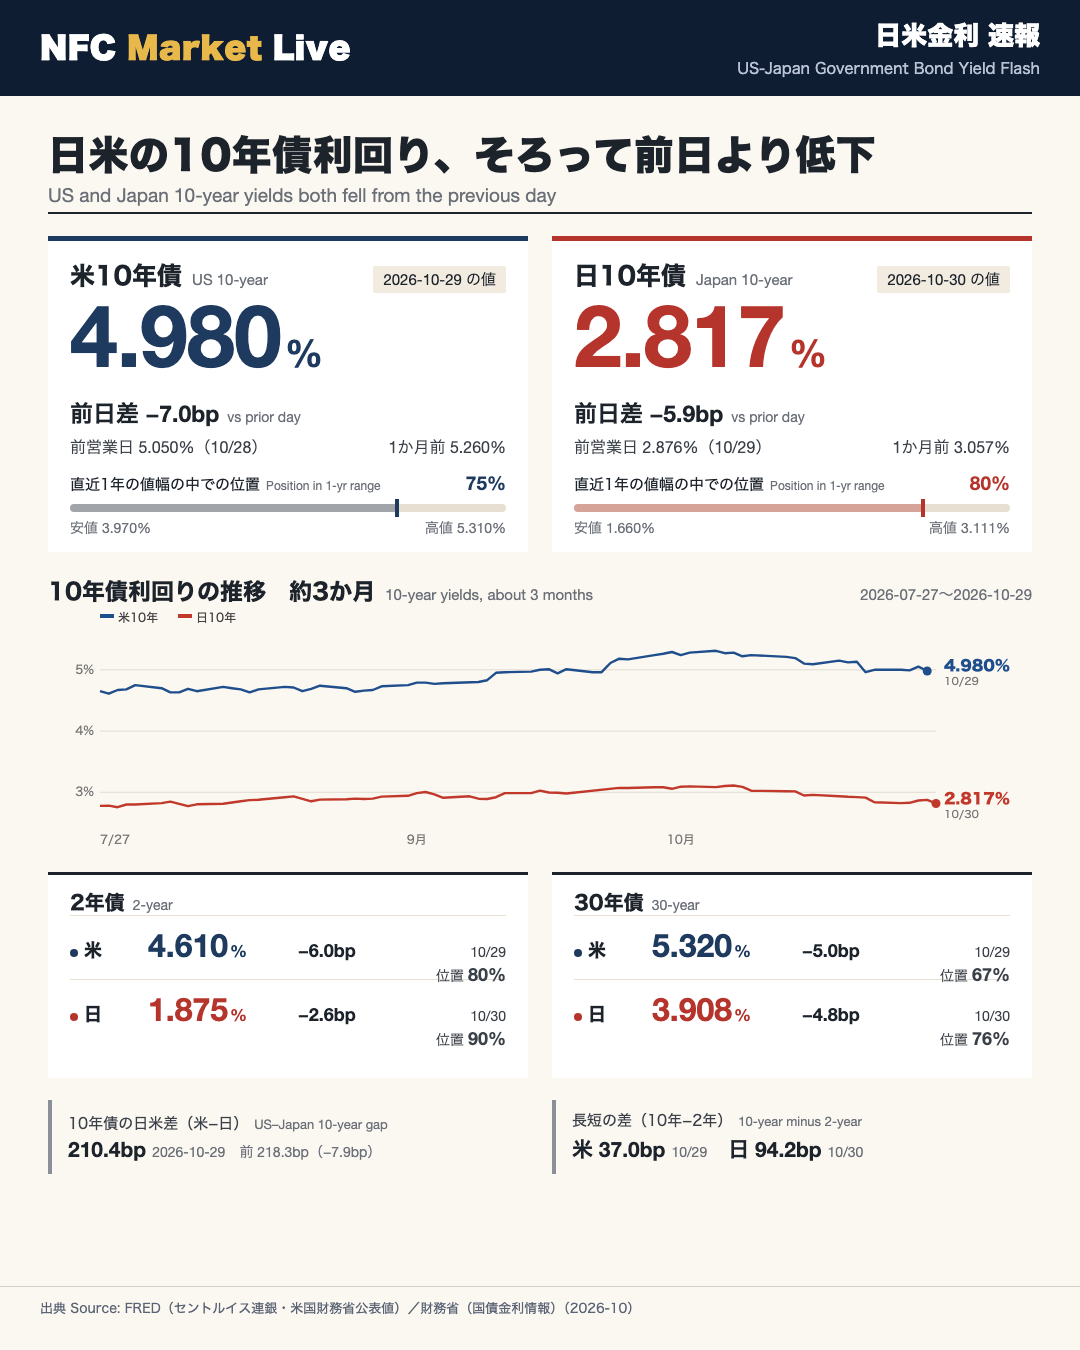
📊 US-Japan Government Bond Yield Flash (Oct 30, 2026)
US Treasury yields are for the previous business day, Oct 29. Japanese government bond (JGB) yields are the Ministry of Finance figures for Oct 30.
【10-year yields】
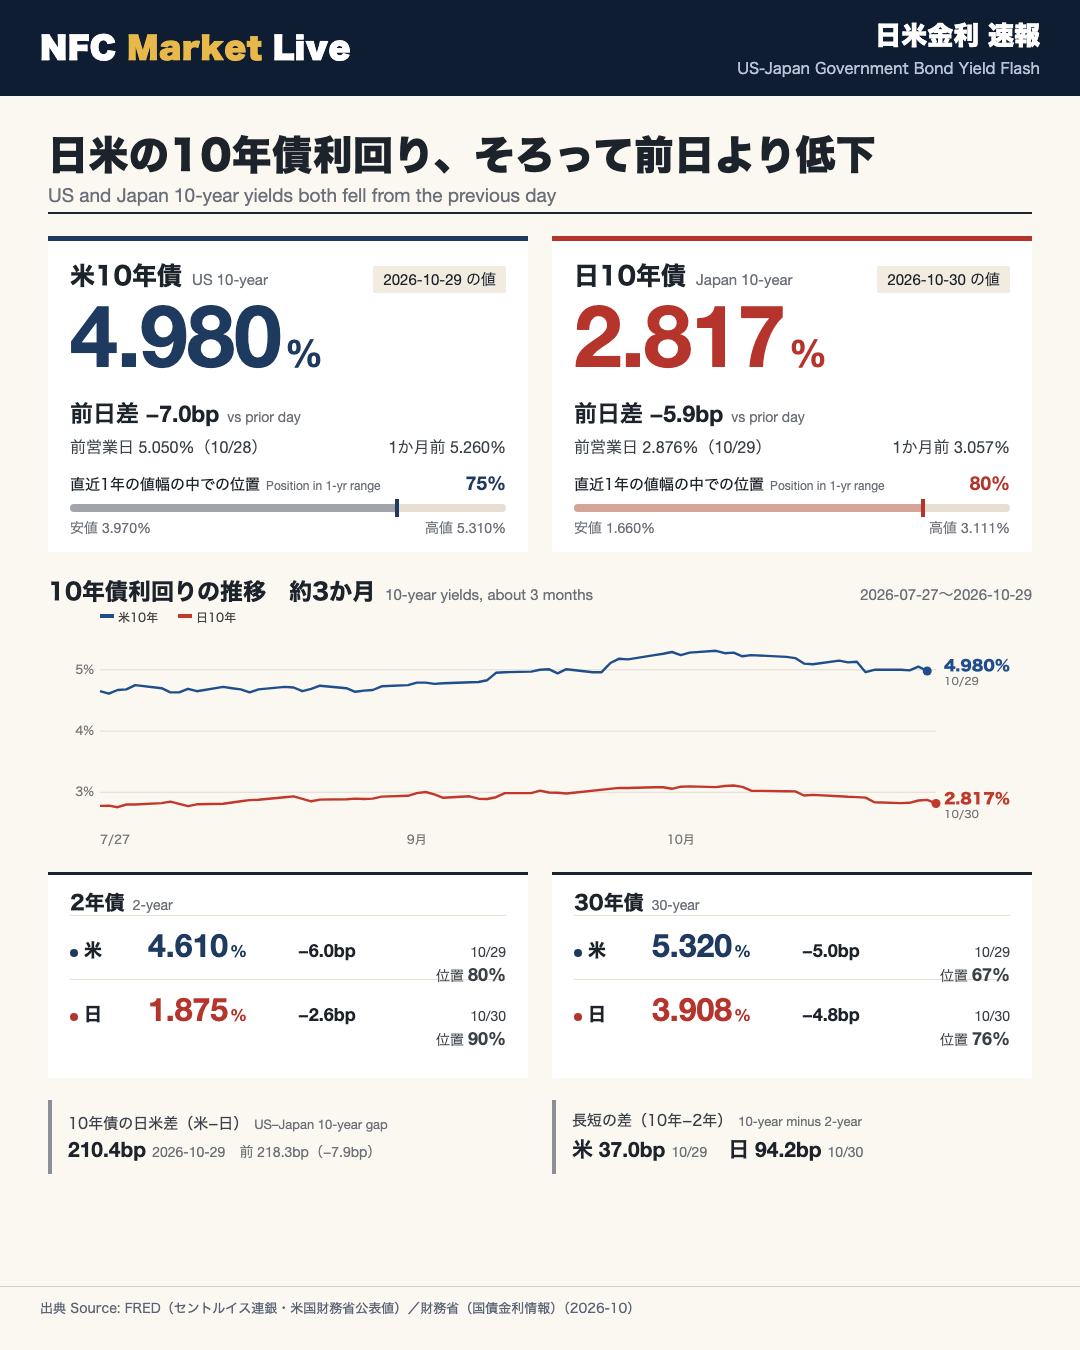
The US 10-year yield stood at 4.980% (-7.0bp on the day) and the Japan 10-year yield at 2.817% (-5.9bp). Within their ranges over the past year, the US 10-year sits at 75% and the Japan 10-year at 80% (0% = low, 100% = high).
【2-year】US 4.610% (-6.0bp, position 80%); Japan 1.875% (-2.6bp, position 90%).
【30-year】US 5.320% (-5.0bp, position 67%); Japan 3.908% (-4.8bp, position 76%).
【Side notes】
The 10-year US-Japan gap (US minus Japan) was 210.4bp on Oct 29 (218.3bp the day before). The 10s-2s spread was 37.0bp in the US (Oct 29) and 94.2bp in Japan (Oct 30).
Sources: FRED (St. Louis Fed, originally US Treasury data) and the Japanese Ministry of Finance.
日米10年債の水準
US and Japan 10-Year Yields (Lead Story)
US Treasury yields are for the previous business day (Oct 29, 2026), while Japanese government bond (JGB) yields are the Ministry of Finance figures for Oct 30, 2026. The two series carry different dates, so each number below is tagged with its own day.
| Item | US 10Y | Japan 10Y |
|---|---|---|
| Value date | 2026-10-29 | 2026-10-30 |
| Yield | 4.980% | 2.817% |
| Prior business day | 5.050% (Oct 28) | 2.876% (Oct 29) |
| Daily change | -7.0bp | -5.9bp |
| One month earlier | 5.260% | 3.057% |
| 1-year high | 5.310% (2026-10-05) | 3.111% (2026-10-07) |
| 1-year low | 3.970% (2026-02-27) | 1.660% (2025-10-30) |
| Position in 1-year range | 75% | 80% |
How to read it: one basis point (bp) is 0.01 percentage point. The position figure places today’s yield inside its own 1-year range, with 0% at the low and 100% at the high.
Recent daily path (from the source table)
- US 10Y: 4.96% (Oct 22), 5.00% (Oct 23), 5.00% (Oct 26), 4.99% (Oct 27), 5.05% (Oct 28), 4.98% (Oct 29)
- Japan 10Y: 2.837% (Oct 23), 2.824% (Oct 26), 2.829% (Oct 27), 2.867% (Oct 28), 2.876% (Oct 29), 2.817% (Oct 30)
Background on the sources
US figures come from FRED, the data service of the Federal Reserve Bank of St. Louis, and originate from the US Treasury’s published yields. Japanese figures come from the Ministry of Finance (MOF) JGB yield tables. Both 10-year yields were below their levels of one month earlier (US 5.260%, Japan 3.057%).
2年債と30年債の水準
2-Year and 30-Year Yields
These figures sit beneath the 10-year headline numbers. US values are for Oct 29, 2026; Japan values are for Oct 30, 2026.
2-year
| Item | US 2Y | Japan 2Y |
|---|---|---|
| Value date | 2026-10-29 | 2026-10-30 |
| Yield | 4.610% | 1.875% |
| Daily change | -6.0bp | -2.6bp |
| One month earlier | 4.890% | 1.952% |
| 1-year high | 4.920% (2026-09-28) | 1.981% (2026-09-28) |
| 1-year low | 3.380% (2026-02-27) | 0.928% (2025-10-31) |
| Position in 1-year range | 80% | 90% |
30-year
| Item | US 30Y | Japan 30Y |
|---|---|---|
| Value date | 2026-10-29 | 2026-10-30 |
| Yield | 5.320% | 3.908% |
| Daily change | -5.0bp | -4.8bp |
| One month earlier | 5.590% | 4.098% |
| 1-year high | 5.670% (2026-10-07) | 4.168% (2026-10-06) |
| 1-year low | 4.610% (2025-10-29) | 3.063% (2025-10-30) |
| Position in 1-year range | 67% | 76% |
Reading the table: the Japan 2-year yield sits at 90% of its 1-year range, the highest position among the six series, while the US 30-year is at 67%, the lowest. Across 2-, 10- and 30-year maturities, the daily change was negative in both countries. As before, the position figure uses 0% for the 1-year low and 100% for the 1-year high, and 1bp equals 0.01 percentage point.
補足:10年債の日米差と長短の差
Side Notes: US-Japan Gap and Yield Curve Spreads
These are supporting figures. The 10-year yield levels in each country remain the lead story; the items below are shown briefly for reference.
10-year gap (US minus Japan)
The source defines this gap using only days on which both US and Japanese values are available.
| Date | Gap |
|---|---|
| 2026-10-29 | 210.4bp |
| Prior (2026-10-28) | 218.3bp (-7.9bp) |
| One month earlier | 217.8bp |
Yield curve spread (10-year minus 2-year)
| Country | Date | Spread | Prior |
|---|---|---|---|
| US | 2026-10-29 | 37.0bp | 38.0bp |
| Japan | 2026-10-30 | 94.2bp | 97.5bp |
A note on dates
- The US figures are for Oct 29, 2026; the US value for Oct 30 is blank in the source daily table.
- The Japanese figures are for Oct 30, 2026, with Oct 29 as the prior business day.
- The 10-year gap is dated Oct 29, the latest day with both values (US 4.980%, Japan 2.876%).
All three measures came in below their prior-day readings: the gap moved from 218.3bp to 210.4bp, the US spread from 38.0bp to 37.0bp, and the Japanese spread from 97.5bp to 94.2bp. Note that bp stands for basis point, or 0.01 percentage point.
Disclaimer: This article is for informational purposes only. All investment decisions are made solely at your own risk.