This article was automatically generated by the NFC Market Live AI analysis system. (Updated: 2026-10-30 05:22 JST)
📊 Amazon’s Q3 2026 results, explained.
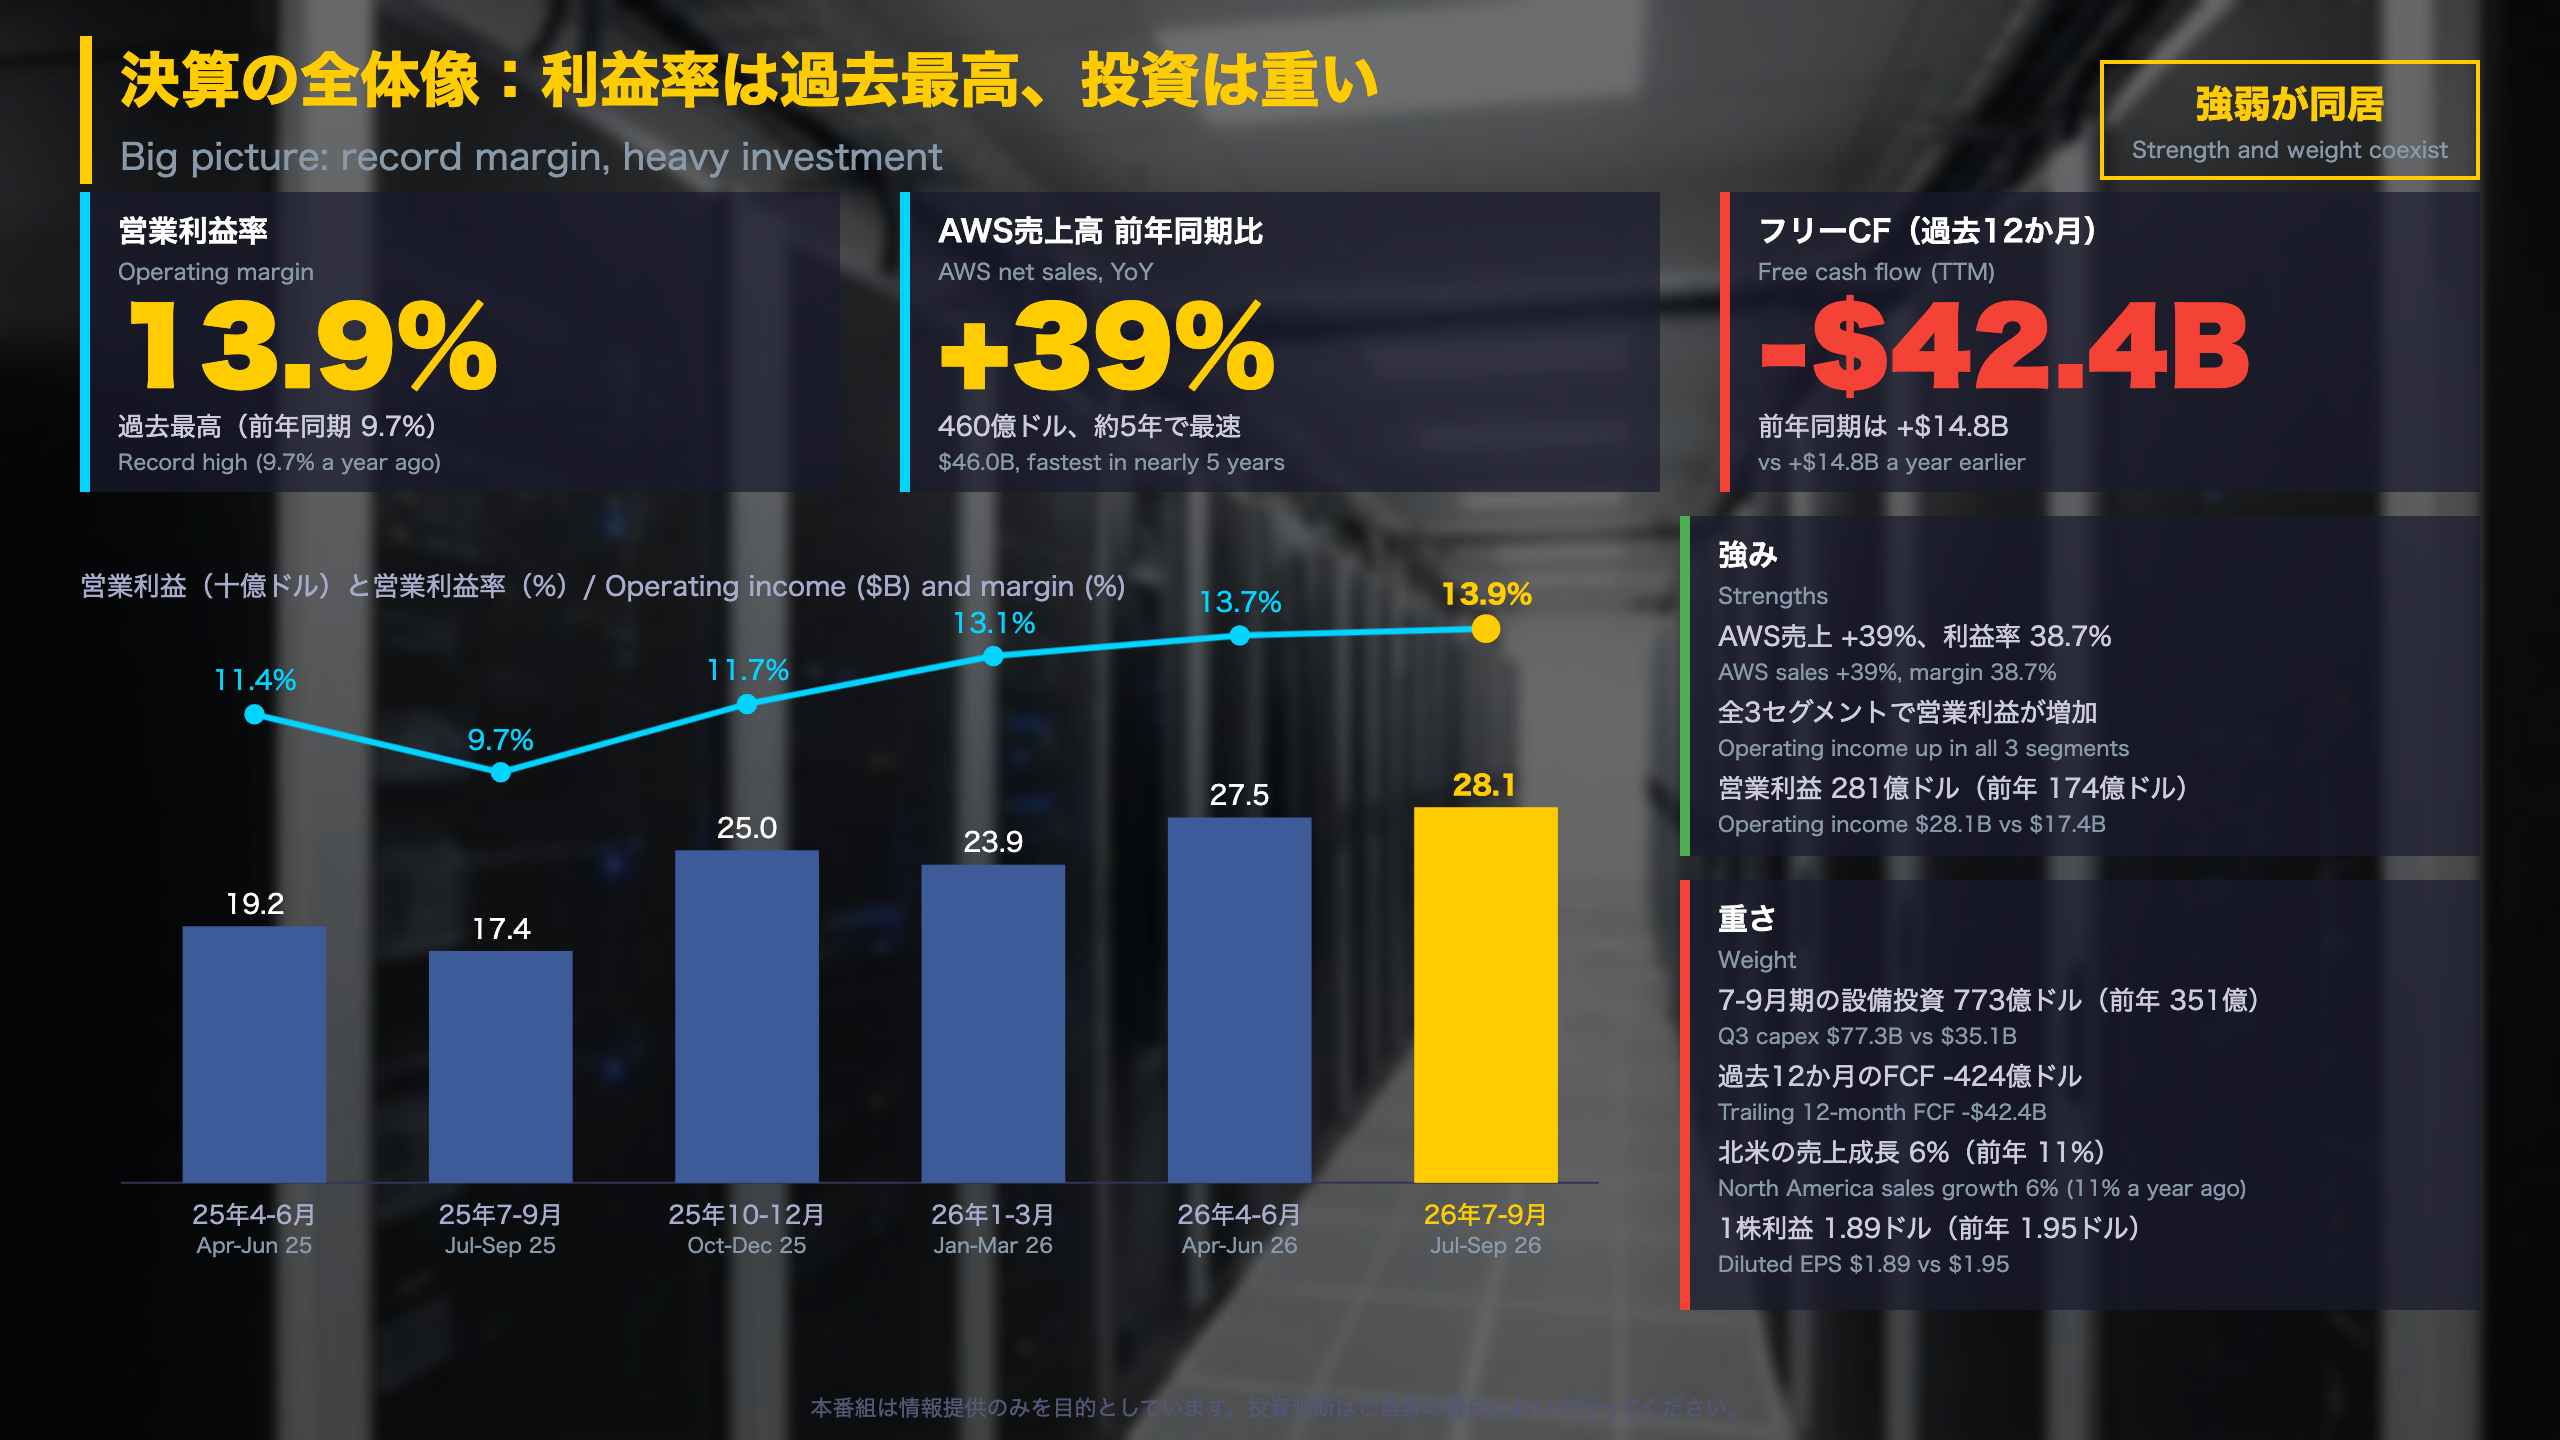
📈 Operating income was $28.1B and operating margin hit a record 13.9%. AWS sales grew 39% year over year, its fastest pace in nearly five years.
⚠️ Net income was $20.7B versus $21.2B, mainly because Q3 2025 included a $9.5B pre-tax gain on Anthropic investments. Trailing-twelve-month free cash flow was an outflow of $42.4B as AI capex surged.
💡 Q4 guidance: net sales of $240.0-247.0B and operating income of $28.5-33.5B.
サマリー:利益率は過去最高、投資は重く
Amazon Q3 2026: Reading the Headline Numbers
Source: Amazon’s earnings release (Exhibit 99.1 to a Form 8-K filed with the US SEC) dated October 29, 2026, for the quarter ended September 30.
Why the margin matters
Amazon reports three segments: North America and International (retail, advertising, subscriptions and third-party seller services) and AWS, its cloud arm. Consolidated operating margin was 13.9%, versus 9.7% a year earlier and 13.7% in the prior quarter. AWS earned a 38.7% segment margin, against 7.7% in North America and 3.7% in International. AWS now accounts for 23% of net sales, up from 18%, so the mix shift is a structural driver of the group margin.
Reading net income
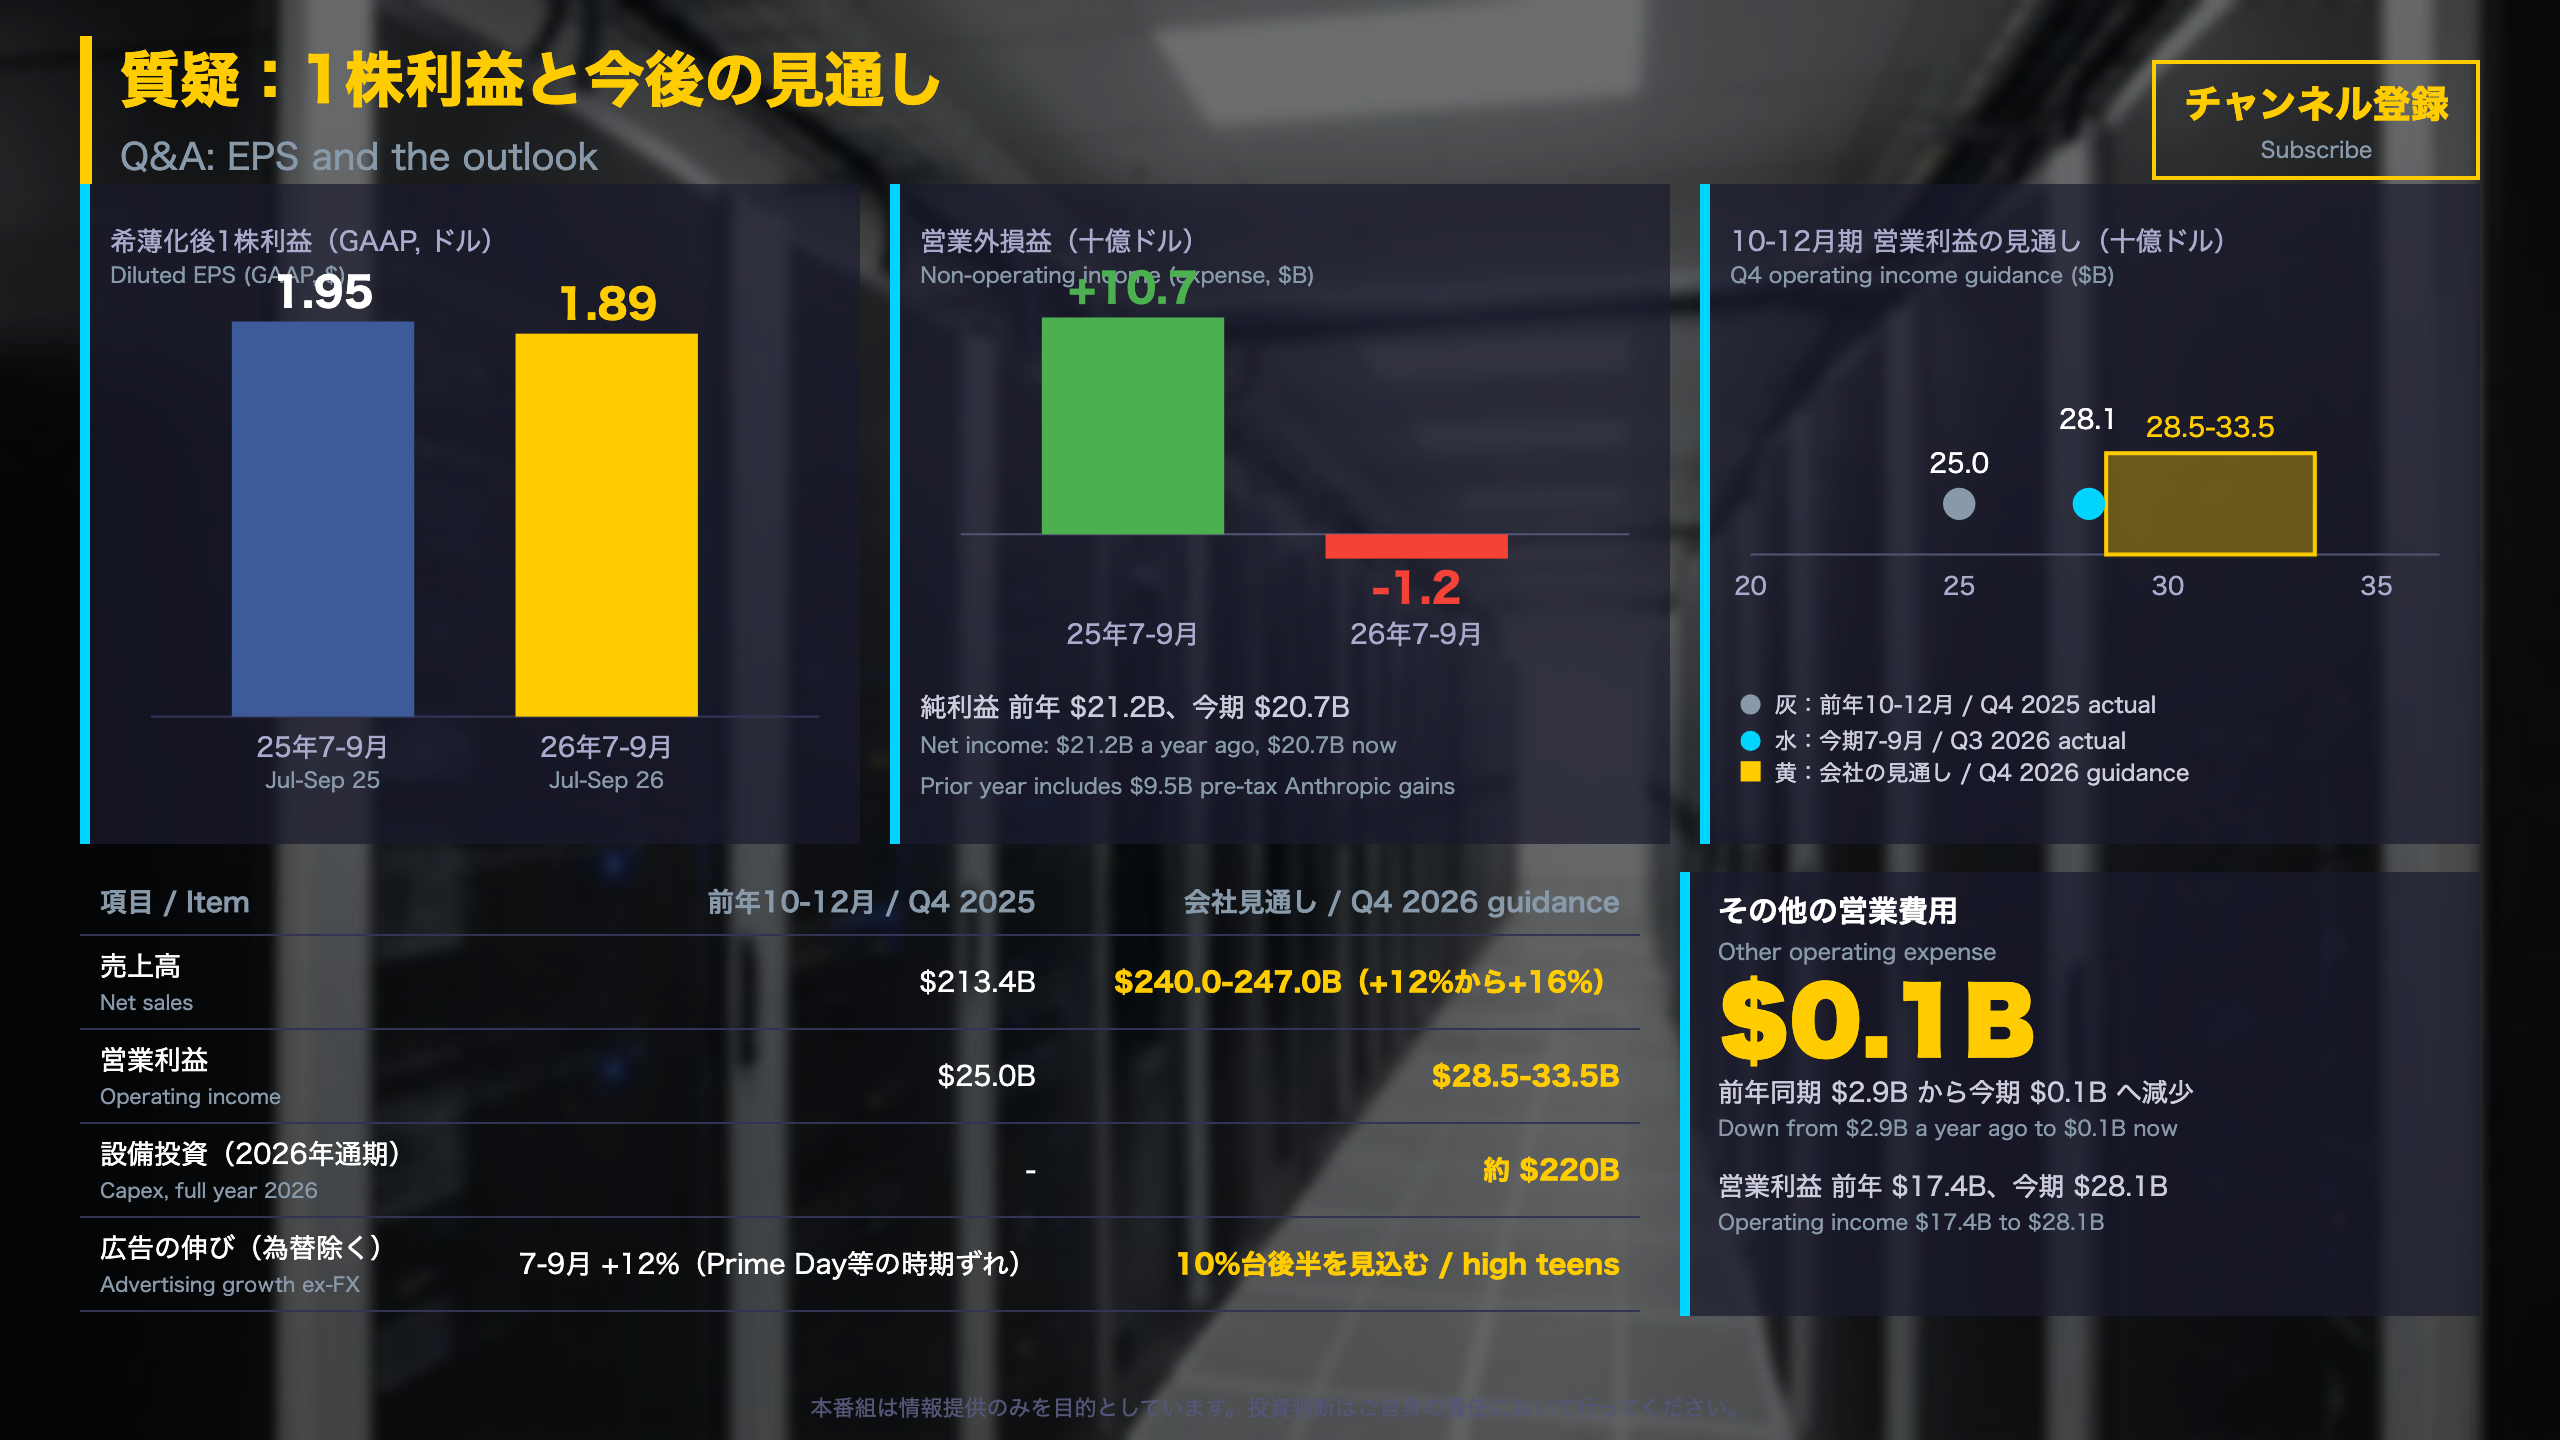
Net income was $20.7B (diluted EPS $1.89) versus $21.2B ($1.95). Amazon says the decline is driven primarily by $9.5B of pre-tax gains in Q3 2025 from its Anthropic investments. Operating income itself rose from $17.4B to $28.1B. This release gives no adjusted EPS, so only GAAP figures are used.
Calendar effects
Prime Day moved into Q2 this year for most large countries. Amazon says that excluding the shift, Q3 growth would have been about 400 basis points higher, so the reported 12% (13% ex-FX) likely understates underlying retail momentum on the company’s own account.
How we compare
This program benchmarks only against prior periods and company guidance, not analyst consensus. Q4 guidance calls for net sales of $240.0-247.0B and operating income of $28.5-33.5B, versus $25.0B a year earlier.
深掘り1:AWSの加速と高い収益性
AWS: Acceleration Backed by AI Demand
What AWS is: Amazon Web Services is Amazon’s cloud infrastructure arm, comparable in role to Microsoft Azure and Google Cloud. It is the profit engine of the group: in Q3 it produced $17.8B of the company’s $28.1B operating income.
The numbers
| Q3 2025 | Q2 2026 | Q3 2026 | |
|---|---|---|---|
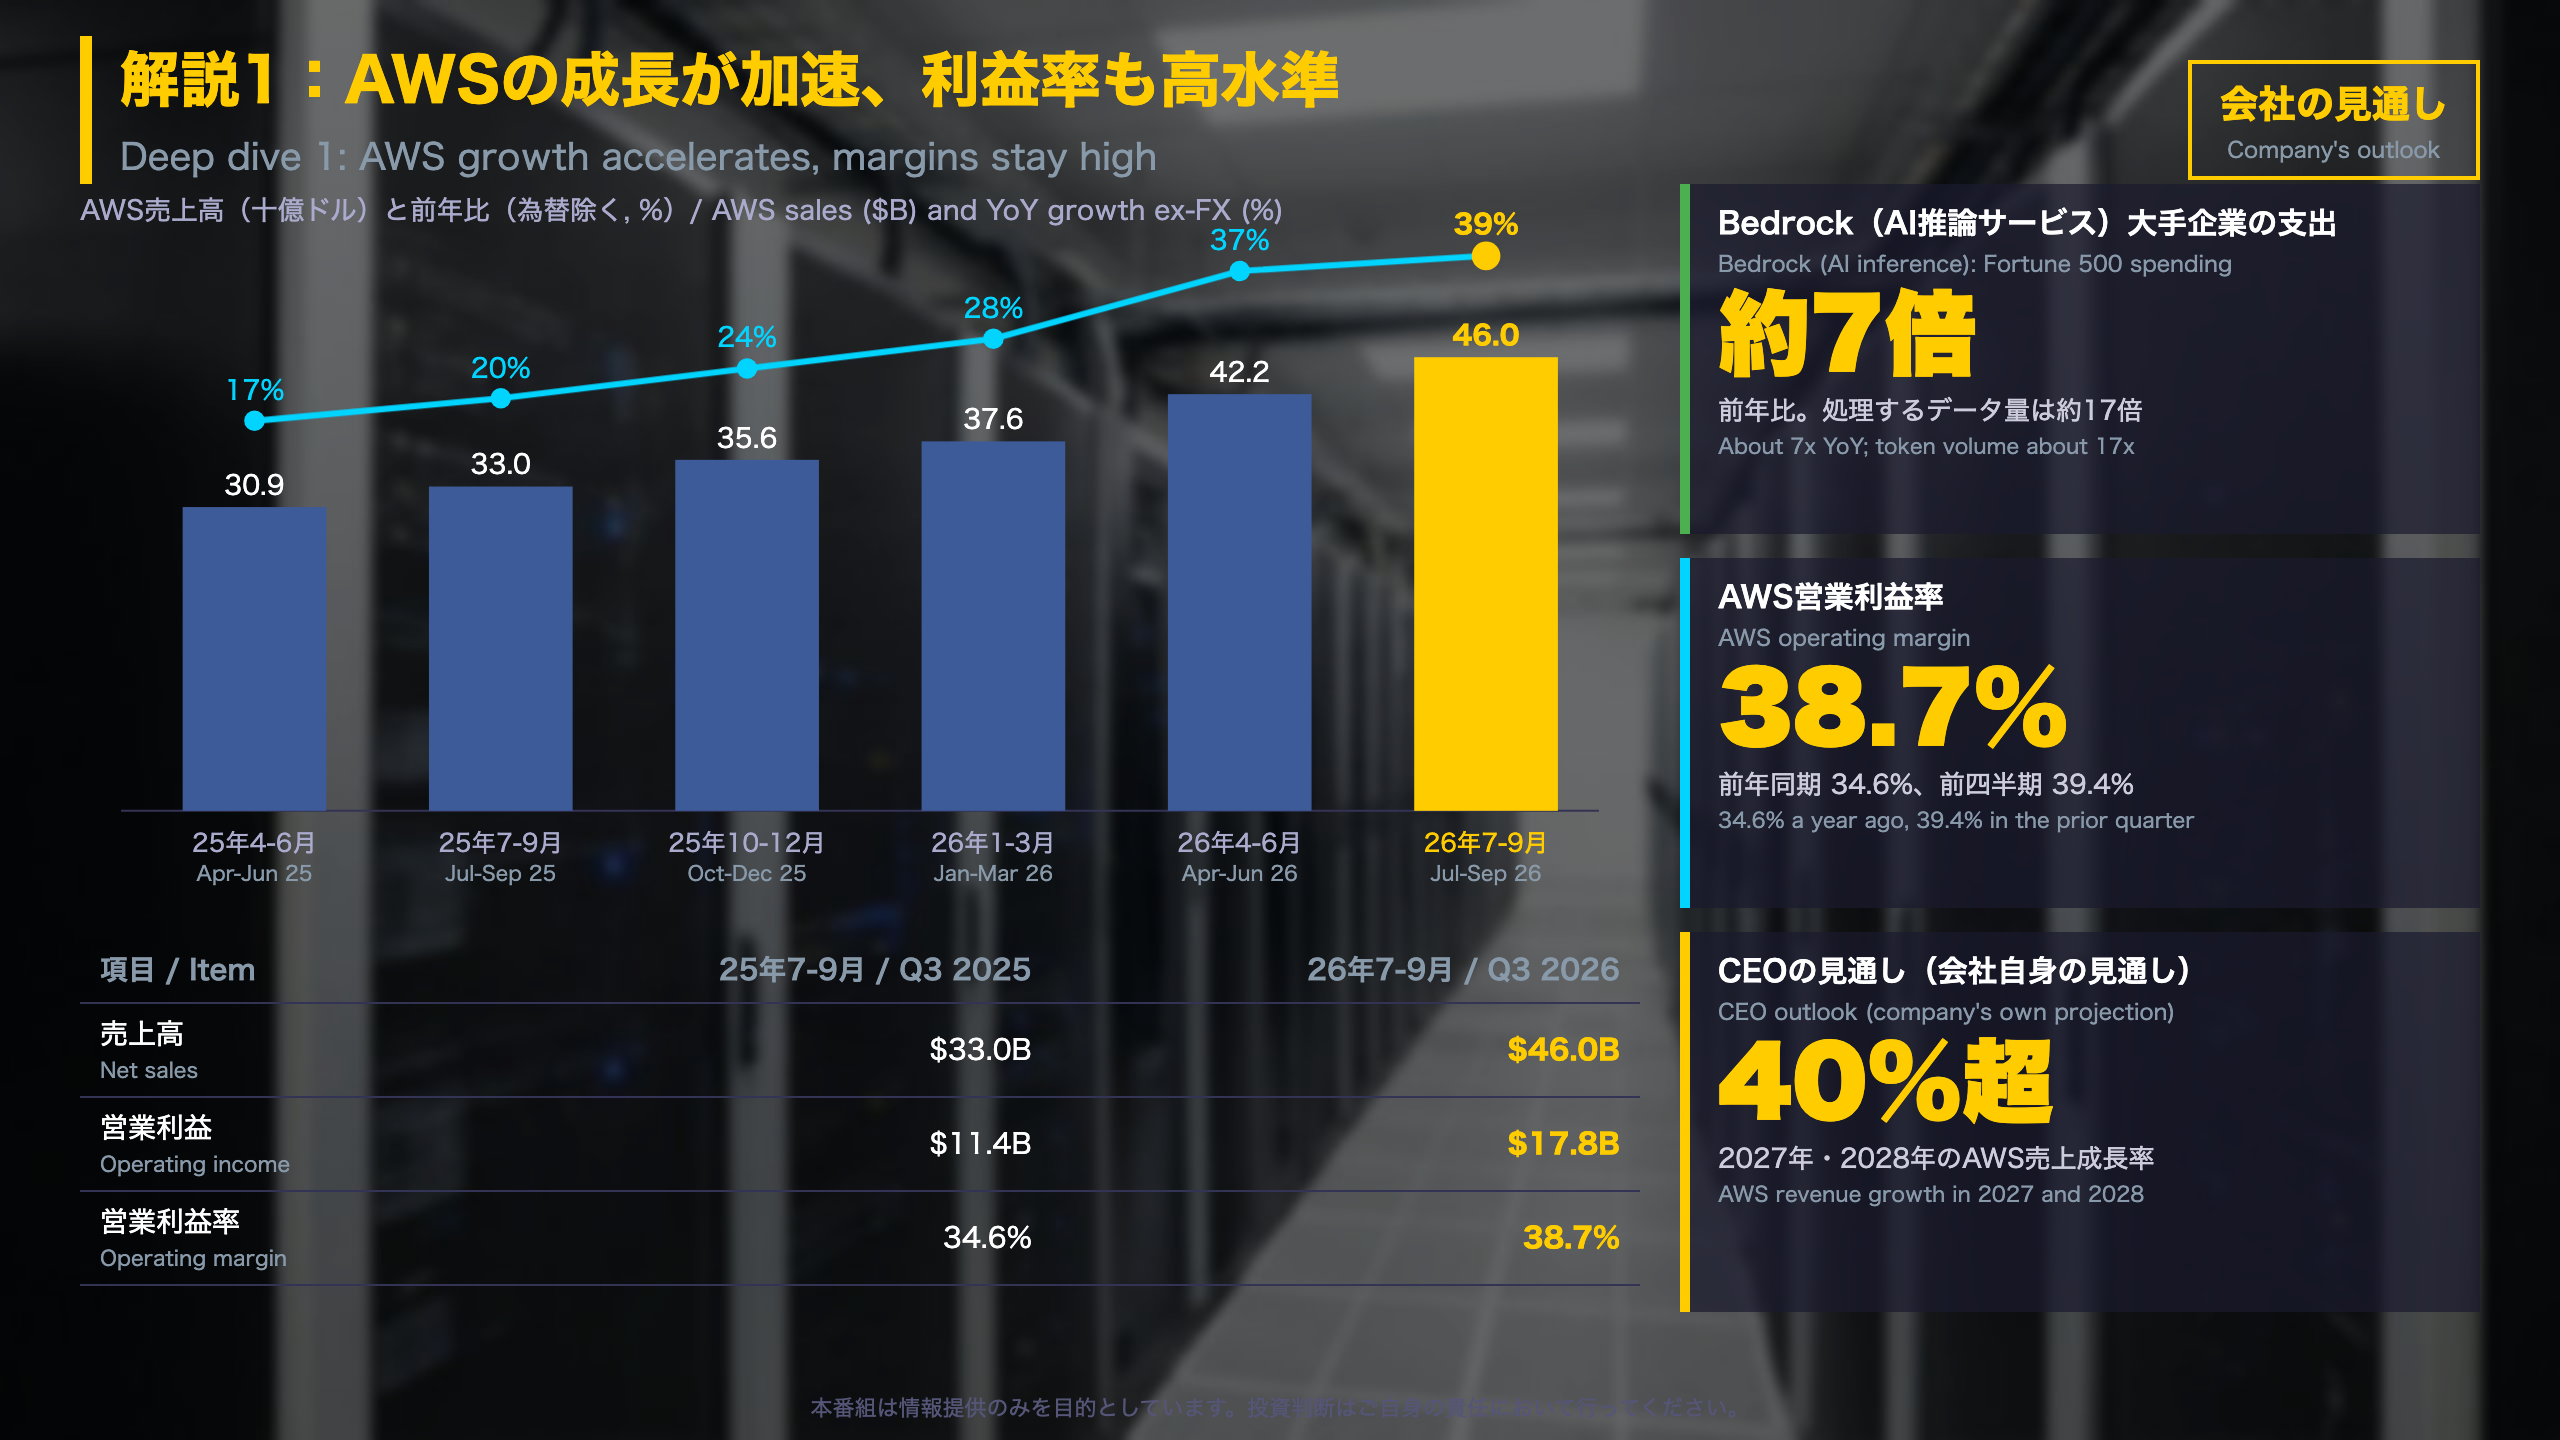
| Sales | $33.0B | $42.2B | $46.0B |
| Growth (ex-FX) | 20% | 37% | 39% |
| Operating margin | 34.6% | 39.4% | 38.7% |
Growth has risen for five straight quarters. Amazon cites a $184B annualized revenue run rate.
Demand signals disclosed by Amazon
- Bedrock (managed access to AI models): Fortune 500 spending up nearly 7x and token volume up nearly 17x year over year.
- AgentCore: customers deployed 2x more agents in Q3 than in the prior three quarters combined.
- Lambda topped a $1B annualized run rate.
Two readings
The constructive view is that capacity investment is converting into revenue, with margins near 39%. The cautious view is that margin slipped 0.7 points sequentially while 2026 cash capex is guided to about $220B, so rising depreciation could weigh on future margins. The CEO’s expectation of growth above 40% in 2027 and 2028 is guidance-style commentary, not reported data.
What to watch
Whether growth stays near or above 39% and whether the segment margin holds in the high 30s.
深掘り2:営業利益は増加、フリーキャッシュフローは流出
Profit vs. Cash: Reading the Income Statement and Balance Sheet
Where costs moved (Q3, $B)
| Line | Q3 2025 | Q3 2026 |
|---|---|---|
| Cost of sales | 88.7 | 94.6 |
| Fulfillment | 27.7 | 30.0 |
| Technology and infrastructure | 29.0 | 34.8 |
| Sales and marketing | 11.7 | 11.6 |
Technology and infrastructure, which includes data center costs and depreciation, rose about 20%.
Why net income fell
Total non-operating income swung from +$10.7B to -$1.2B. Q3 2025 included pre-tax gains of $9.5B on Anthropic investments, while interest expense rose from $0.5B to $1.7B. Operating income, the cleaner read on the core business, rose 61%.
Free cash flow explained
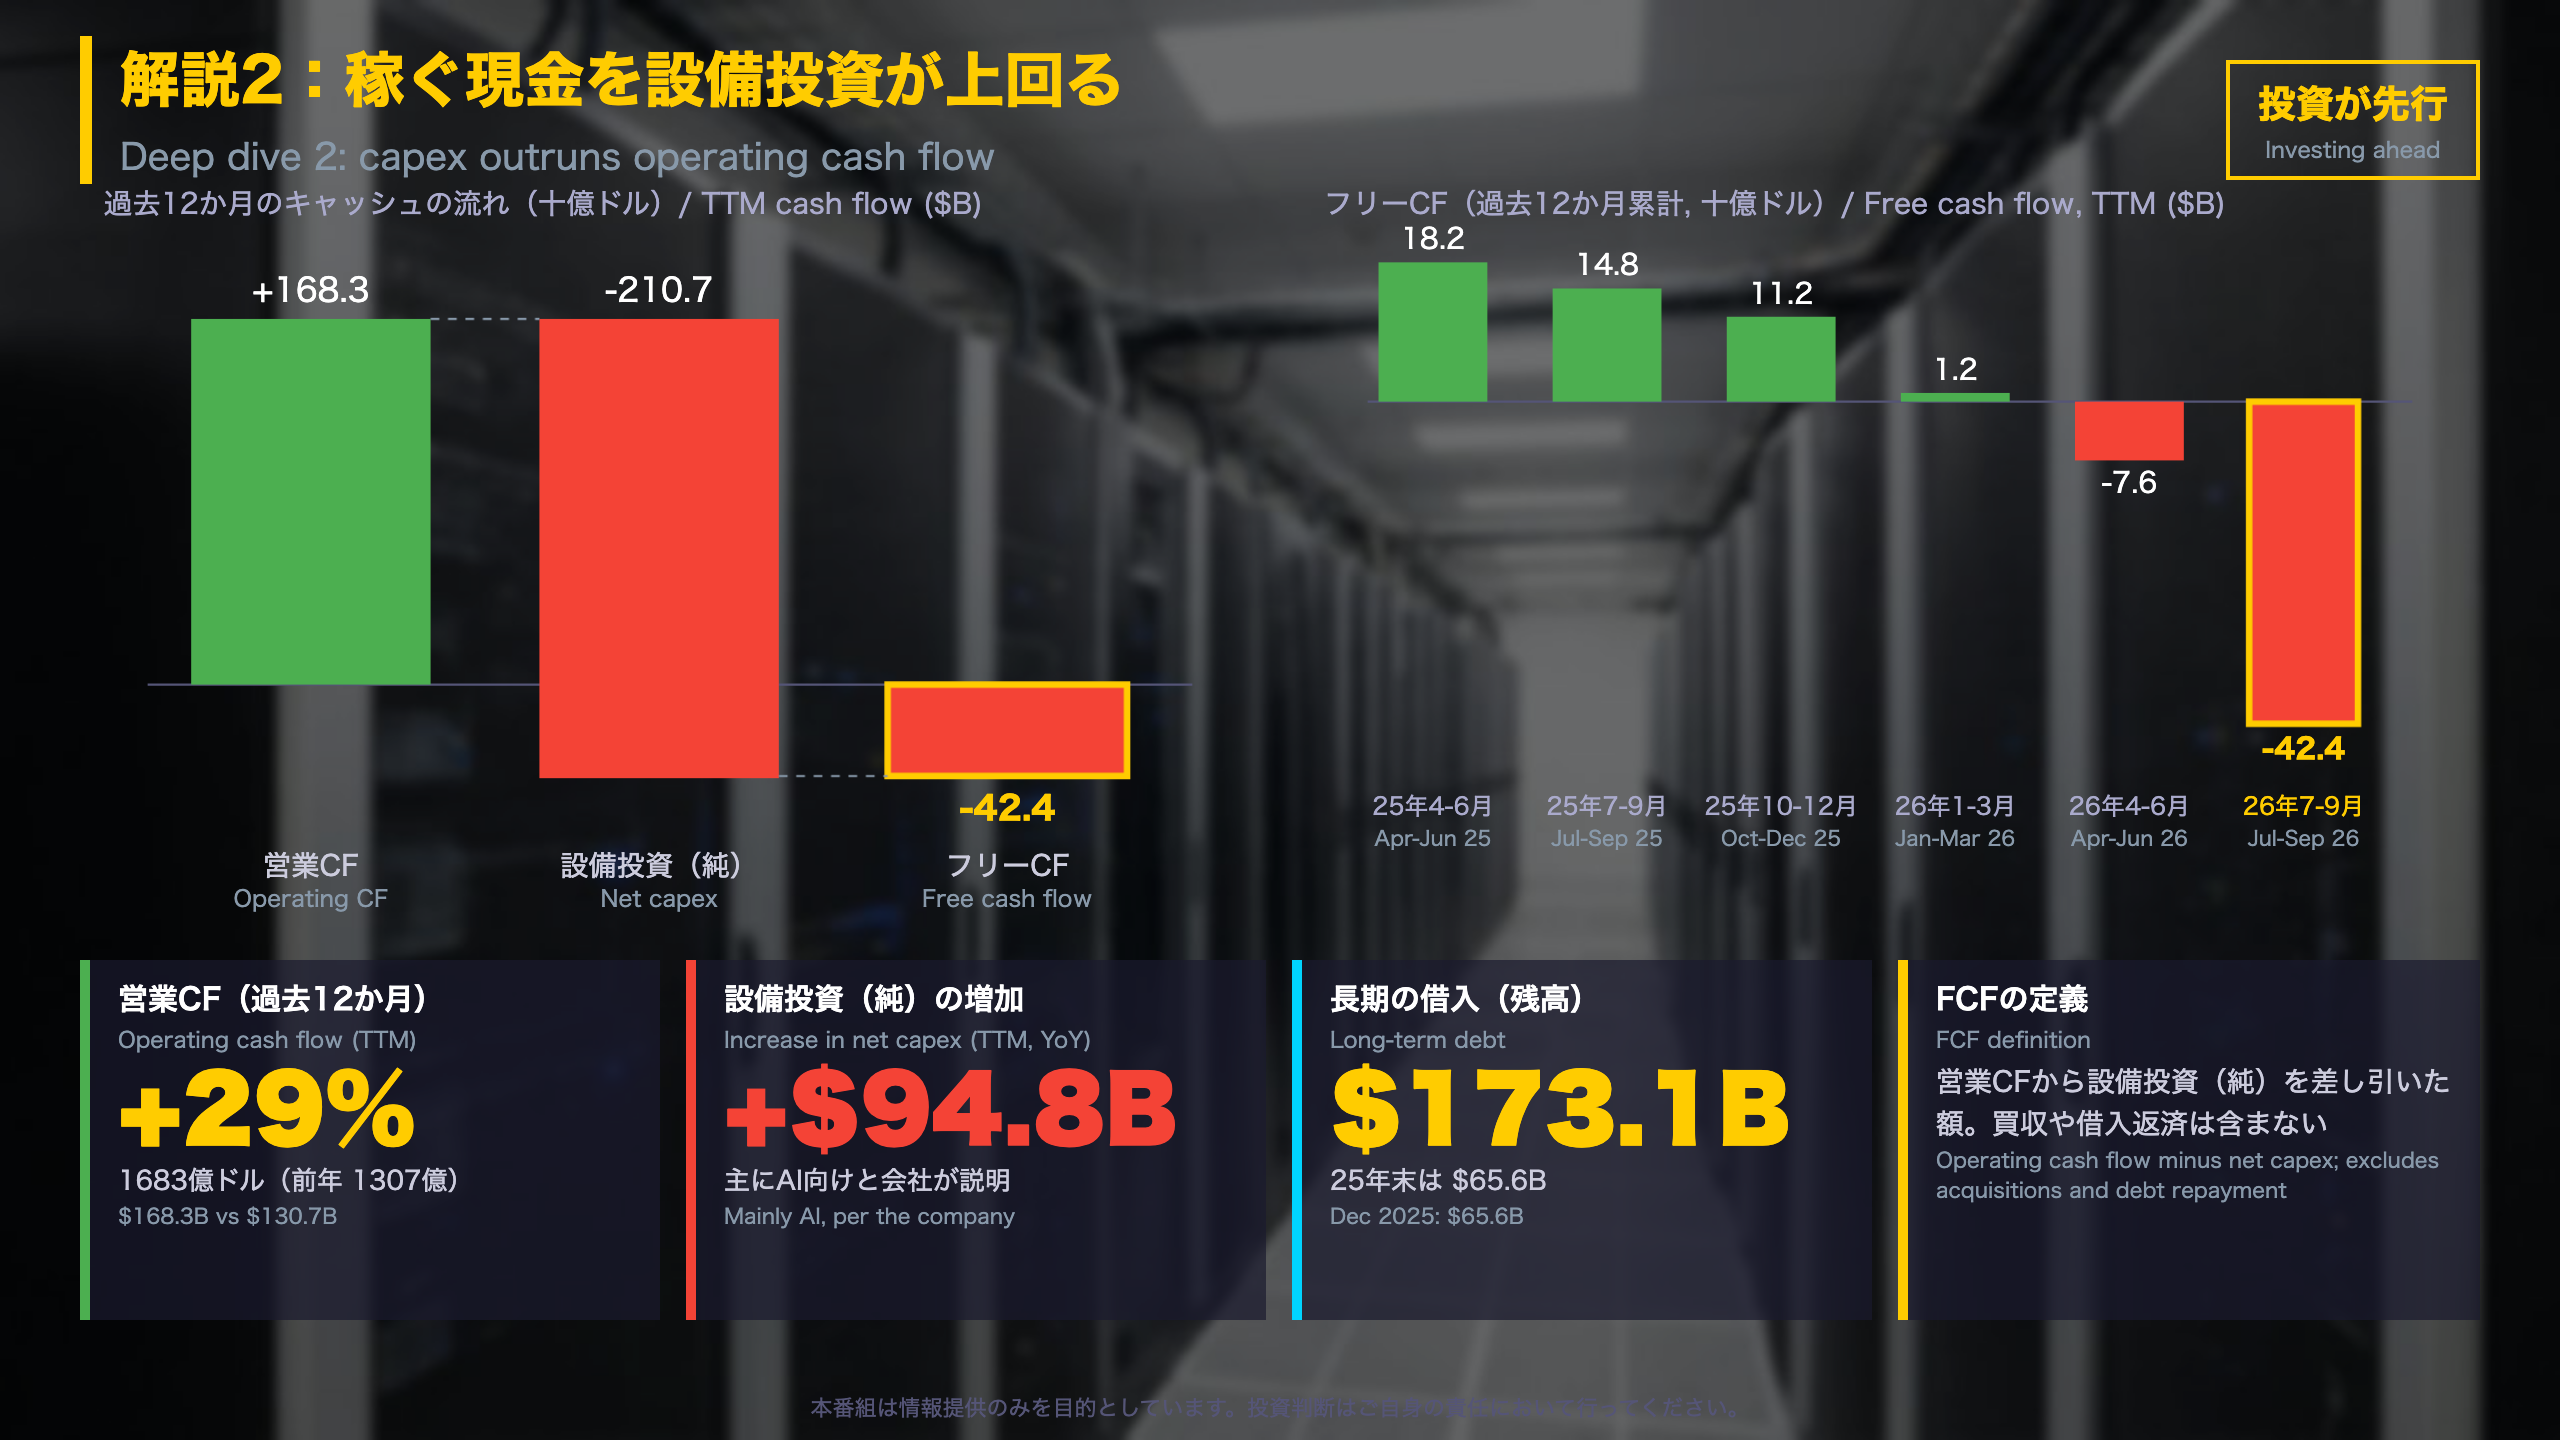
Amazon defines free cash flow as operating cash flow minus purchases of property and equipment, net of proceeds and incentives. On a trailing-twelve-month basis: operating cash flow $168.3B (+29%), net capex $210.7B (+82%), giving an outflow of $42.4B versus an inflow of $14.8B a year earlier. Exhibit 99.2 notes the metric omits items such as debt repayments and acquisitions.
Funding
Amazon raised $48.1B of long-term debt in Q3; long-term debt stood at $173.1B versus $65.6B at end-2025. Property and equipment net reached $508.9B from $357.0B.
Reading it both ways
Strong operating cash generation and record segment profits support the investment case. The counterweight is that capex is now well above operating cash flow, with about $220B guided for 2026, and is partly debt-funded.
質疑:減価償却と第4四半期の見通しをどう読むか
Guidance, Advertising Timing and Retail Details
Q4 2026 guidance (company outlook)
- Net sales: $240.0-247.0B, or 12%-16% growth, with an unfavorable FX effect of about 60 basis points.
- Operating income: $28.5-33.5B versus $25.0B in Q4 2025.
- Cash capex: still about $220B for 2026.
- No EPS guidance appears in the release.
Why the quarterly comparison is noisy
Prime Day (Amazon’s mid-year sales event, similar in role to a mini holiday season) fell in Q2 this year but in Q3 last year. Amazon says Q3 growth would have been roughly 400 basis points higher without the shift. Advertising grew 12% ex-FX in Q3 after 26% in Q2, and the company attributes this to timing anomalies, guiding to high-teens growth in Q4.
Retail and subscriptions, Q3
| Line | Sales | Growth |
|---|---|---|
| Online stores | $68.5B | +2% |
| Third-party seller services | $46.5B | +9% |
| Subscription services | $14.0B | +11% |
| Advertising | $19.6B | +11% |
Paid units grew 12% versus 17% in Q2; headcount was 1.638 million (+4%), and Amazon plans to hire over 300,000 seasonal and other workers in the US this holiday season.
Reading it both ways
The operating income guide sits above last year’s level and the revenue range implies growth at or above this quarter’s rate. The caution is that capex of roughly $220B and rising depreciation will compete with segment profit growth. Amazon is a US company; its filings are in US dollars. This program compares with prior periods and company guidance only.
What to watch
Whether Q4 results land inside the guided ranges and whether advertising returns to high-teens growth. The next earnings date is not given in the source.
Disclaimer: This article is for informational purposes only. All investment decisions are made solely at your own risk.