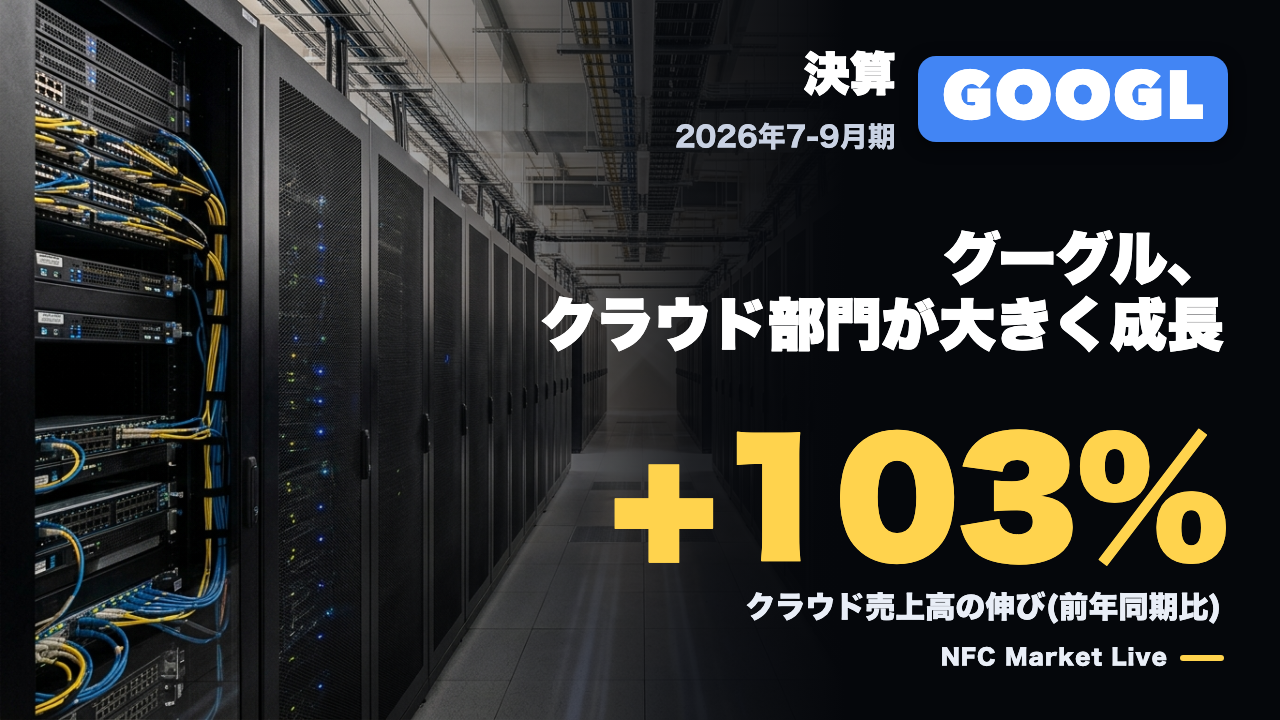
📺 Watch the Full Video Analysis
This article was automatically generated by the NFC Market Live AI analysis system. (Updated: 2026-10-29 05:17 JST)
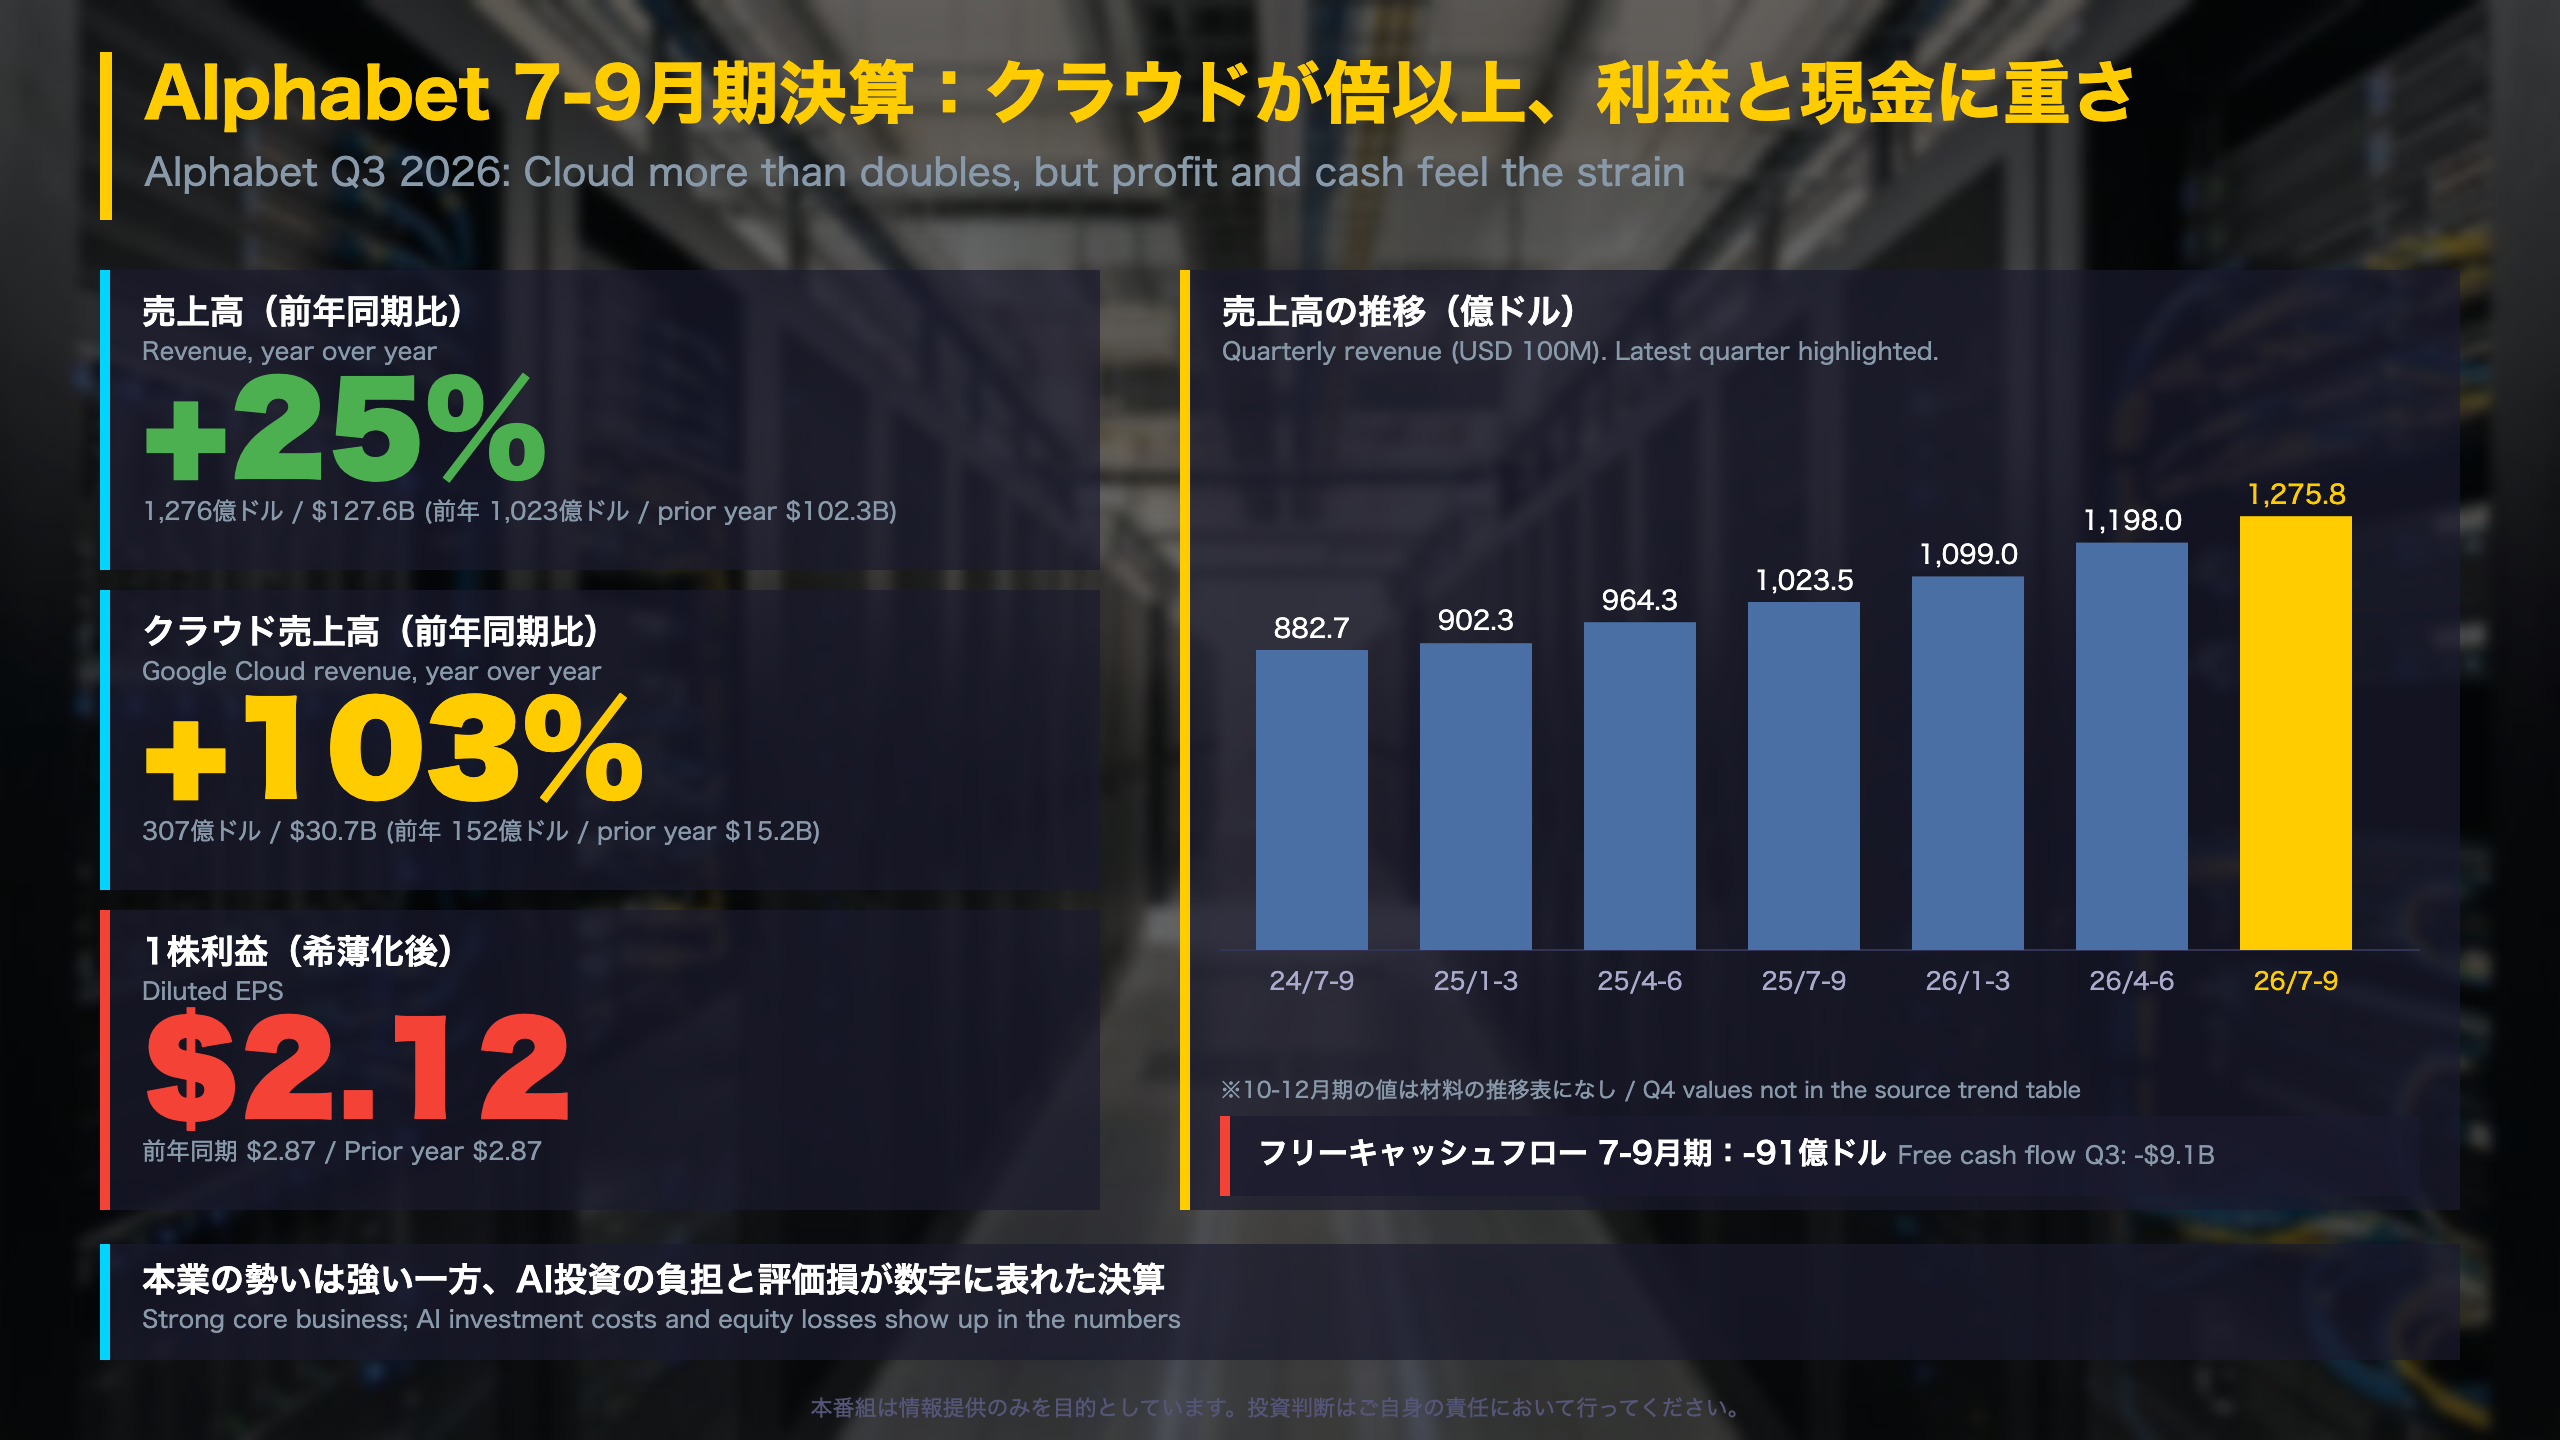
📊 Alphabet (GOOGL) reported Q3 2026 results on October 28. Revenue rose 25% to $127.6B, Google Cloud revenue jumped 103% to $30.7B, and operating income grew 30% to $40.6B.
📉 Diluted EPS was $2.12, below $2.87 a year earlier. The company said an $8.7B loss on equity securities reduced EPS by $0.55.
💡 Capex reached $51.4B, more than double the year-earlier level, free cash flow was negative $9.1B, and long-term debt rose from year-end.
⚠️ A balanced look at core momentum versus the cost of AI investment.
決算サマリー:クラウドが倍以上、利益と現金に重さ
Alphabet Q3 2026: the big picture
What was reported. Alphabet, the parent of Google, filed its third-quarter results as an SEC Form 8-K (Exhibit 99.1) on October 28, 2026. Revenue was $127.6B, up 25% year over year and about 6% from the prior quarter. The company called this its 13th consecutive quarter of double-digit growth.
Why the geography matters
Constant-currency growth was +39% in the United States, +10% in EMEA, +15% in APAC and +15% in Other Americas. U.S. revenue reached $67.7B, so domestic demand carried most of the acceleration.
GAAP versus the headline
These figures are GAAP, not adjusted. Net income available to common stockholders was $26.2B (EPS $2.12) versus $35.0B (EPS $2.87). The drop sits below the operating line, in other income and expense, not in operations: operating income rose 30% to $40.6B.
Context for non-Japanese readers
Unlike Japan’s quarterly corporate disclosures, U.S. companies publish an earnings release plus a Form 10-Q, which follows shortly with fuller detail. The next step to watch is that 10-Q; the release does not state the next earnings date.
Market relevance
The release shows a company growing quickly while spending heavily, a pattern common among large technology firms building AI infrastructure. Readers should weigh both the growth rate and the cash intensity of that growth.
成長の中心はクラウド:売上は倍以上、営業利益も増加
Cloud and advertising: what is inside the numbers
Google Cloud in plain terms
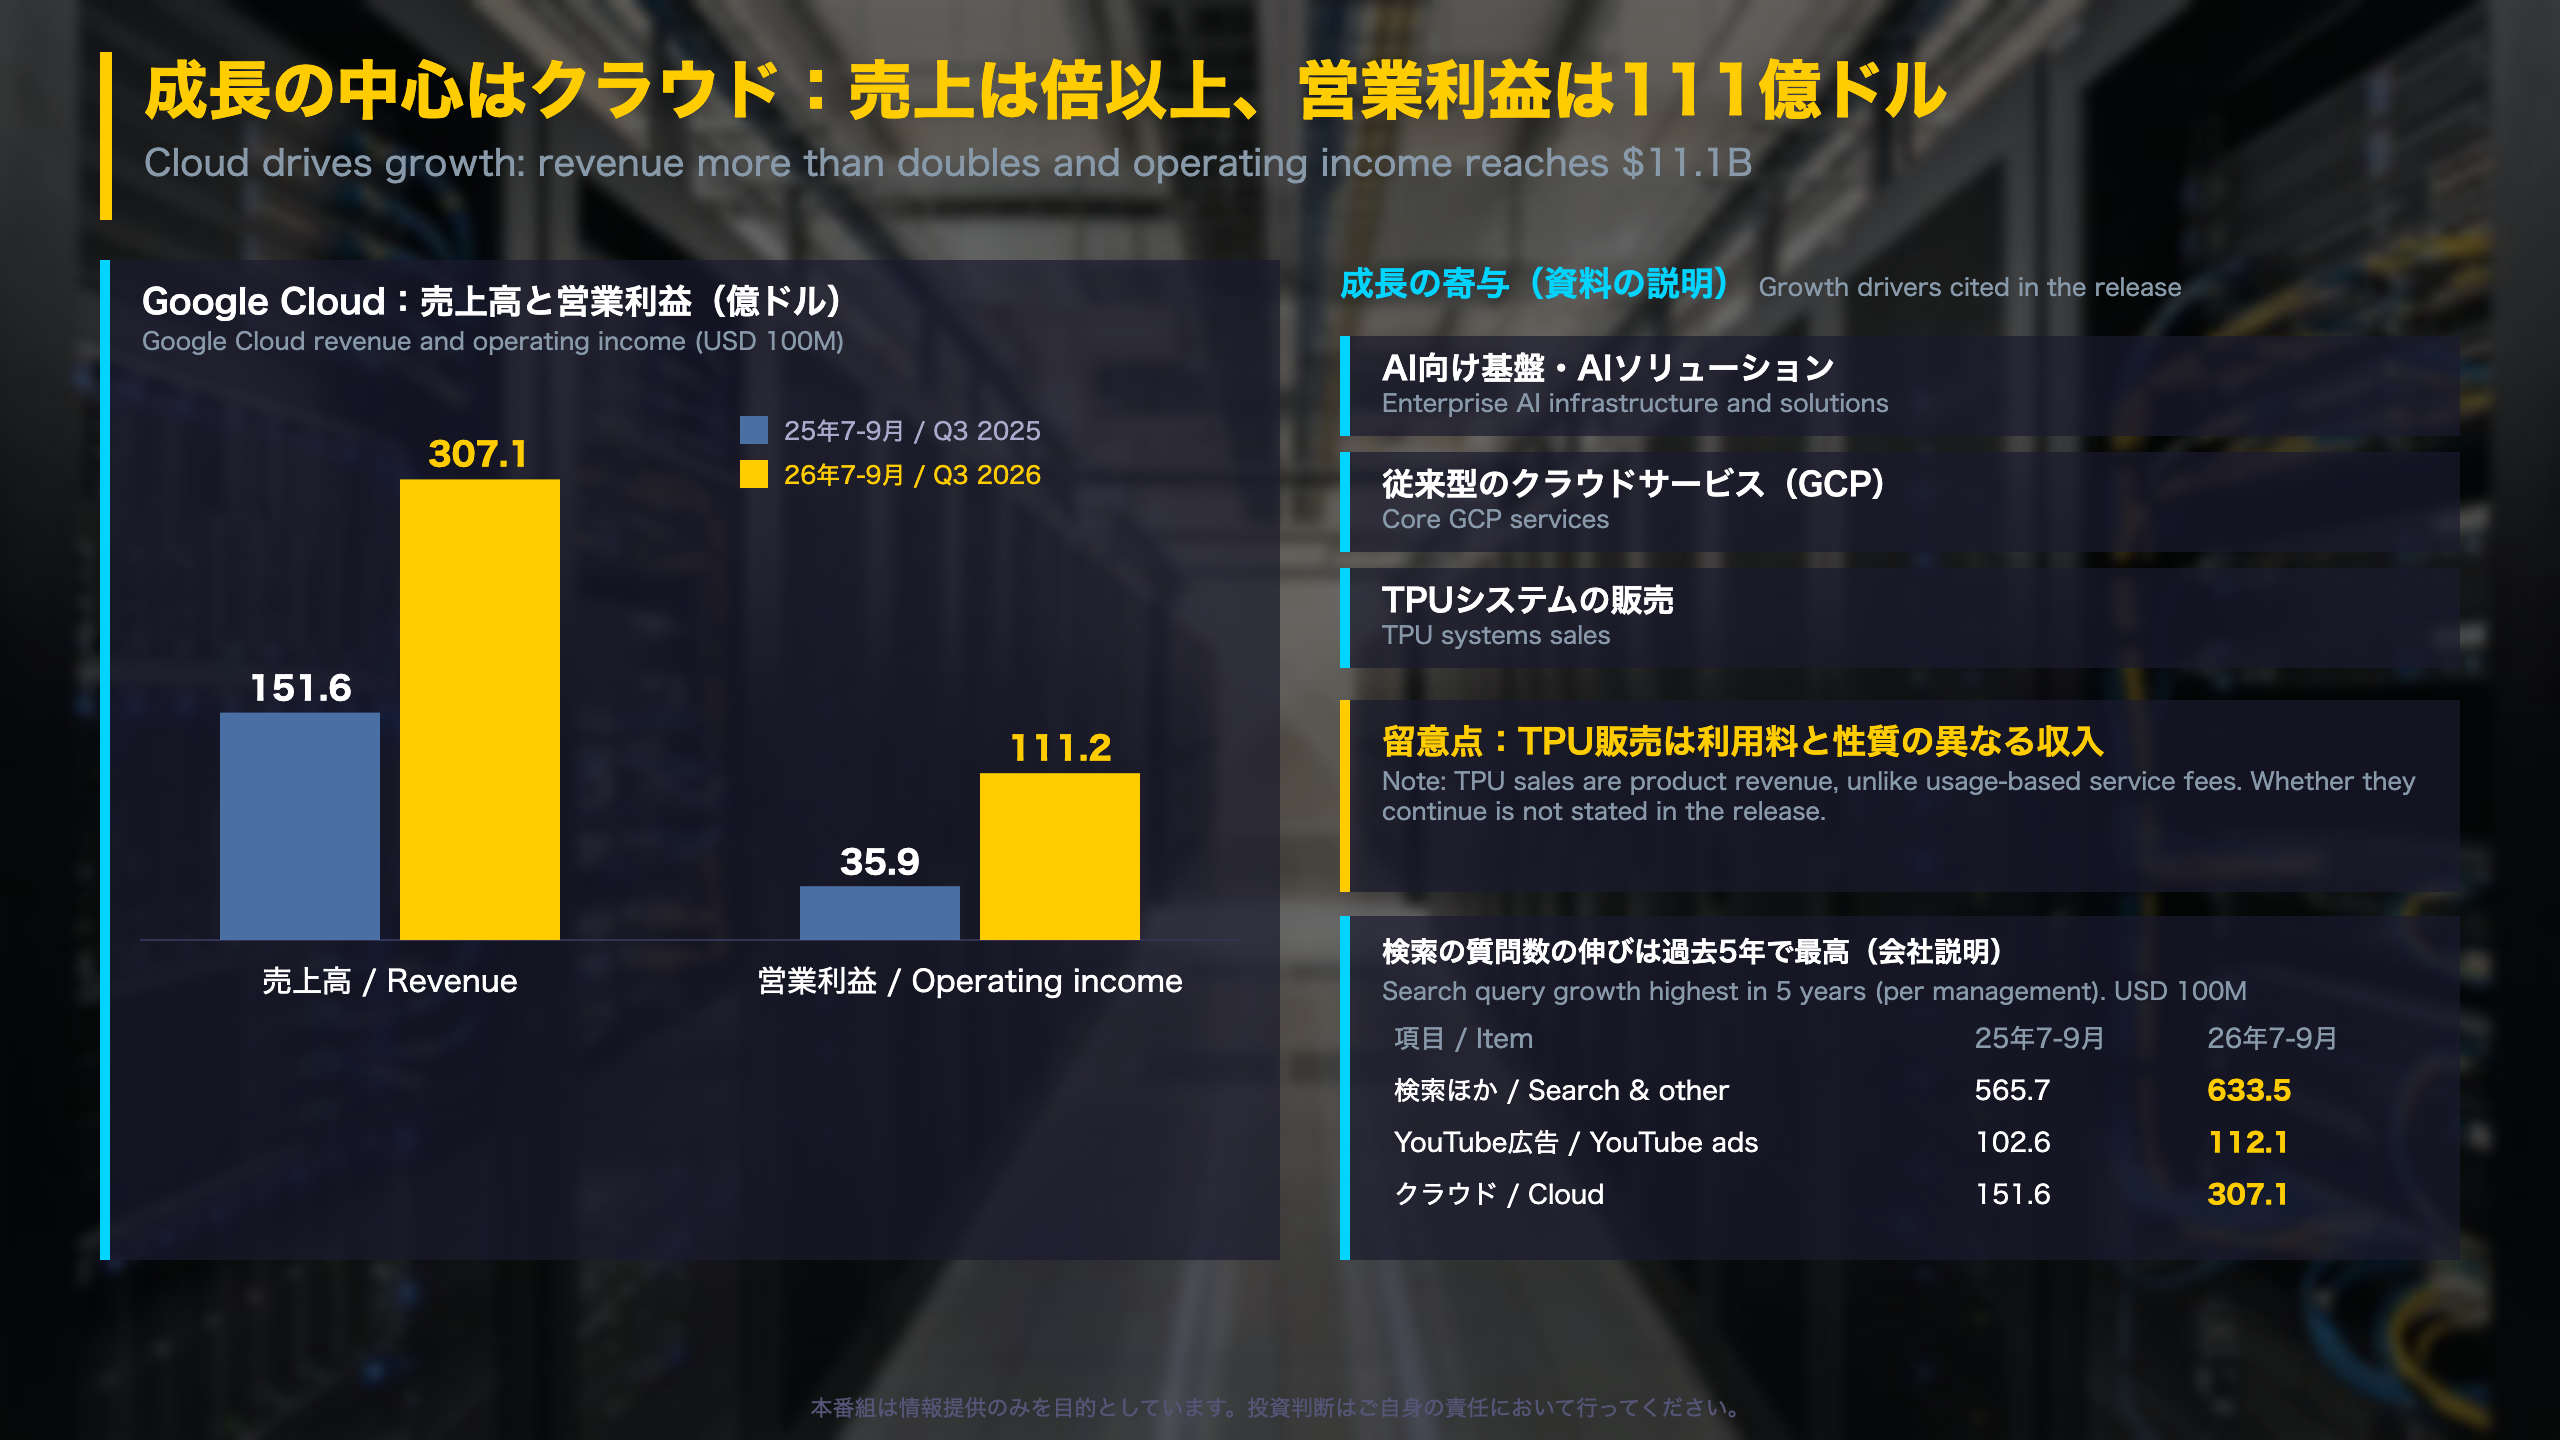
Google Cloud sells infrastructure and platform services, applications and workplace tools to enterprises. The release says services revenue comes mainly from consumption-based fees and subscriptions, while product revenue comes mainly from sales of TPU systems. TPUs are Google’s in-house AI chips. Segment revenue was $30.7B versus $15.2B, and operating income was $11.1B versus $3.6B.
Google Services remains the larger business
Services revenue rose to $96.3B from $87.1B, and operating income to $39.2B from $33.5B. Search & other was $63.4B (up from $56.6B), YouTube ads $11.2B, Google Network $7.5B and subscriptions, platforms and devices $14.3B.
Costs sit above the segments
Alphabet-level activities, mainly shared AI research and development, produced an operating loss of $7.7B versus $4.5B. R&D expense was $20.6B versus $15.2B.
Management’s framing
“Our first-party model APIs are now processing nearly 32 billion tokens per minute.”
International comparison and caveats
Like other large U.S. cloud providers, Alphabet reports cloud growth that mixes recurring service fees with other revenue types. Here, TPU system sales are a distinct component, and the release does not say how persistent that line is. Investors will want the Form 10-Q for more segment detail.
利益と現金の重さ:評価損と設備投資
Profit and cash in detail
Why net income fell while operating income rose
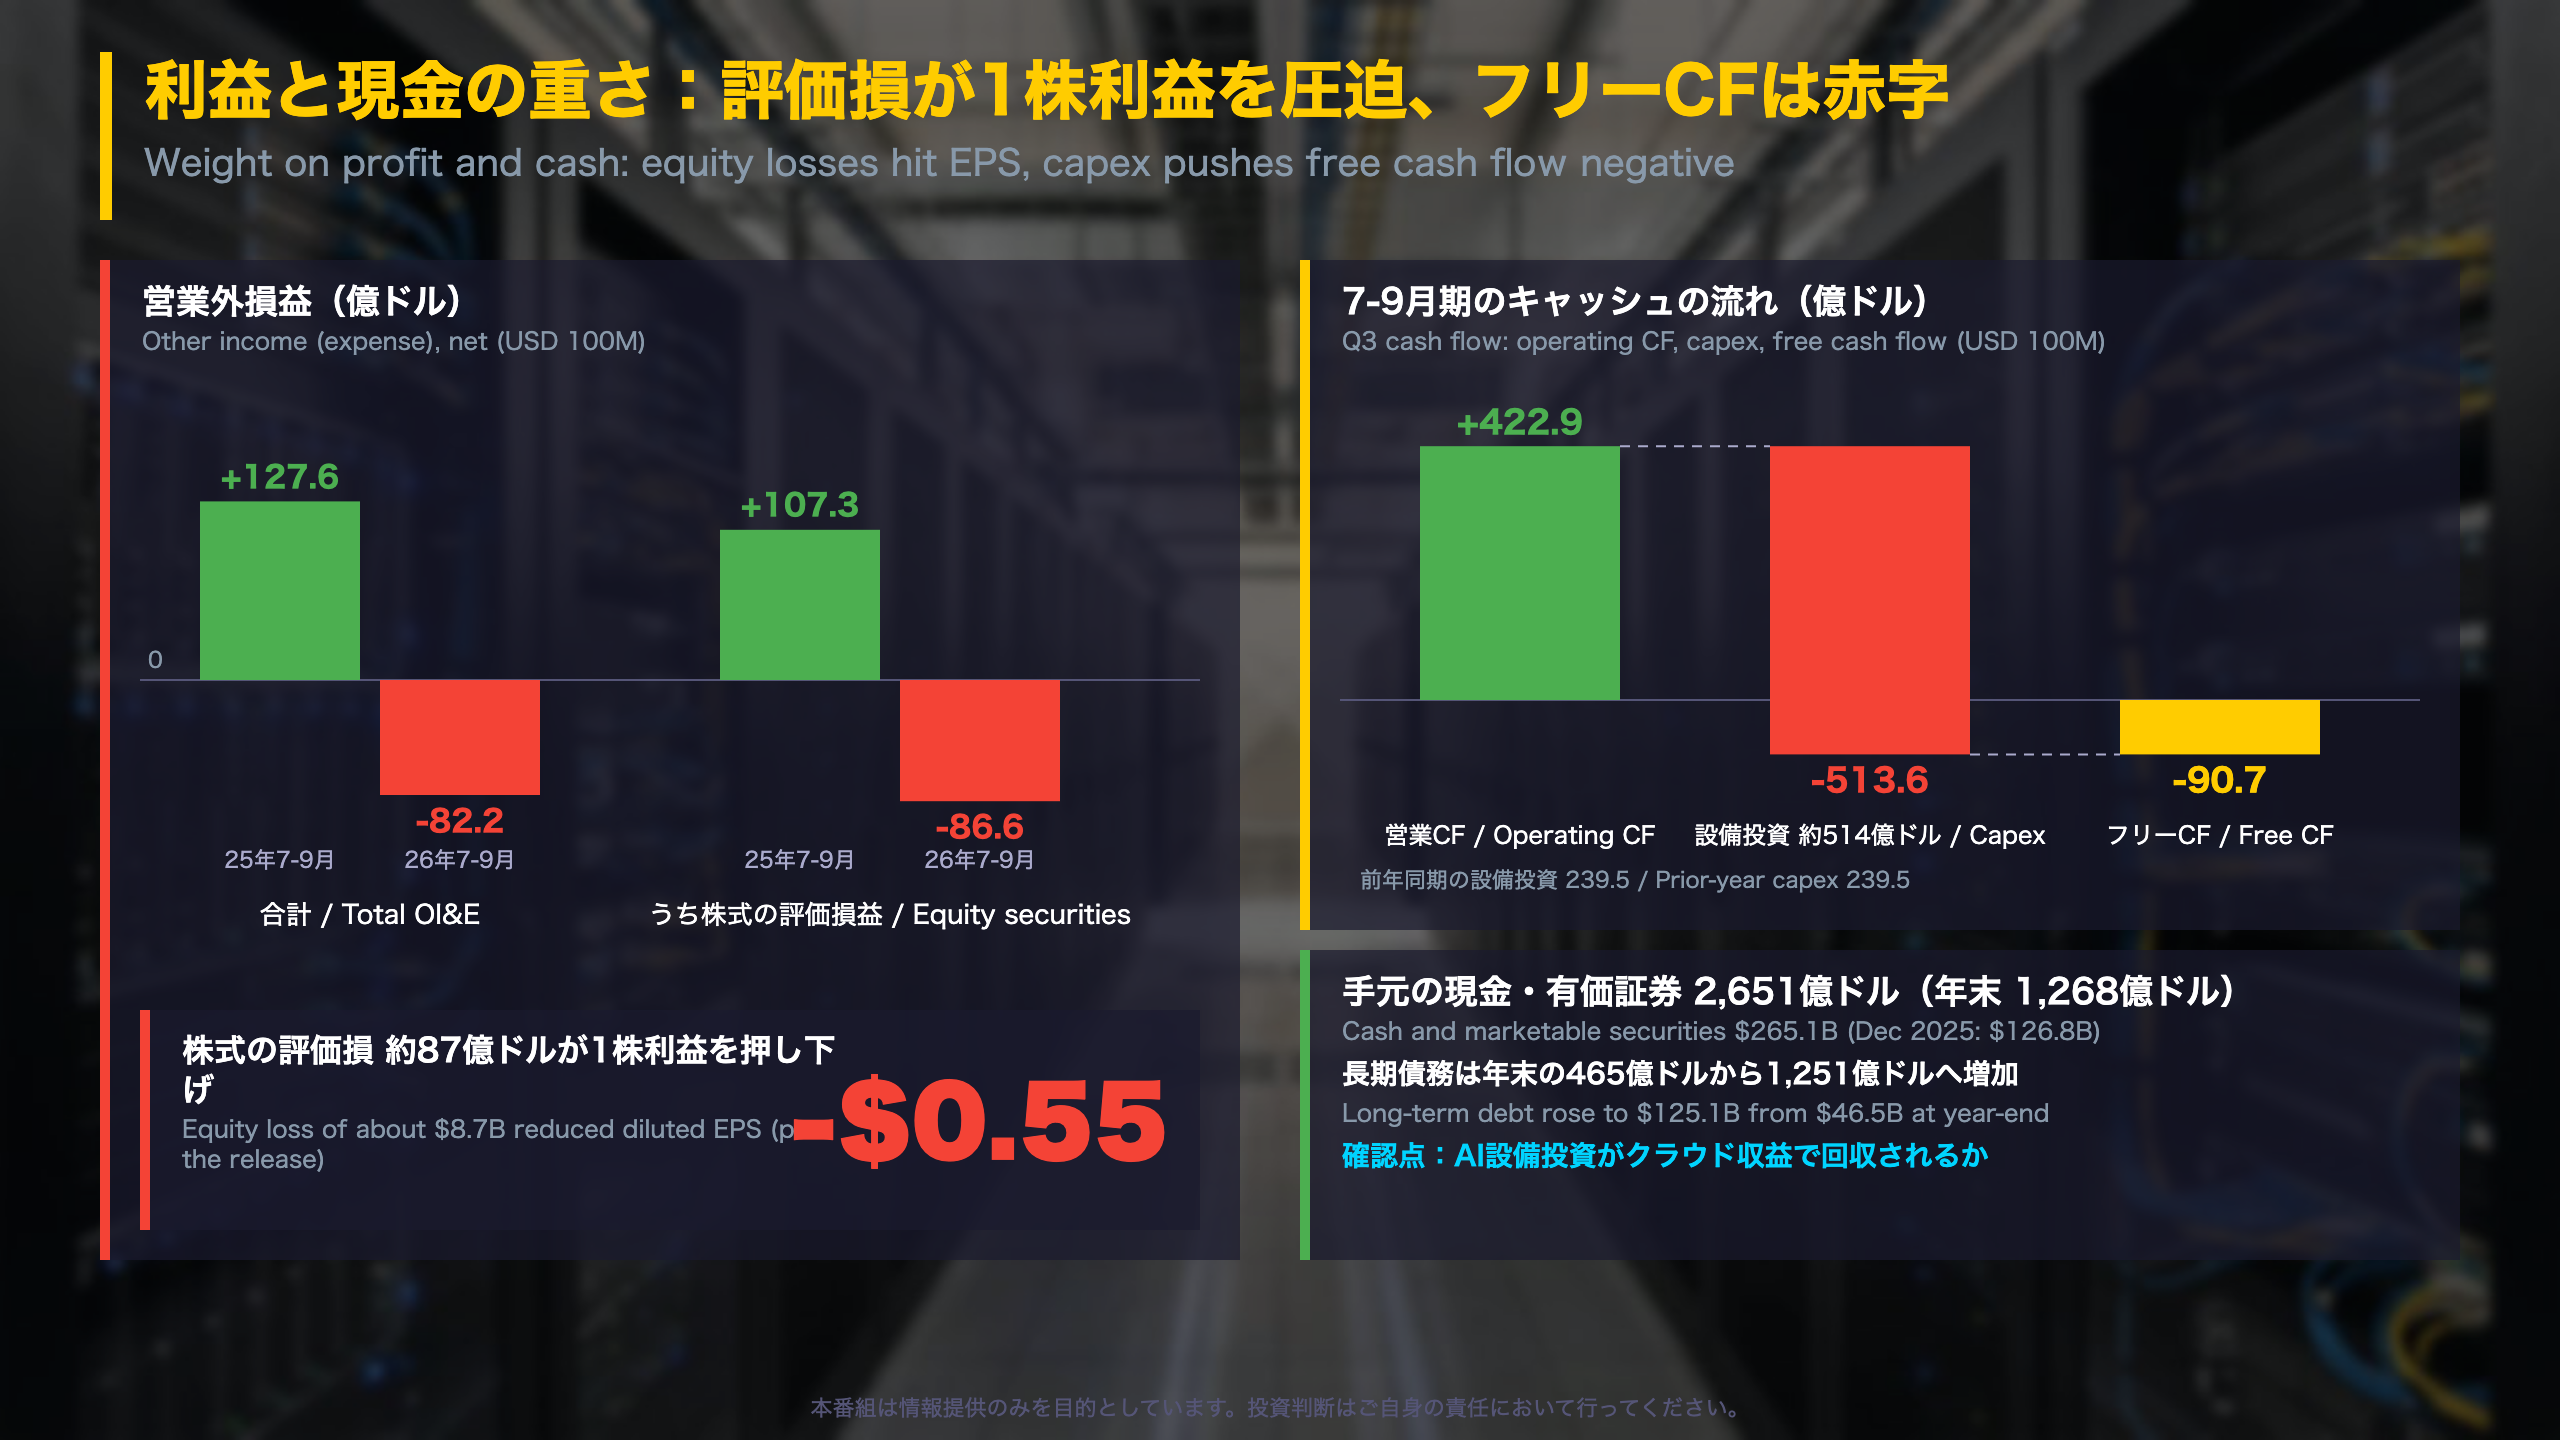
Other income and expense swung from +$12.8B to -$8.2B. The main driver was equity securities: a gain of $10.7B a year ago became a loss of $8.7B. The release notes this loss cut income tax by $1.9B, net income by $6.7B and diluted EPS by $0.55, and warns that investment valuations “could significantly contribute to the volatility of OI&E in future periods.” Interest expense also rose to $0.97B from $0.14B as debt increased.
Cash flow versus capex
Operating cash flow was $42.3B and capex $51.4B, leaving free cash flow of -$9.1B. Free cash flow has stepped down for three straight quarters, from $24.6B (Q4 2025) to $10.1B, -$5.9B and -$9.1B. Trailing-twelve-month free cash flow remains positive at $19.7B.
Funding the build-out
Alphabet issued $28.7B of senior notes, sold shares through its at-the-market program for $12.4B, and made no repurchases. Long-term debt is $125.1B versus $46.5B at year-end, while cash and marketable securities are $265.1B.
Why it matters to foreign investors
Free cash flow is a non-GAAP measure Alphabet defines as operating cash flow minus capex. It is a widely used lens for comparing AI infrastructure spending across large U.S. technology companies. Whether the spending is recovered through Cloud revenue is the question the Form 10-Q and later releases can help answer.
質疑で深める:本業の増益と純利益の振れ
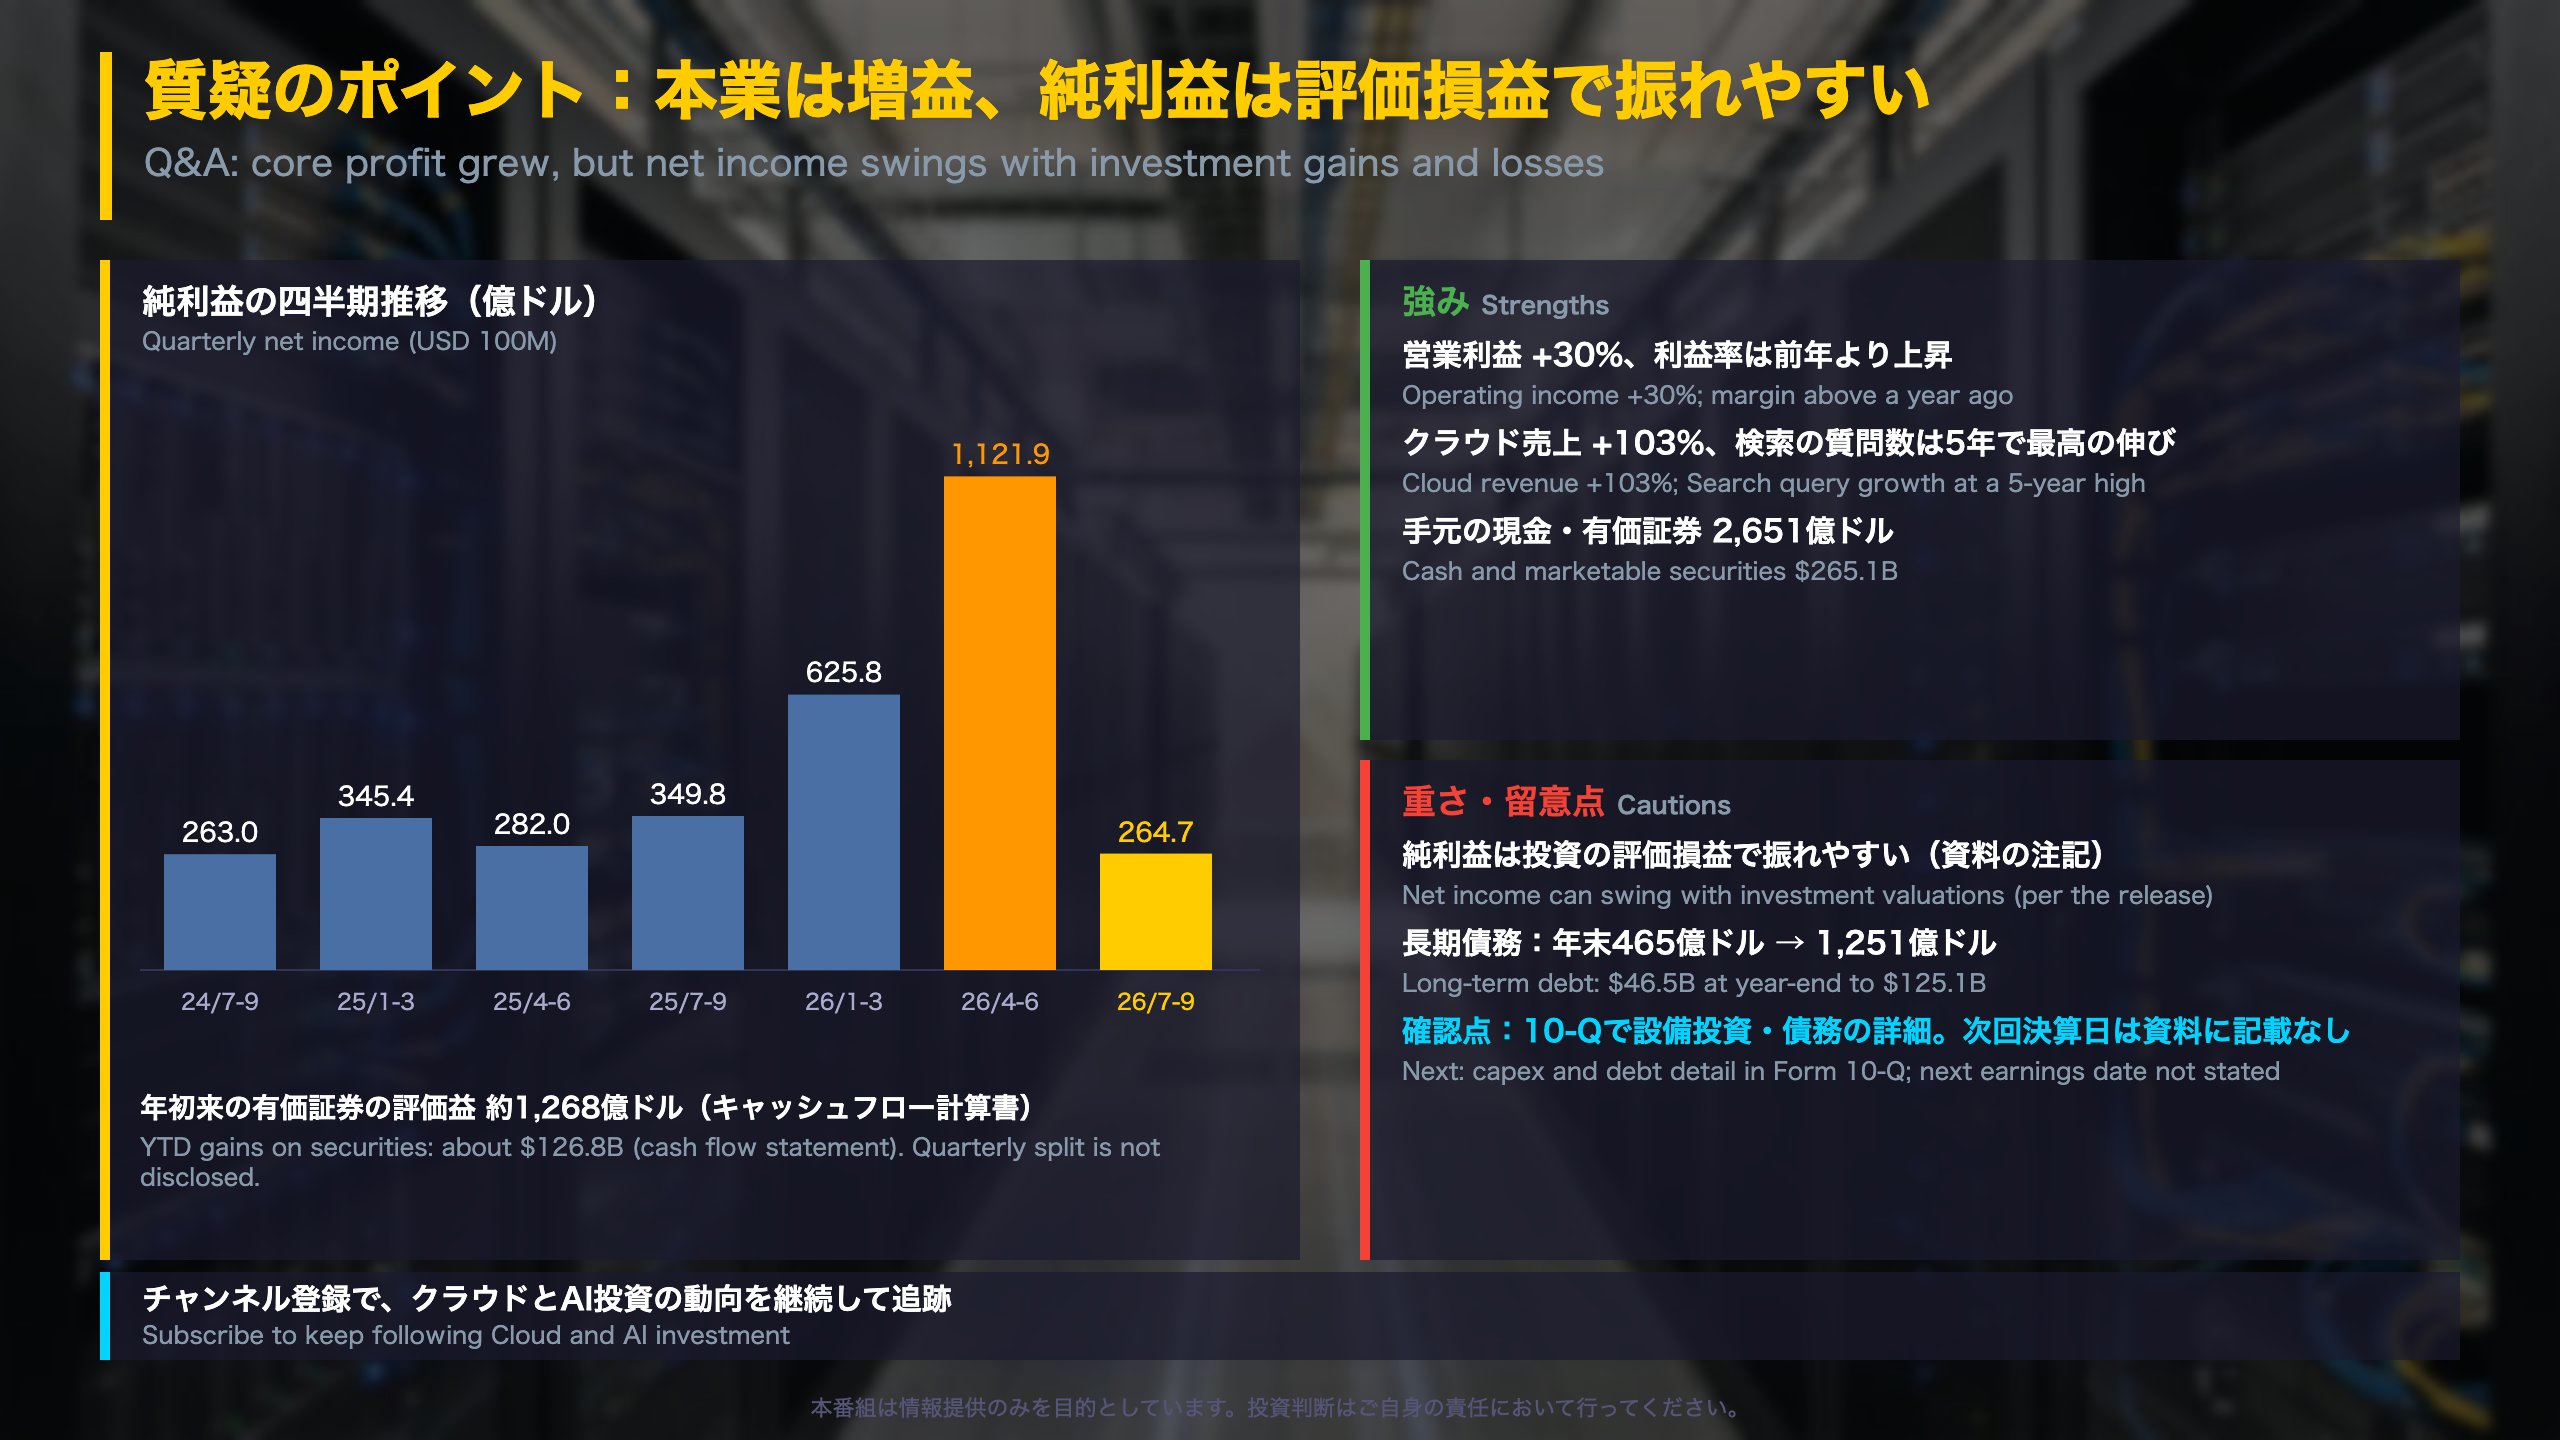
Reading net income correctly
Why quarterly net income is hard to compare
Alphabet holds large stakes in other companies, and GAAP rules require changes in the value of equity securities to run through the income statement. That means net income can swing even when operations are steady. Net income was $26.5B in Q3 2026, but $112.2B in Q2 2026 and $62.6B in Q1. Over nine months, net income was $201.2B versus $97.7B, and other income and expense totaled $127.5B versus $26.6B. The cash flow statement shows $126.8B of gains on securities year to date, consistent with that picture, although the release does not split the gains by quarter.
The company’s own caution
“Fluctuations in the value of our investments … could significantly contribute to the volatility of OI&E in future periods.”
Core versus headline
Operating income, which excludes these items, was $40.6B (+30%) in the quarter and $121.0B year to date versus $93.1B. For analysis, many investors therefore focus on operating income and free cash flow alongside GAAP EPS.
Funding and capital returns
No shares were repurchased in Q3 (prior year: $11.5B). The board declared a $0.22 quarterly common dividend payable December 14, 2026, plus dividends on the new 6.25% mandatory convertible preferred stock.
What to watch
The Form 10-Q should provide more detail on capex and debt. The release does not give the next earnings date, so readers should check the company’s investor relations calendar.
Disclaimer: This article is for informational purposes only. All investment decisions are made solely at your own risk.