
📺 Watch the Full Video Analysis
This article was automatically generated by the NFC Market Live AI analysis system. (Updated: 2026-10-25 10:31 JST)
📊 NFC Market Live Weekly Programming Review (Oct 18-24)
We produced 33 programs this week. Total views were 3,113 (Shorts 2,788 / long-form 325) and subscribers rose by 10.
📈 The SpaceX and Tesla earnings Shorts posted view rates above 130%. The Meta/Tesla earnings live drew 159 views and 382 minutes of watch time, the largest of any new long-form video.
💡 Daily views and watch time spiked on Oct 20-22, but ordinary days stayed low, so the effect of the four Oct 5-8 initiatives cannot be isolated.
⚠️ Production cost was JPY 6,258 (JPY 2.01 per view). X-related cost of JPY 1,514 produced 3,484 impressions and 4 likes.
🎙️ Live broadcasts kept silence to one ~4s gap each; memory use above 80% remains the issue.
オープニング:今週の編成サマリー
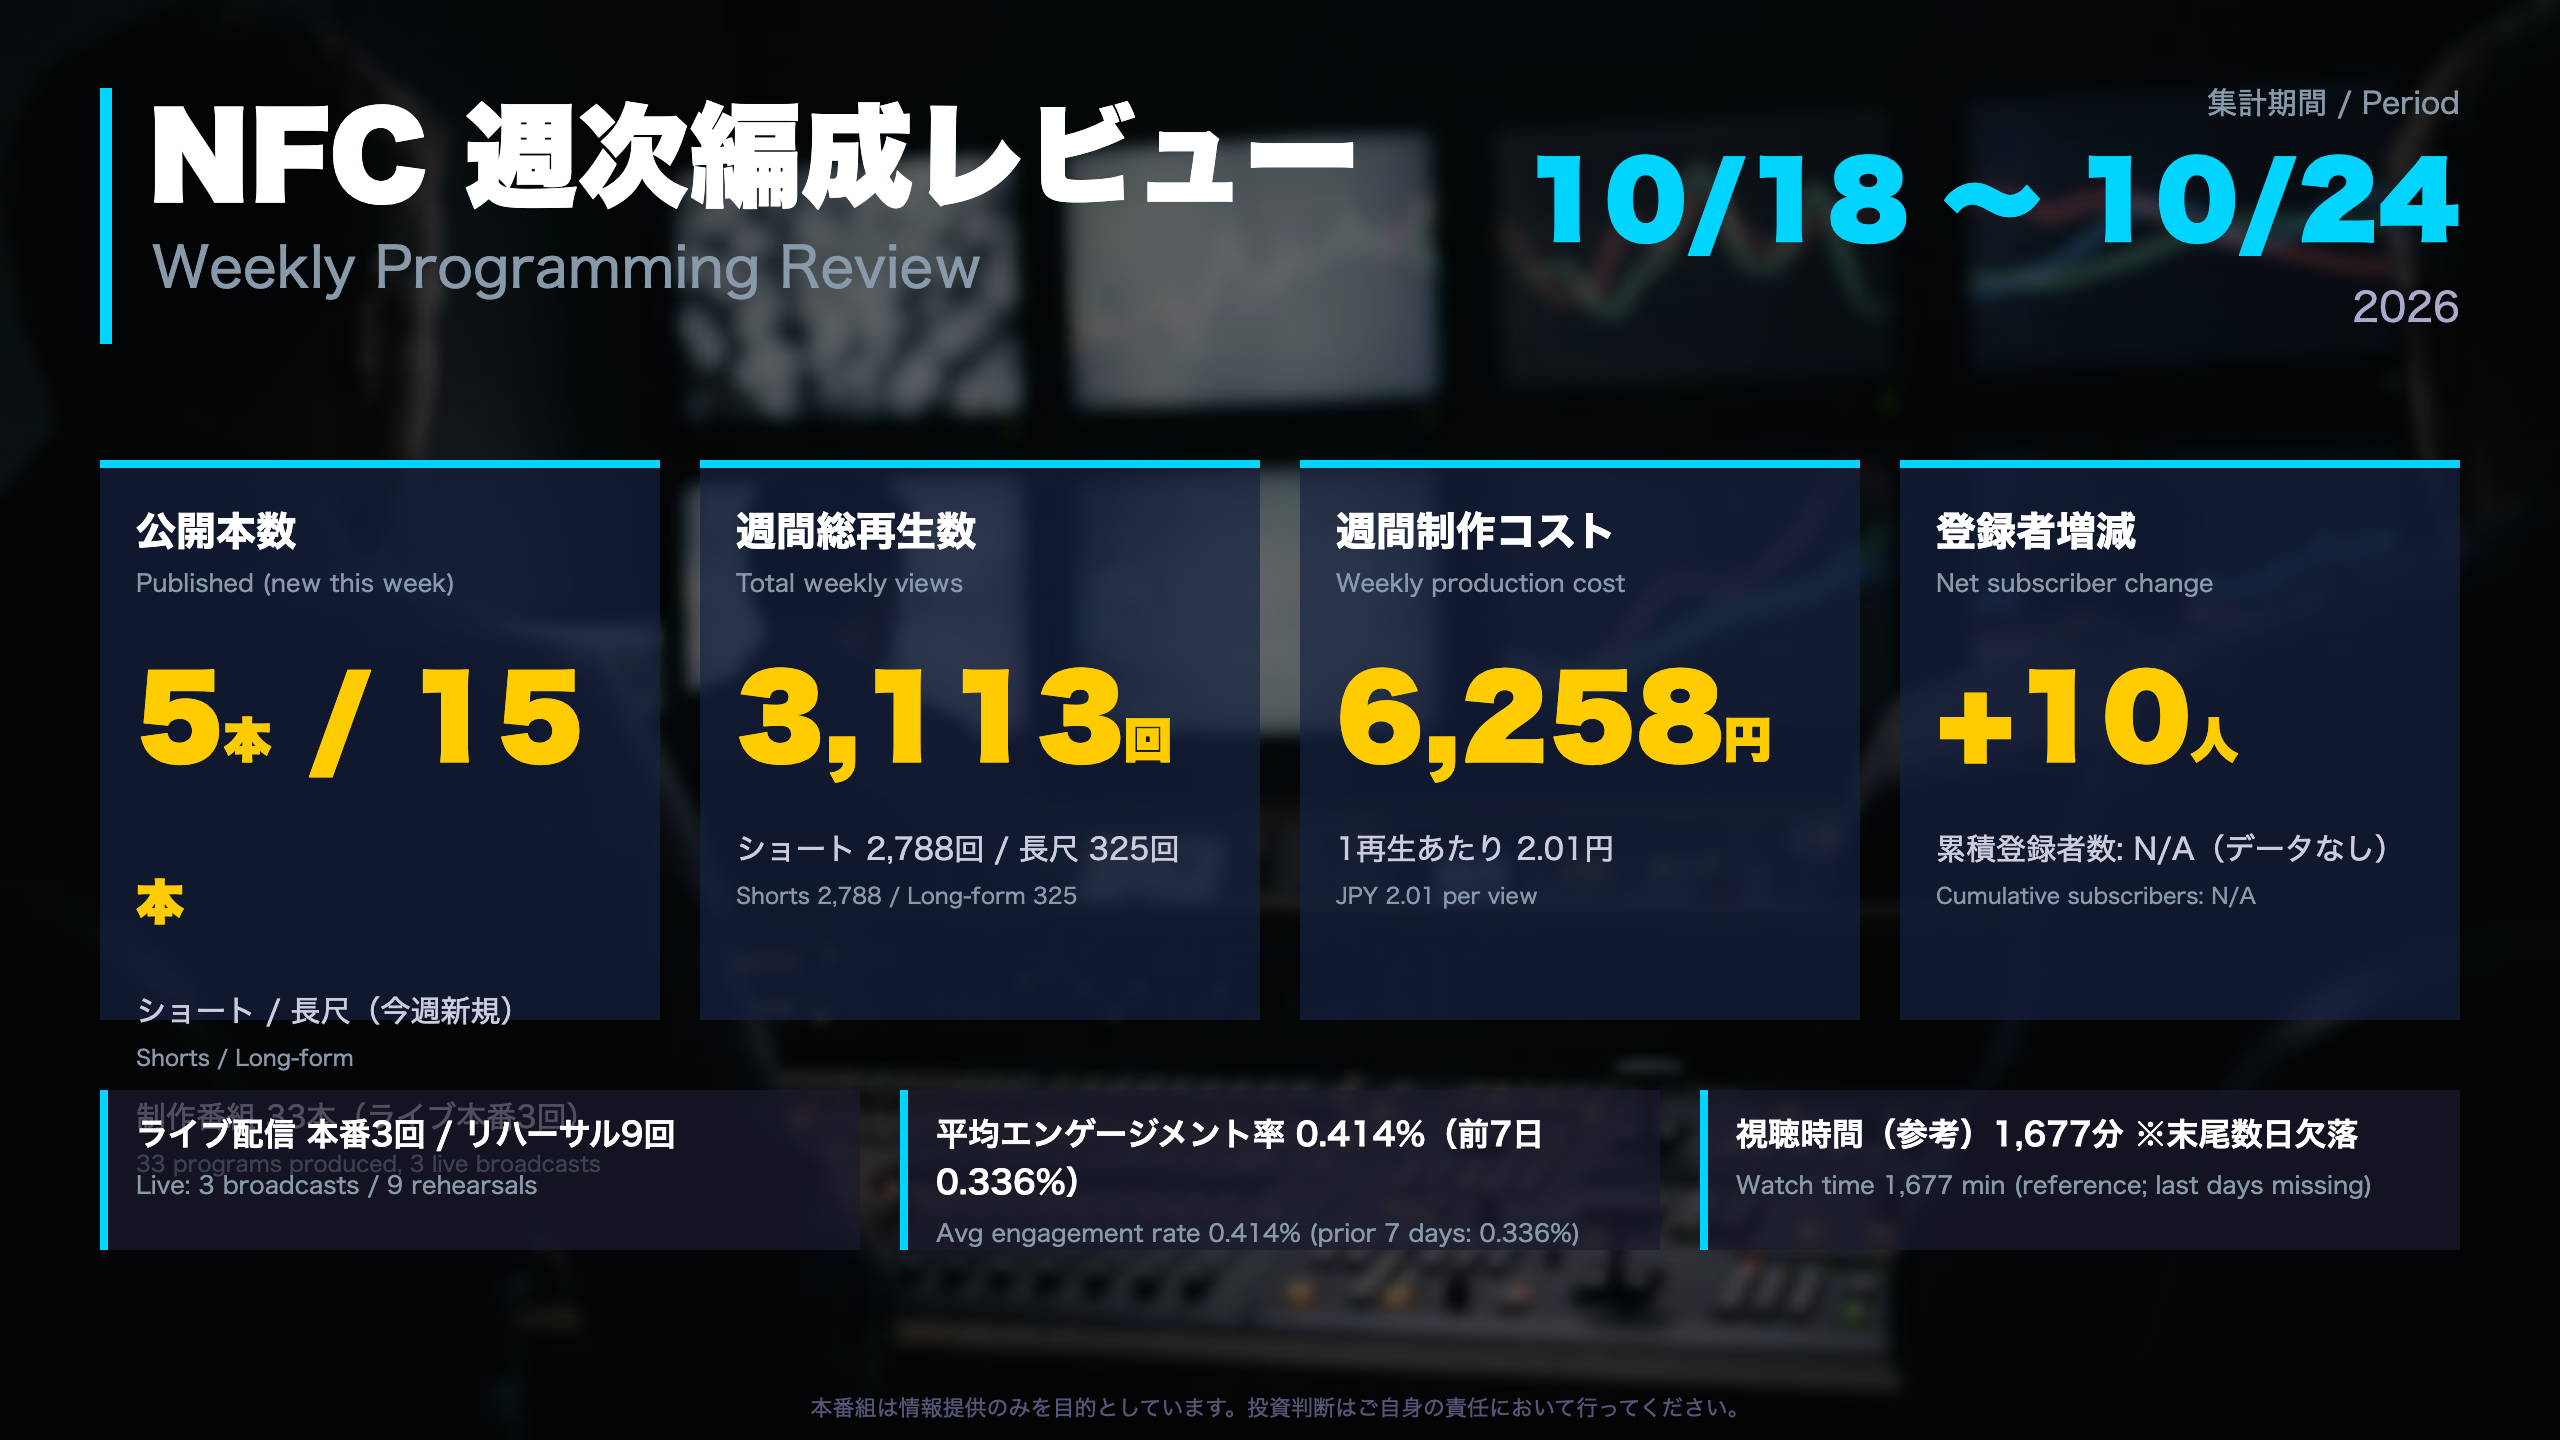
Week at a glance (Oct 18-24, 2026)
NFC Market Live is an AI-run channel that explains Japanese and US economic data and major US earnings as they are released. This week the team produced 33 programs, published 5 new Shorts and 15 new long-form videos, and ran 3 live broadcasts plus 9 rehearsals.
Headline KPIs
- Total views: 3,113 (Shorts 2,788 / long-form 325)
- Production cost: JPY 6,258, or JPY 2.01 per view
- Net subscriber change: +10
- Average engagement rate: 0.414% (prior 7 days: 0.336%)
- Watch time (reference): 1,677 minutes
Data caveats
- The watch-time figure is missing the last few days of the analytics window, so Oct 23-24 is not included.
- The daily series covers Sep 27 to Oct 22, which is 26 days, not the 28 days its label suggests.
- The summary’s ‘previous 7 days = 4,825 views’ equals the sum of weeks 1-3 in the daily table, so it is not a clean one-week comparison. We therefore rely on the weekly grouping of the daily data.
Why it matters
For English-speaking readers, think of this as a small broadcaster’s weekly editorial meeting: which formats earn attention, what each cost, and what to change next week. The key pattern is that earnings coverage (Shorts and live streams) carried the week, while ordinary days stayed quiet. Compared with large financial channels, absolute numbers are small, so single videos can swing percentages sharply; we flag sample size throughout.
今週新規ショート動画 成績リスト
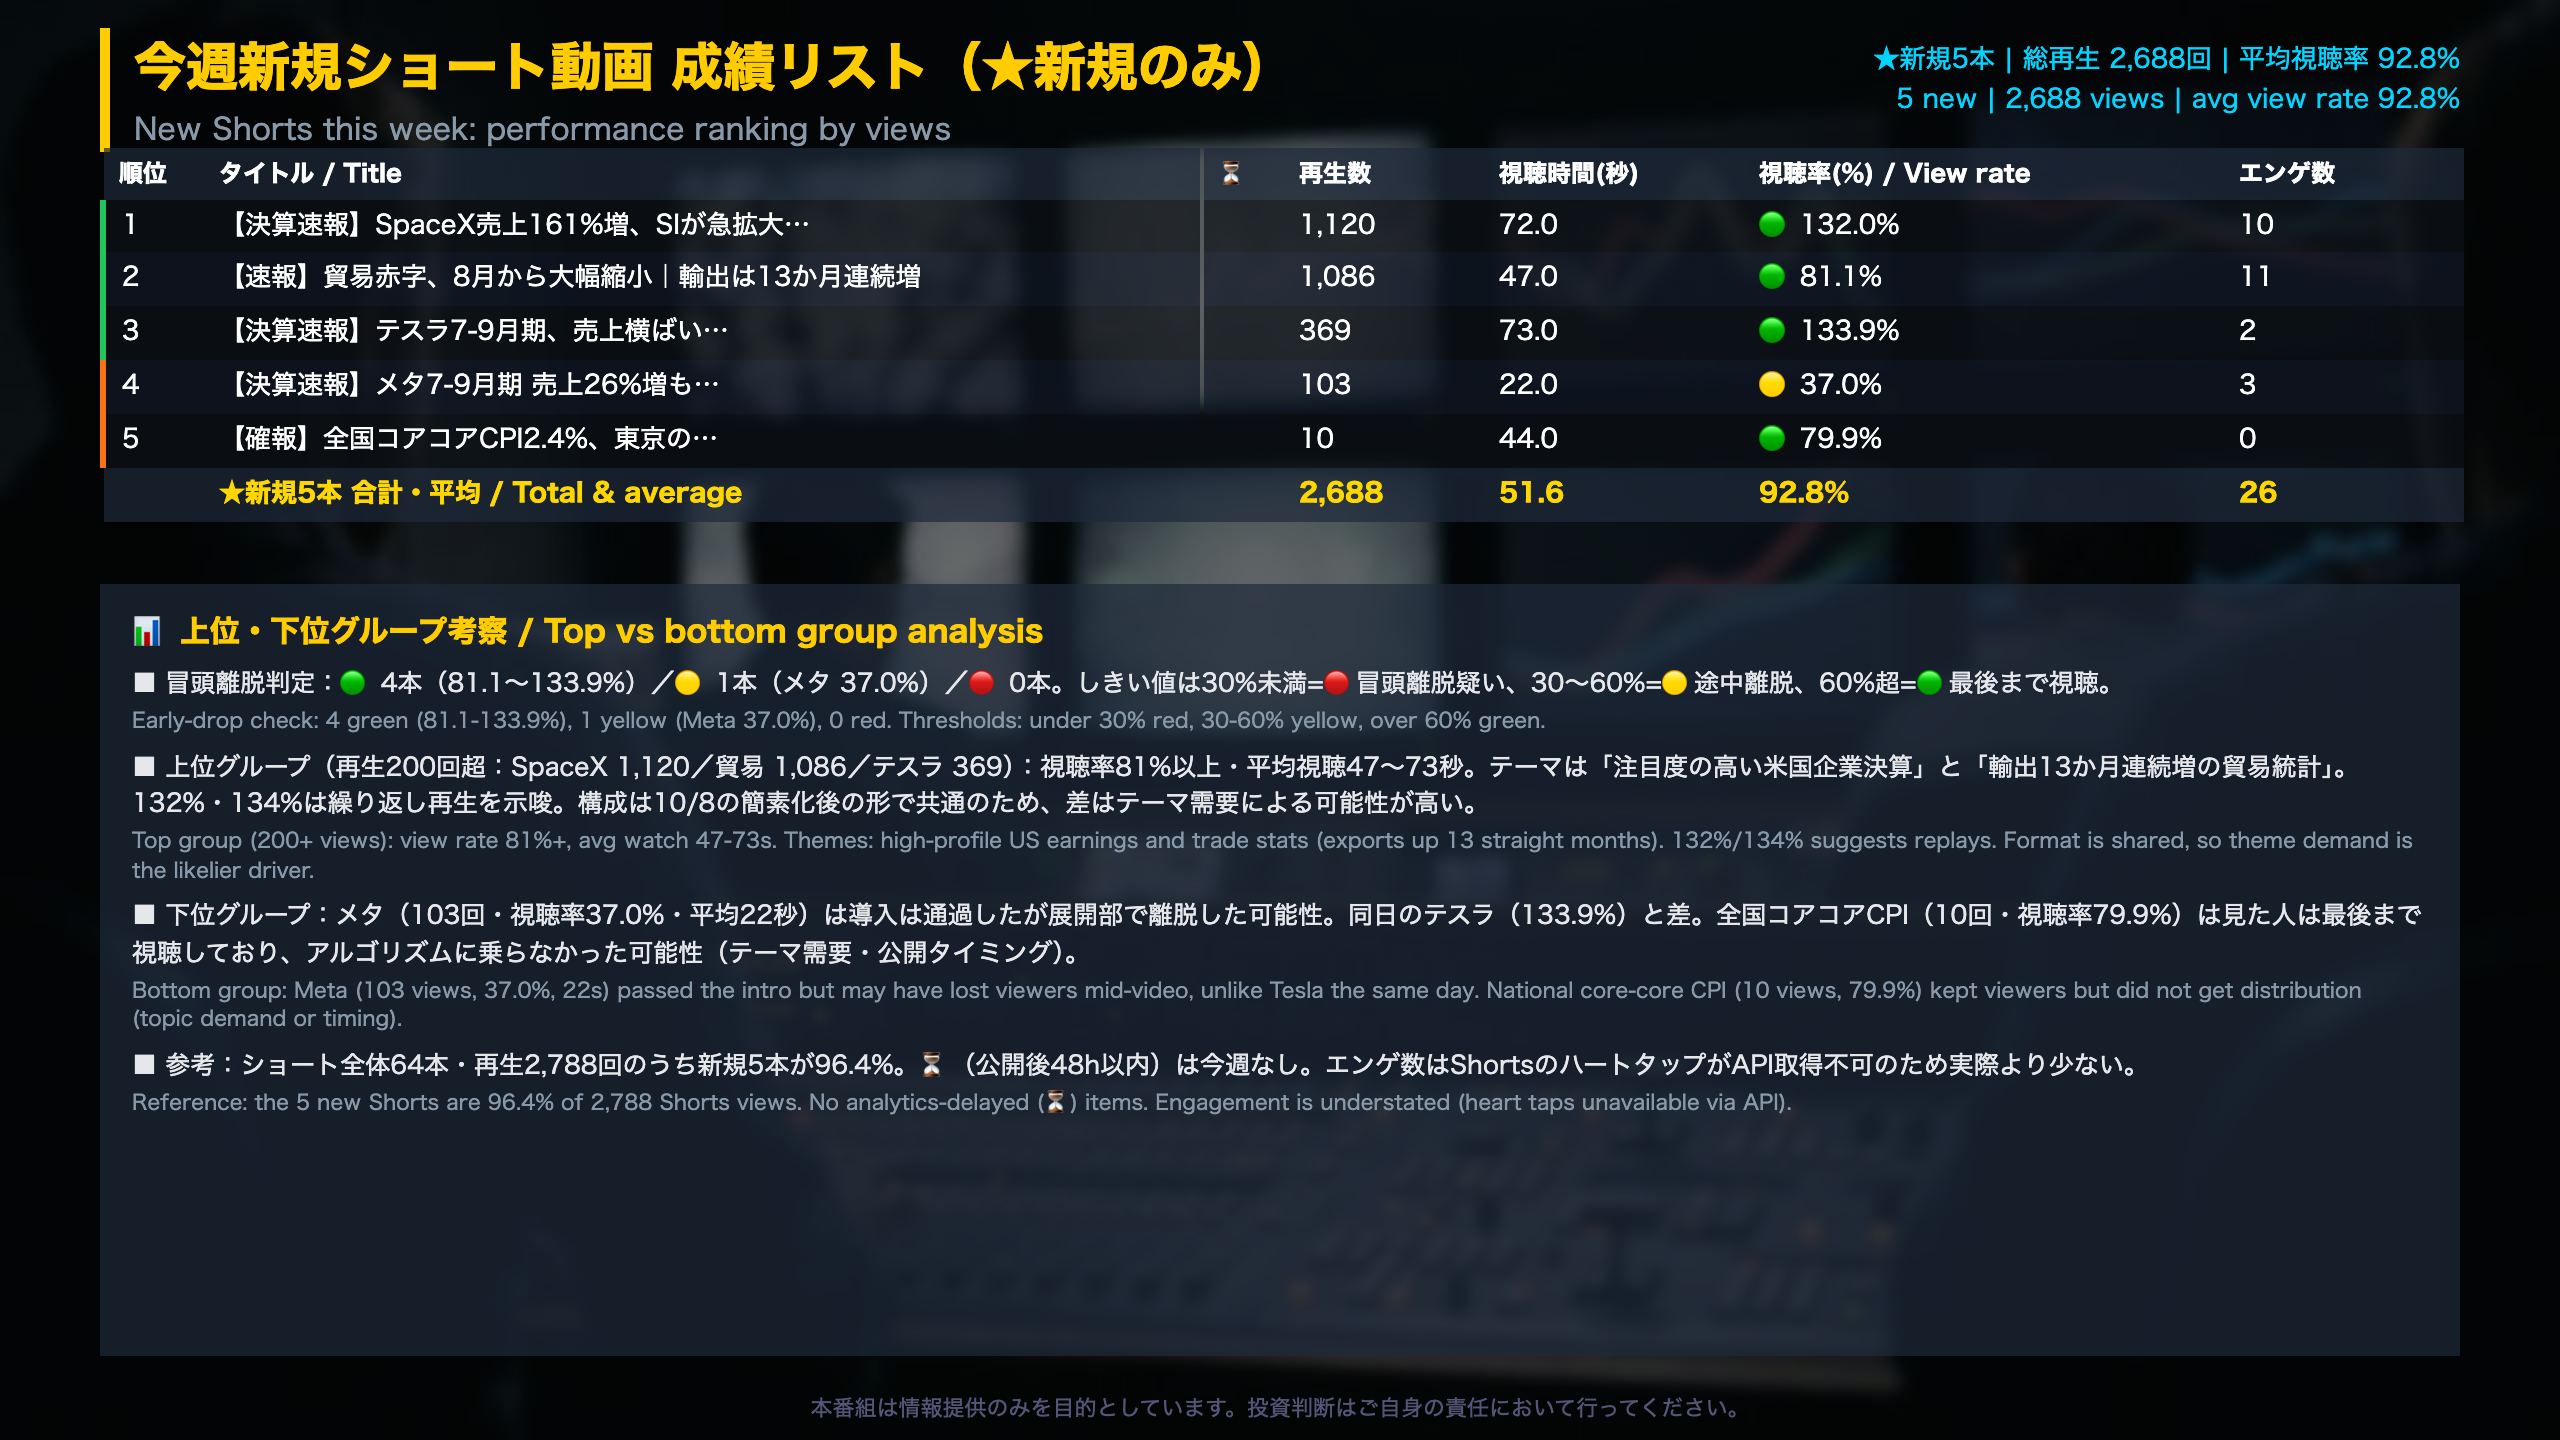
Five new Shorts, in detail
| Topic | Views | Avg watch (s) | View rate | Engagement |
|---|---|---|---|---|
| SpaceX earnings | 1,120 | 72.0 | 132.0% | 10 |
| Trade balance | 1,086 | 47.0 | 81.1% | 11 |
| Tesla earnings | 369 | 73.0 | 133.9% | 2 |
| Meta earnings | 103 | 22.0 | 37.0% | 3 |
| National core-core CPI | 10 | 44.0 | 79.9% | 0 |
How to read a view rate above 100%
For YouTube Shorts, the average view percentage is average watch time divided by video length. Because Shorts loop automatically, a viewer who replays a clip pushes the figure past 100%. The SpaceX (132.0%) and Tesla (133.9%) Shorts therefore likely include replays, which is a stronger signal than a plain 90% completion.
Strengths and weaknesses
- Strength: the top three Shorts all held at least 81% view rates, and the five new Shorts generated 96.4% of all Shorts views this week.
- Weakness: views are concentrated in two videos. The Meta Short (37.0%) lost viewers mid-video, while the national core-core CPI Short kept viewers (79.9%) but reached only 10 people, which points to distribution rather than content quality.
Context for non-Japanese readers
Core-core CPI is Japan’s consumer price index excluding fresh food and energy, watched closely by the Bank of Japan, and the Tokyo flash figure is a leading indicator of the national release. The trade balance Short covers data from Japan’s Ministry of Finance.
Data quirk
An older 10-year yield Short shows a 574.2% view rate on 13 views, which looks like a measurement artifact and is excluded from the analysis. Engagement counts are understated because Shorts heart taps are not available via the API.
今週新規長尺動画 成績リスト
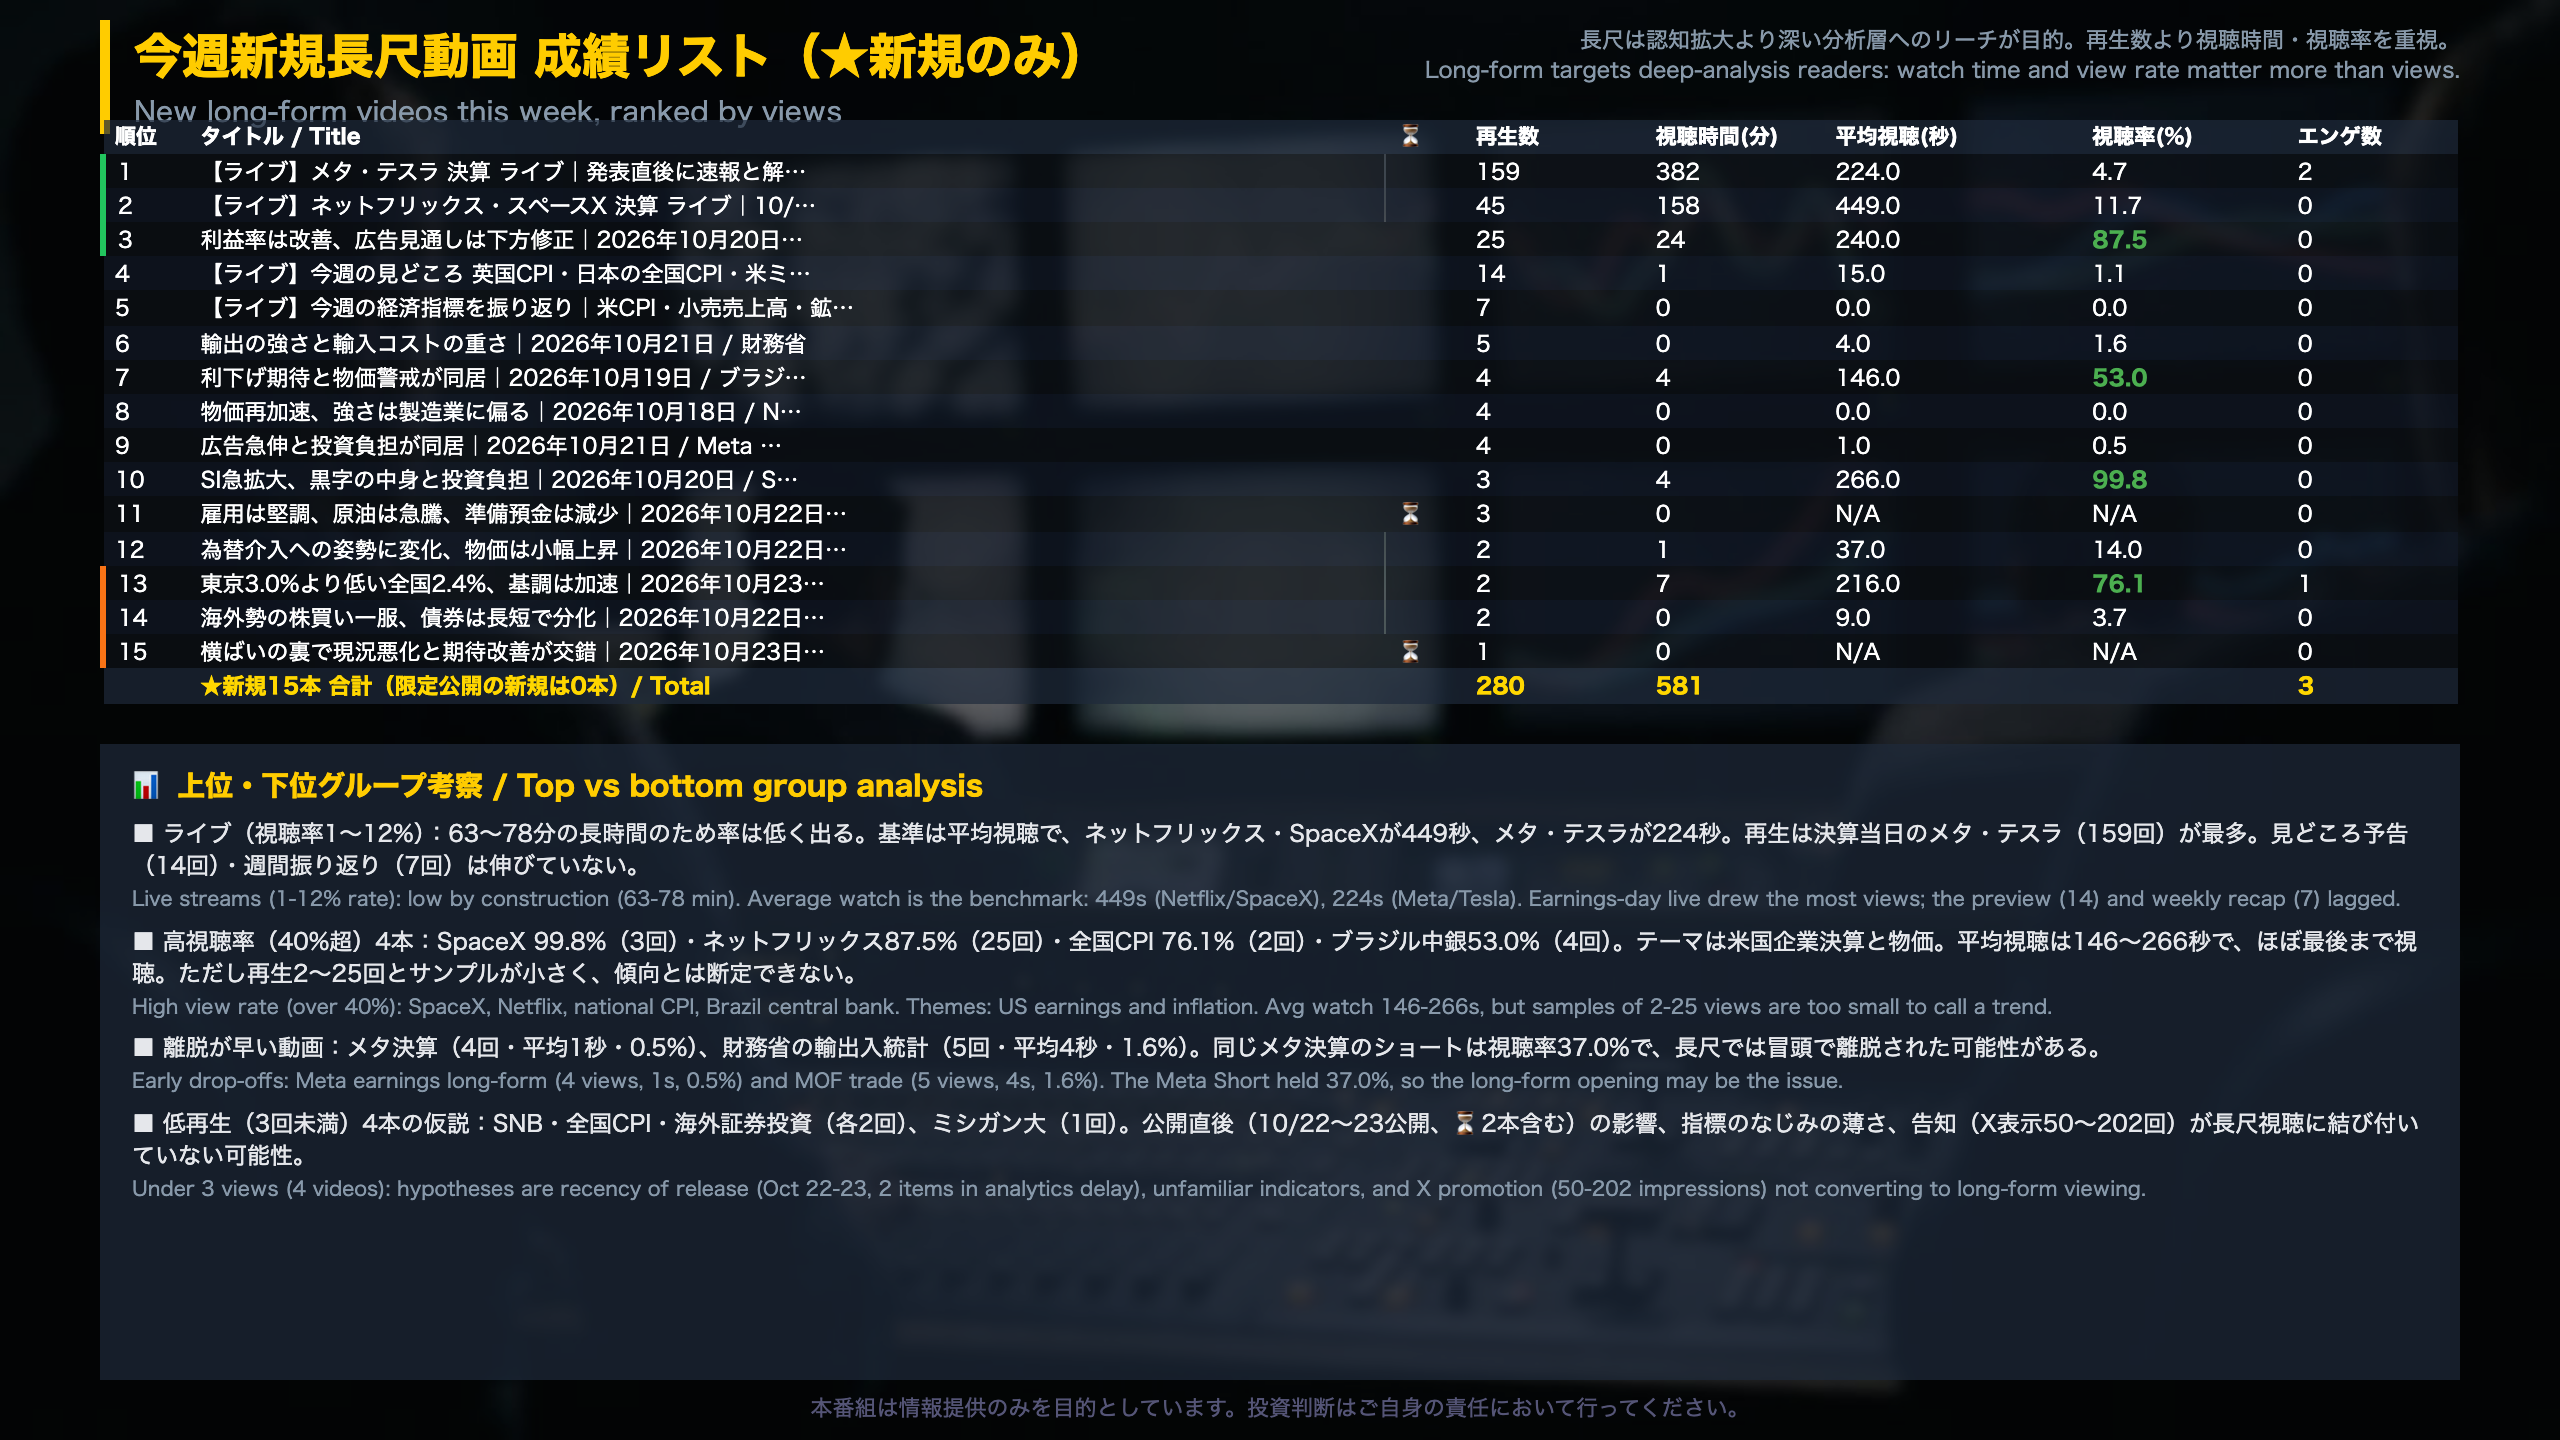
Reading this week’s 15 new long-form videos
Separate live streams from regular deep dives
- Live streams (63-78 minutes): view rates of 1-12% are mechanically low because of length. Average watch time is the fairer metric: 449 seconds for the Netflix/SpaceX live and 224 seconds for the Meta/Tesla live.
- Regular deep dives (about 4 minutes): several reached view rates between 53.0% and 99.8%.
The four videos above 40% view rate
| Topic | Views | Avg watch (s) | View rate |
|---|---|---|---|
| SpaceX (Starlink-type segment growth) | 3 | 266.0 | 99.8% |
| Netflix | 25 | 240.0 | 87.5% |
| National CPI (Japan) | 2 | 216.0 | 76.1% |
| Central Bank of Brazil | 4 | 146.0 | 53.0% |
With only 2-25 views each, this is a hint about interested niches, not a trend.
Early drop-offs
The Meta earnings long-form had 4 views and 1 second average watch time (0.5%), and the Ministry of Finance trade video had 5 views at 4 seconds (1.6%). This contrasts with the Meta Short, which held a 37.0% view rate.
Low views and pending analytics
Four videos had fewer than three views (Swiss National Bank minutes, Japan national CPI, MOF securities flows, University of Michigan sentiment). Two videos are still within the analytics delay window, so their watch metrics are marked N/A.
Context
Long-form videos here are meant to reach readers who want deeper analysis of releases such as Japan’s CPI or MOF data, so we weigh watch time and view rate above raw view count. For comparison, large financial channels routinely see thousands of views per upload; at this scale, one extra viewer can move a percentage dramatically.
チャンネル成長トレンド(日次推移)
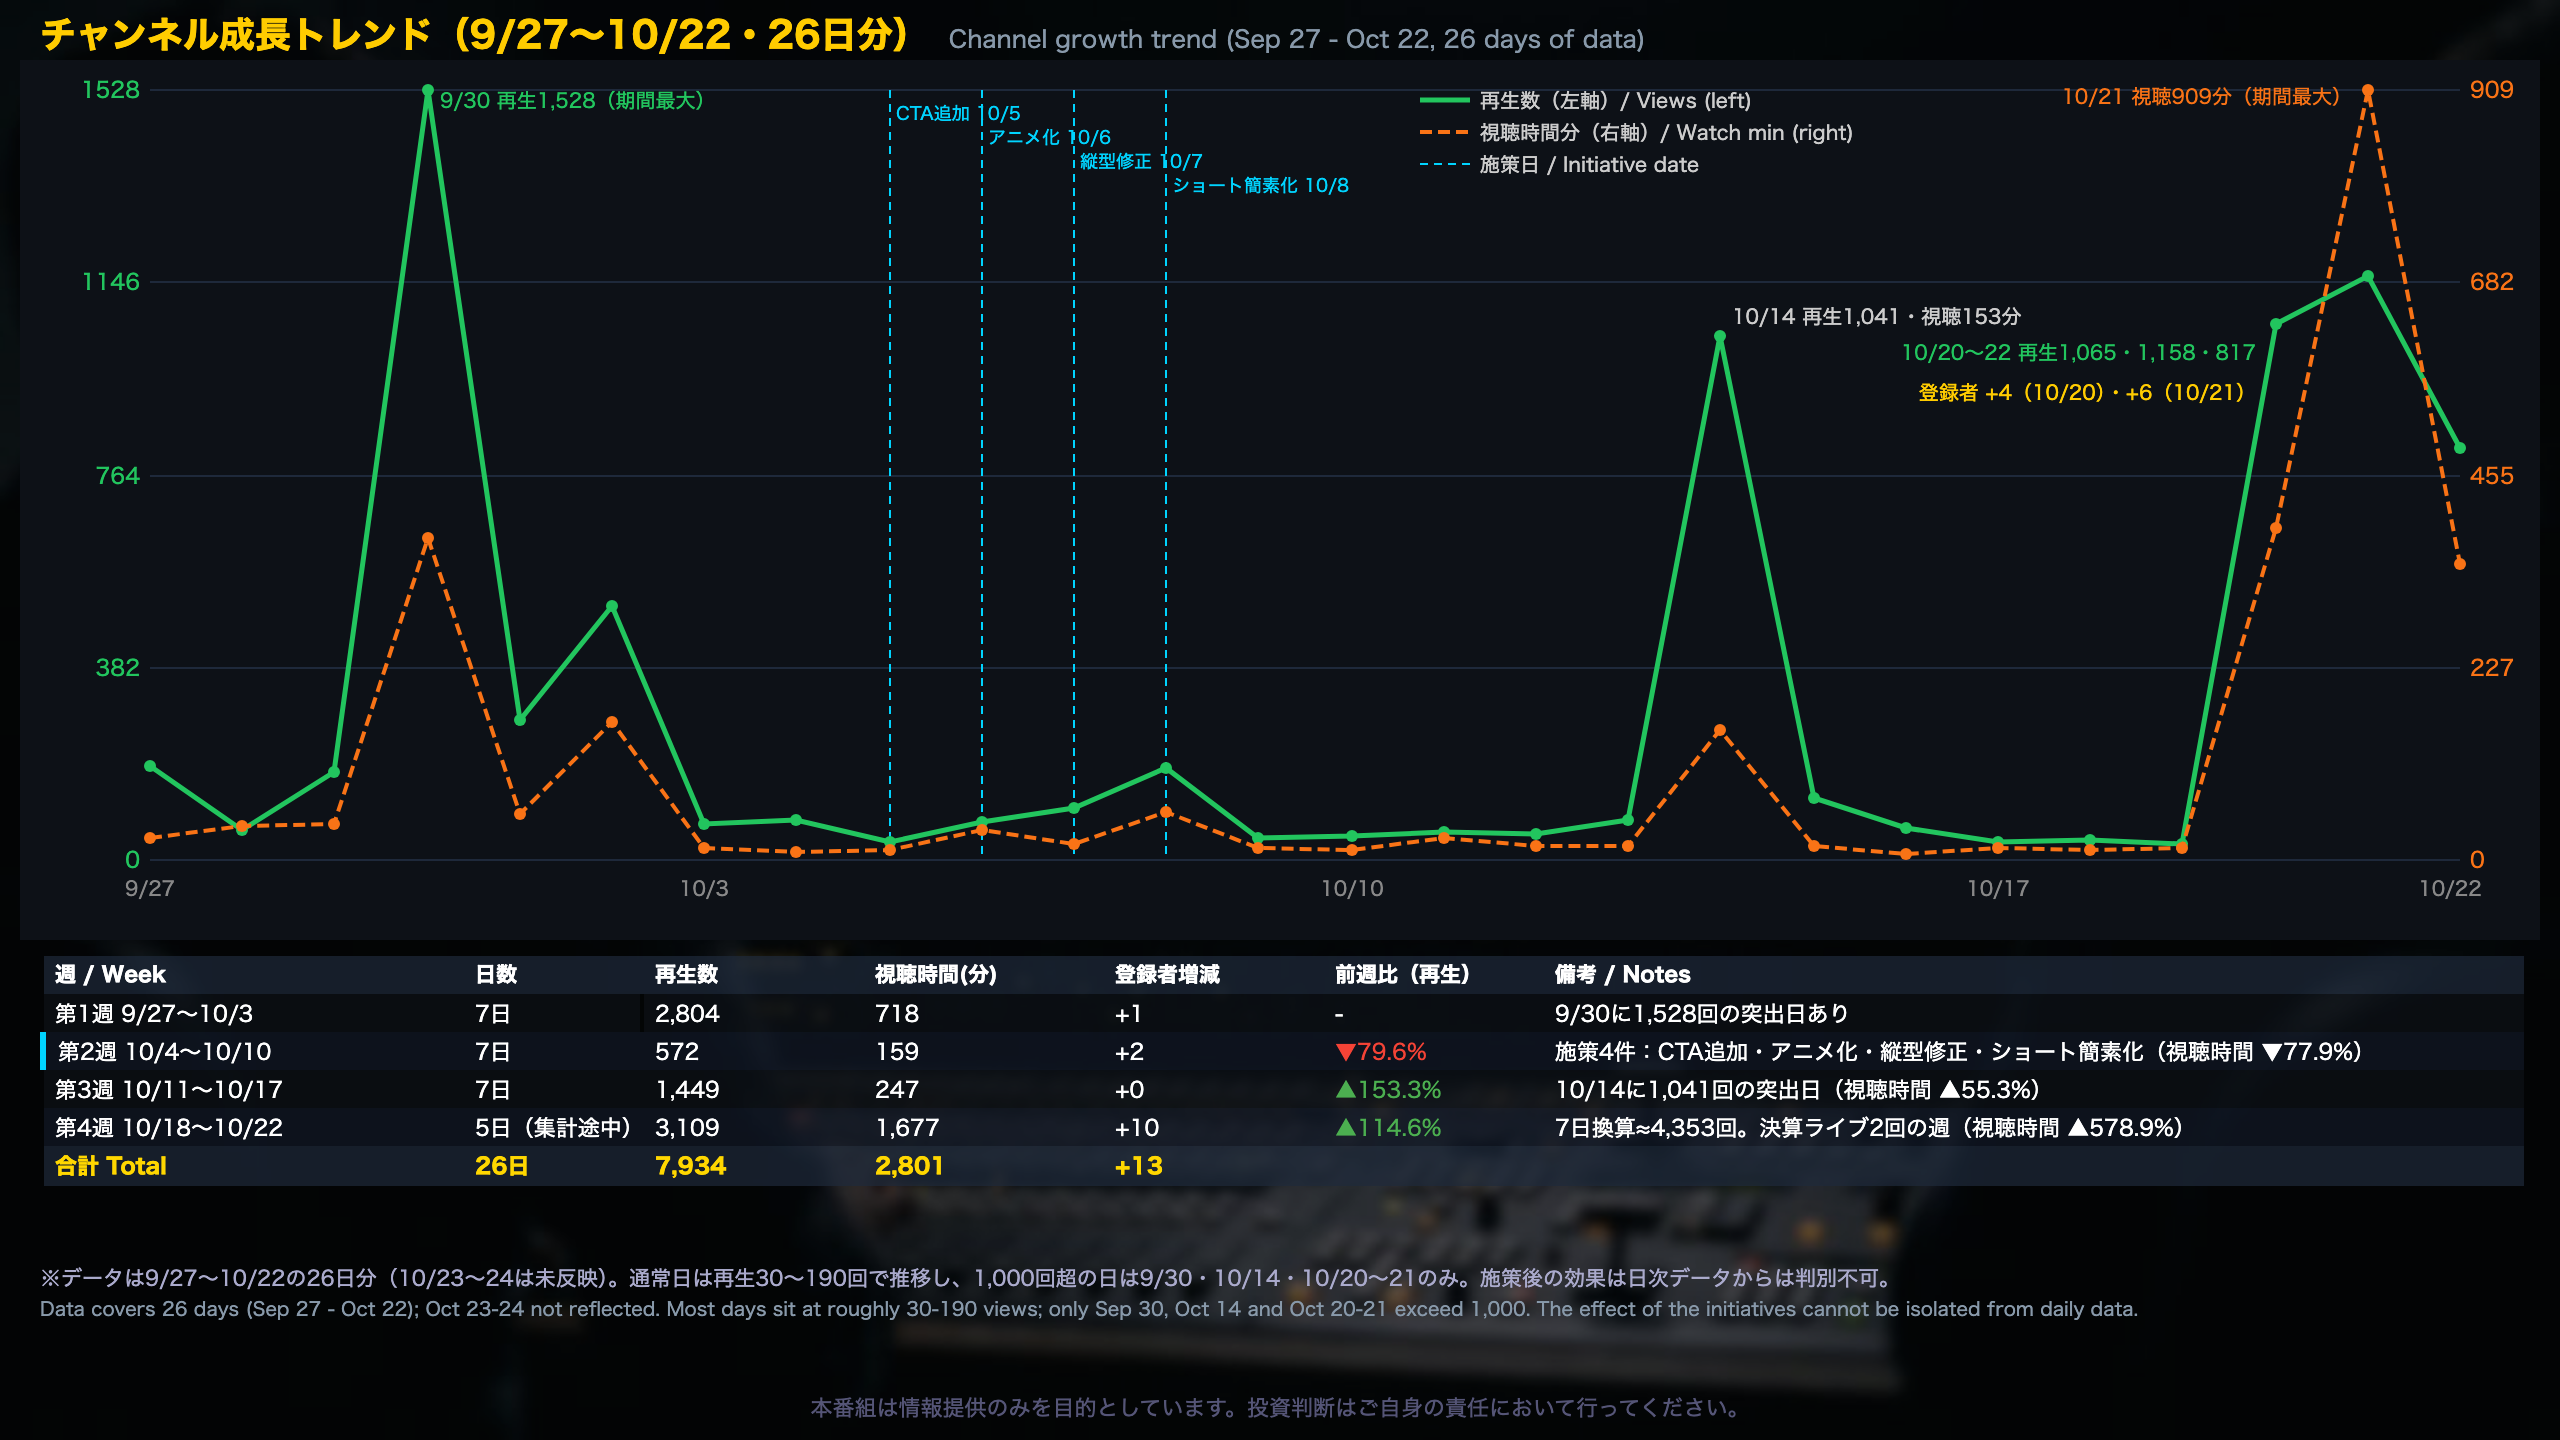
Daily trend, Sep 27 – Oct 22 (26 days)
Comparing the three peaks
| Date | Views | Watch time (min) | Approx. seconds per view |
|---|---|---|---|
| Sep 30 | 1,528 | 379 | ~15 |
| Oct 14 | 1,041 | 153 | ~9 |
| Oct 21 | 1,158 | 909 | ~47 |
Oct 21 had fewer views than Sep 30 but the highest watch time of the period, meaning viewers stayed far longer per view. These ratios are our own division of the daily figures, offered as a rough guide.
Weekly progression
- Views: 2,804 -> 572 (-79.6%) -> 1,449 (+153.3%) -> 3,109 for only five days (+114.6%; about 4,353 if scaled to seven days).
- Watch time rose about 6.8x from week 3 (247 min) to week 4 (1,677 min).
- Subscribers: +1, +2, +0, then +10, with +4 on Oct 20 and +6 on Oct 21.
Checking the initiative timeline
The four initiatives (CTA added Oct 5, animated slides Oct 6, vertical-layout fix Oct 7, simplified Shorts structure Oct 8) were followed by 45-78 daily views on Oct 9-13, similar to 70-81 on Oct 3-4 before the changes. The 79.6% drop in week 2 is mostly explained by week 1 containing the 1,528-view outlier on Sep 30.
Bull and bear readings
- Bull: the earnings-live week is the strongest of the 26 days on views, watch time and subscriptions together, and viewers stayed longer.
- Bear: ordinary-day volumes have not moved, so the channel remains dependent on event days. A single week cannot show whether the spike persists.
Data note
The series ends Oct 22, so Oct 23-24 are not reflected. For context, for a young channel the share of views from event days is typically high; the useful test is whether the baseline between events rises over several weeks.
今週の番組制作コスト分析
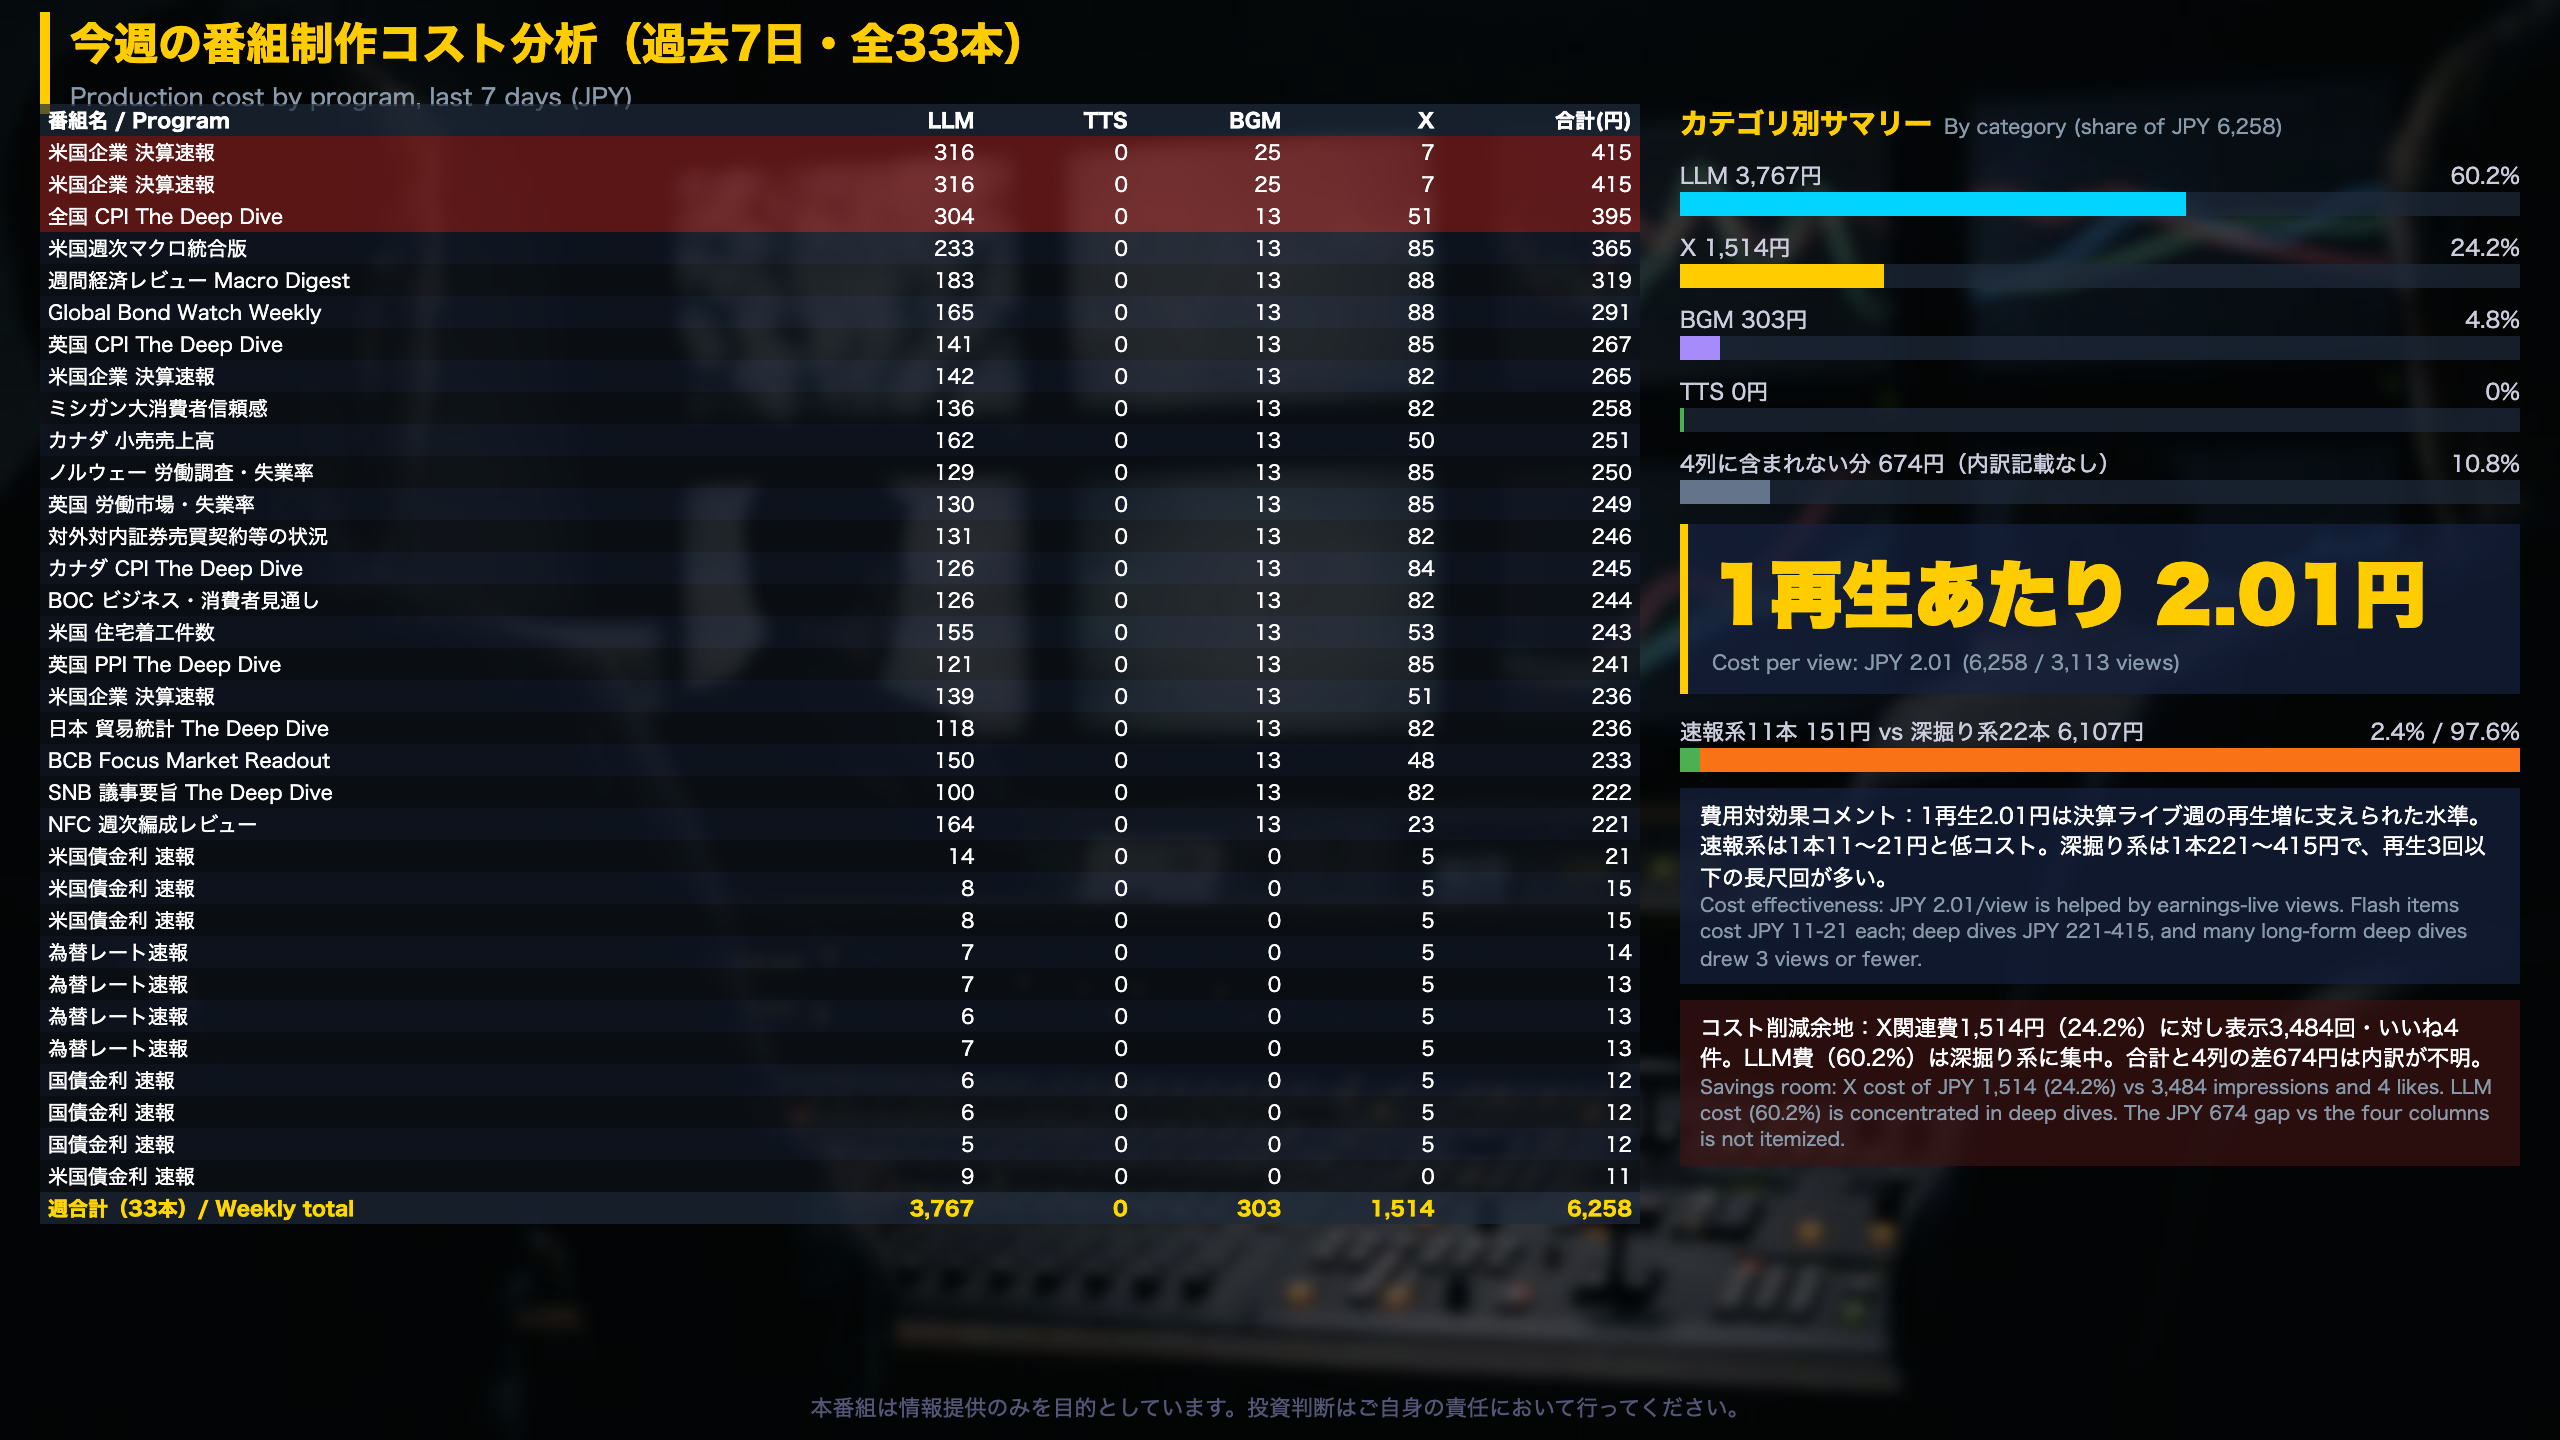
Cost structure in detail (last 7 days, 33 programs)
By category
| Category | Amount | Share |
|---|---|---|
| LLM | JPY 3,767 | 60.2% |
| X (social posting) | JPY 1,514 | 24.2% |
| BGM | JPY 303 | 4.8% |
| TTS | JPY 0 | 0% |
| Not itemized in the four columns | JPY 674 | 10.8% |
Program totals do not equal the sum of the four columns (for example, the JPY 415 earnings flash is JPY 348 across the four). The source gives no breakdown for the difference, so we do not estimate it.
Flash versus deep dive
- Rate and FX flash programs (11): JPY 11-21 each, JPY 151 in total, or 2.4% of spending.
- Deep-dive programs (22): JPY 221-415 each, JPY 6,107 in total (97.6%), averaging about JPY 278.
- The four US earnings flash programs alone cost JPY 1,331, or 21.3%.
Reading the cost effectiveness
- JPY 2.01 per view is helped by the surge in views during the earnings-live days.
- X posting cost JPY 1,514, against 3,484 impressions and 4 likes across 45 posts, roughly JPY 0.43 per impression.
- Many long-form deep dives drew three views or fewer against production costs above JPY 200 each, so reach is limited relative to cost.
What to review
Candidates are trimming X posts and adjusting the frequency of indicator episodes with low views. This is a single week of data, so the effect of cuts on views needs testing. For context, LLM-based production cost scales with the number and length of generated assets, which is why deep-dive formats cost 15-20 times as much as flash formats.
今週のライブ配信 振り返り
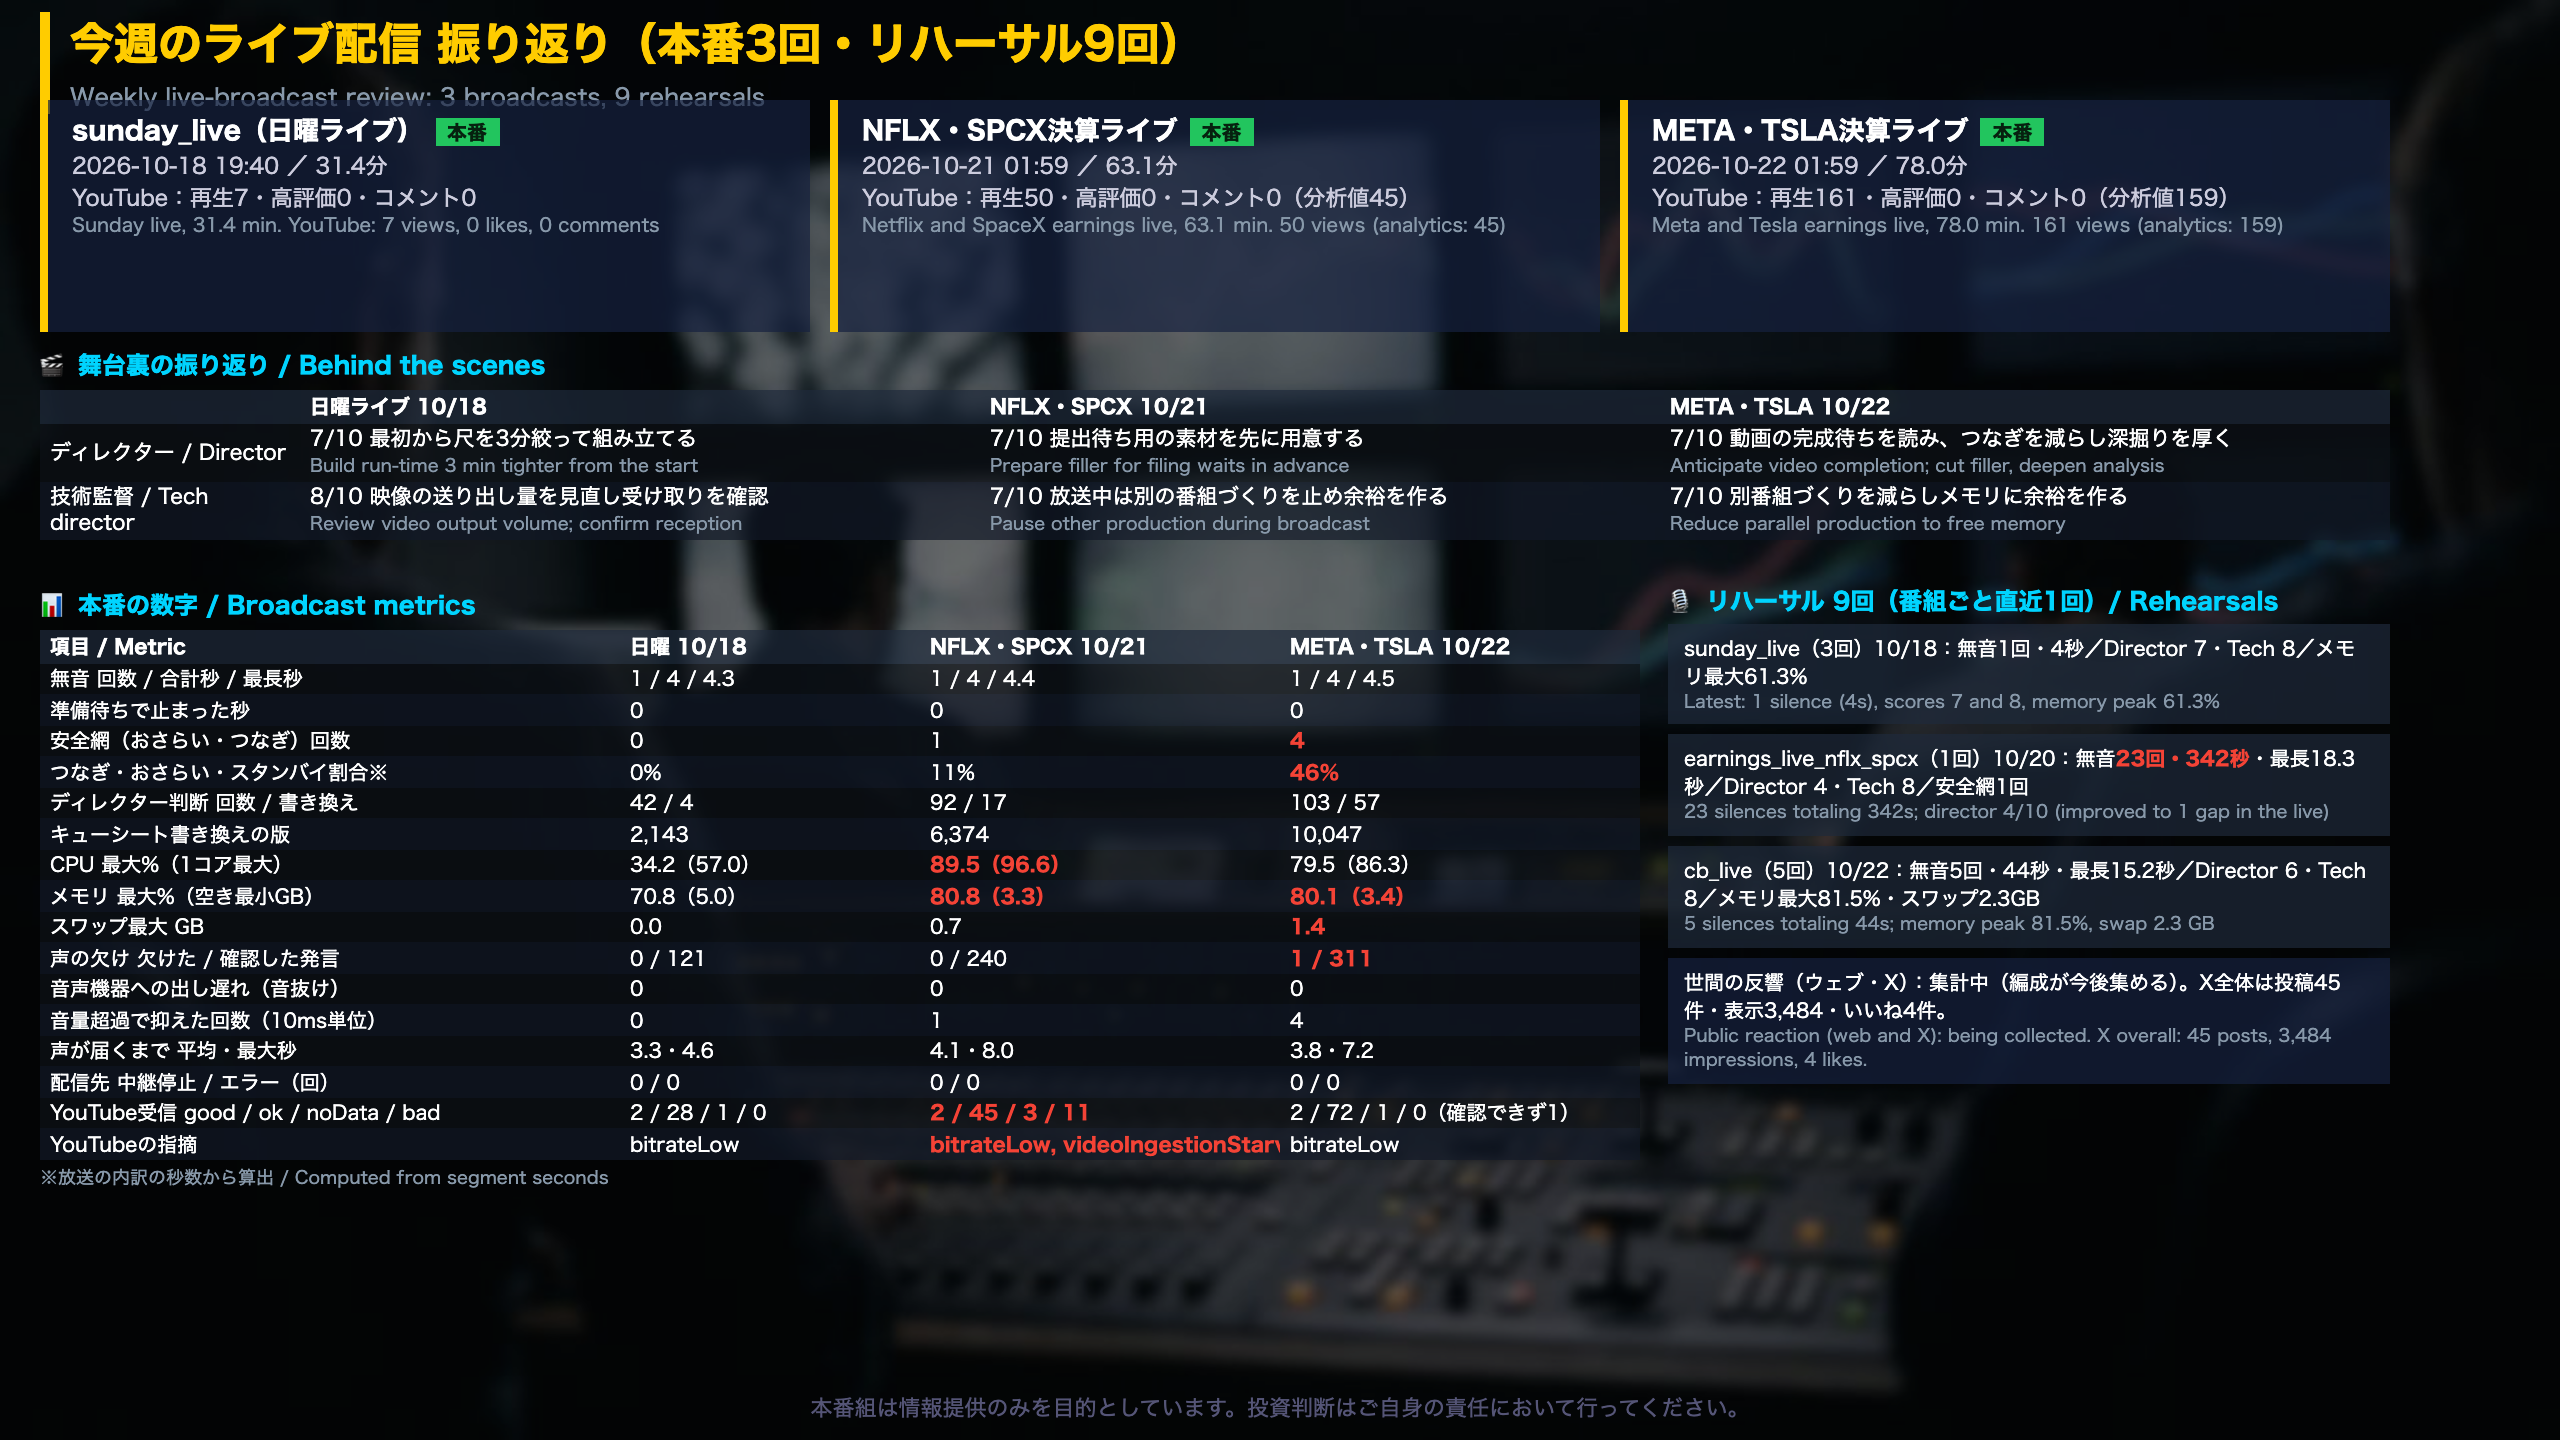
Live broadcast review
Three broadcasts
| Broadcast | Length | YouTube views | Silence | Director / Tech scores |
|---|---|---|---|---|
| Sunday live (Oct 18) | 31.4 min | 7 | 1 gap, 4s | 7/10, 8/10 |
| NFLX & SPCX earnings (Oct 21) | 63.1 min | 50 | 1 gap, 4s | 7/10, 7/10 |
| META & TSLA earnings (Oct 22) | 78.0 min | 161 | 1 gap, 4s | 7/10, 7/10 |
Filler share
Computed from the segment breakdown, filler (bridge, recap, standby) segments were 413 seconds (11%) of the NFLX/SPCX broadcast and 2,069 seconds (46%) of the META/TSLA broadcast. The META/TSLA run also triggered the safety net four times and had 57 director rewrites out of 103 decisions, which suggests the pre-produced videos were slow to complete.
Technical health
- Peak CPU: 34.2% / 89.5% / 79.5%.
- Peak memory: 70.8% / 80.8% / 80.1%, with peak swap rising from 0.0 to 0.7 to 1.4 GB.
- Voice dropout: 1 of 311 utterances in the META/TSLA broadcast (21% of the clip silent, during a recap segment).
- YouTube ingest health: 11 ‘bad’ checks in the NFLX/SPCX broadcast with a videoIngestionStarved flag; other broadcasts only flagged bitrateLow.
Rehearsals
The Oct 20 NFLX/SPCX rehearsal had 23 silences totaling 342 seconds (longest 18.3s) and a director score of 4/10; the live broadcast cut that to a single 4-second gap. The latest cb_live rehearsal (Oct 22) had 5 silences totaling 44 seconds.
Context
These are live-streamed AI-produced explainers covering earnings releases within hours of the filing. Because videos are generated while on air, memory contention between live output and background production is the main technical risk. Public reaction (web and X) is still being collected; X overall shows 45 posts, 3,484 impressions and 4 likes.
来週の番組制作方針
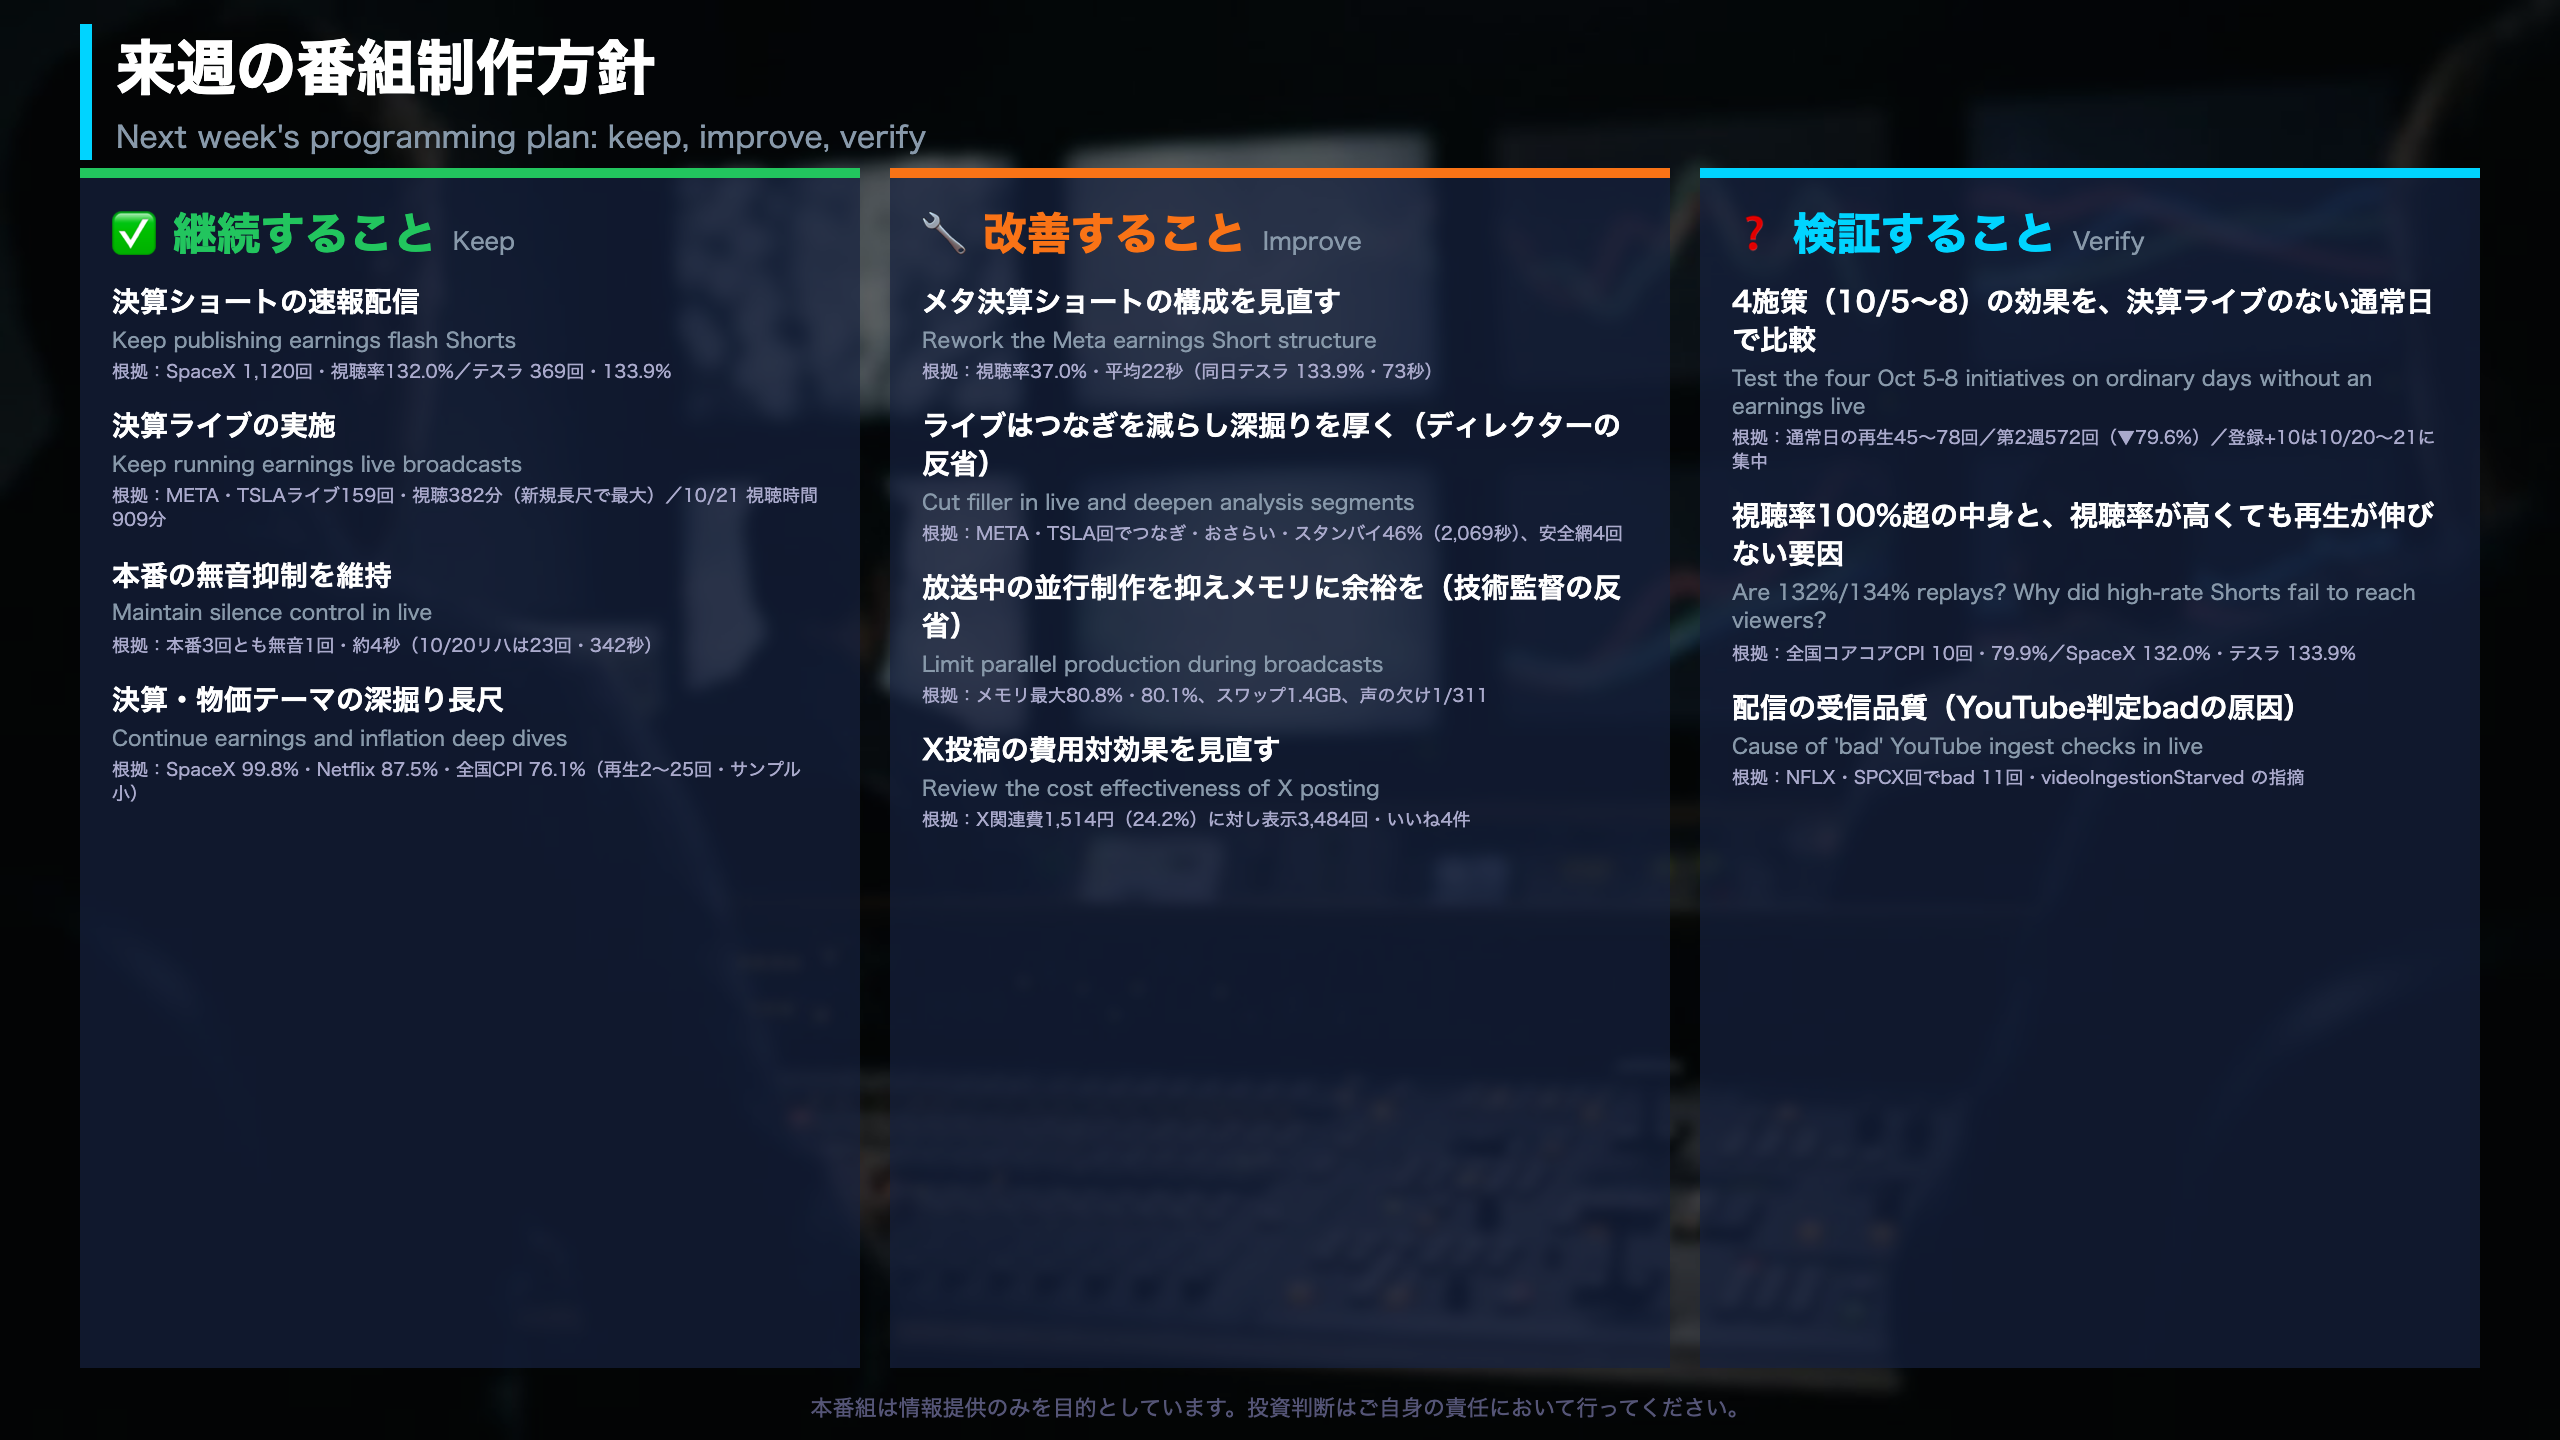
Next week’s action plan
✅ Keep doing
- Earnings flash Shorts: SpaceX (1,120 views, 132.0% view rate) and Tesla (369 views, 133.9%).
- Earnings live broadcasts: the Meta/Tesla live drew 159 views and 382 minutes, the top new long-form video, and Oct 21 delivered 909 minutes of watch time.
- Silence control in live: every broadcast had one ~4-second gap, versus 23 gaps (342 s) in the Oct 20 rehearsal.
- Earnings and inflation deep dives: SpaceX 99.8%, Netflix 87.5%, national CPI 76.1% (on only 2-25 views).
🔧 Improve
- Rework the Meta earnings Short: 37.0% view rate and 22-second average watch, versus Tesla’s 133.9% and 73 seconds the same day.
- Cut filler in live and deepen analysis: 46% of the META/TSLA broadcast was filler and the safety net fired four times.
- Limit parallel production during broadcasts: peak memory was 80.8% and 80.1%, swap reached 1.4 GB, and one of 311 utterances dropped.
- Review X posting efficiency: JPY 1,514 (24.2% of cost) bought 3,484 impressions and 4 likes.
❓ Verify
- Effect of the four Oct 5-8 initiatives: compare views and subscriptions on ordinary days without an earnings live. Ordinary days ran 45-78 views, and the +10 subscribers sat on Oct 20-21.
- View rates above 100% and reach: are 132% and 134% replays, and why did the national CPI Short (10 views, 79.9%) fail to reach viewers?
- Stream ingest quality: what caused 11 ‘bad’ YouTube ingest checks in the NFLX/SPCX broadcast?
Not forecasts
These are checklist items drawn from one week of data, not predictions. For readers used to larger channels, the point is to separate event-driven spikes from the underlying baseline, which only repeated like-for-like weeks can show.
Disclaimer: This article is for informational purposes only. All investment decisions are made solely at your own risk.