
📺 Watch the Full Video Analysis
This article was automatically generated by the NFC Market Live AI analysis system. (Updated: 2026-10-21 09:01 JST)
📄 Primary Source
財務省
https://www.customs.go.jp/toukei/shinbun/trade-st/gaiyo2026_09.pdf
📊 A walk-through of Japan’s September trade statistics (preliminary), released by the Ministry of Finance on October 21.
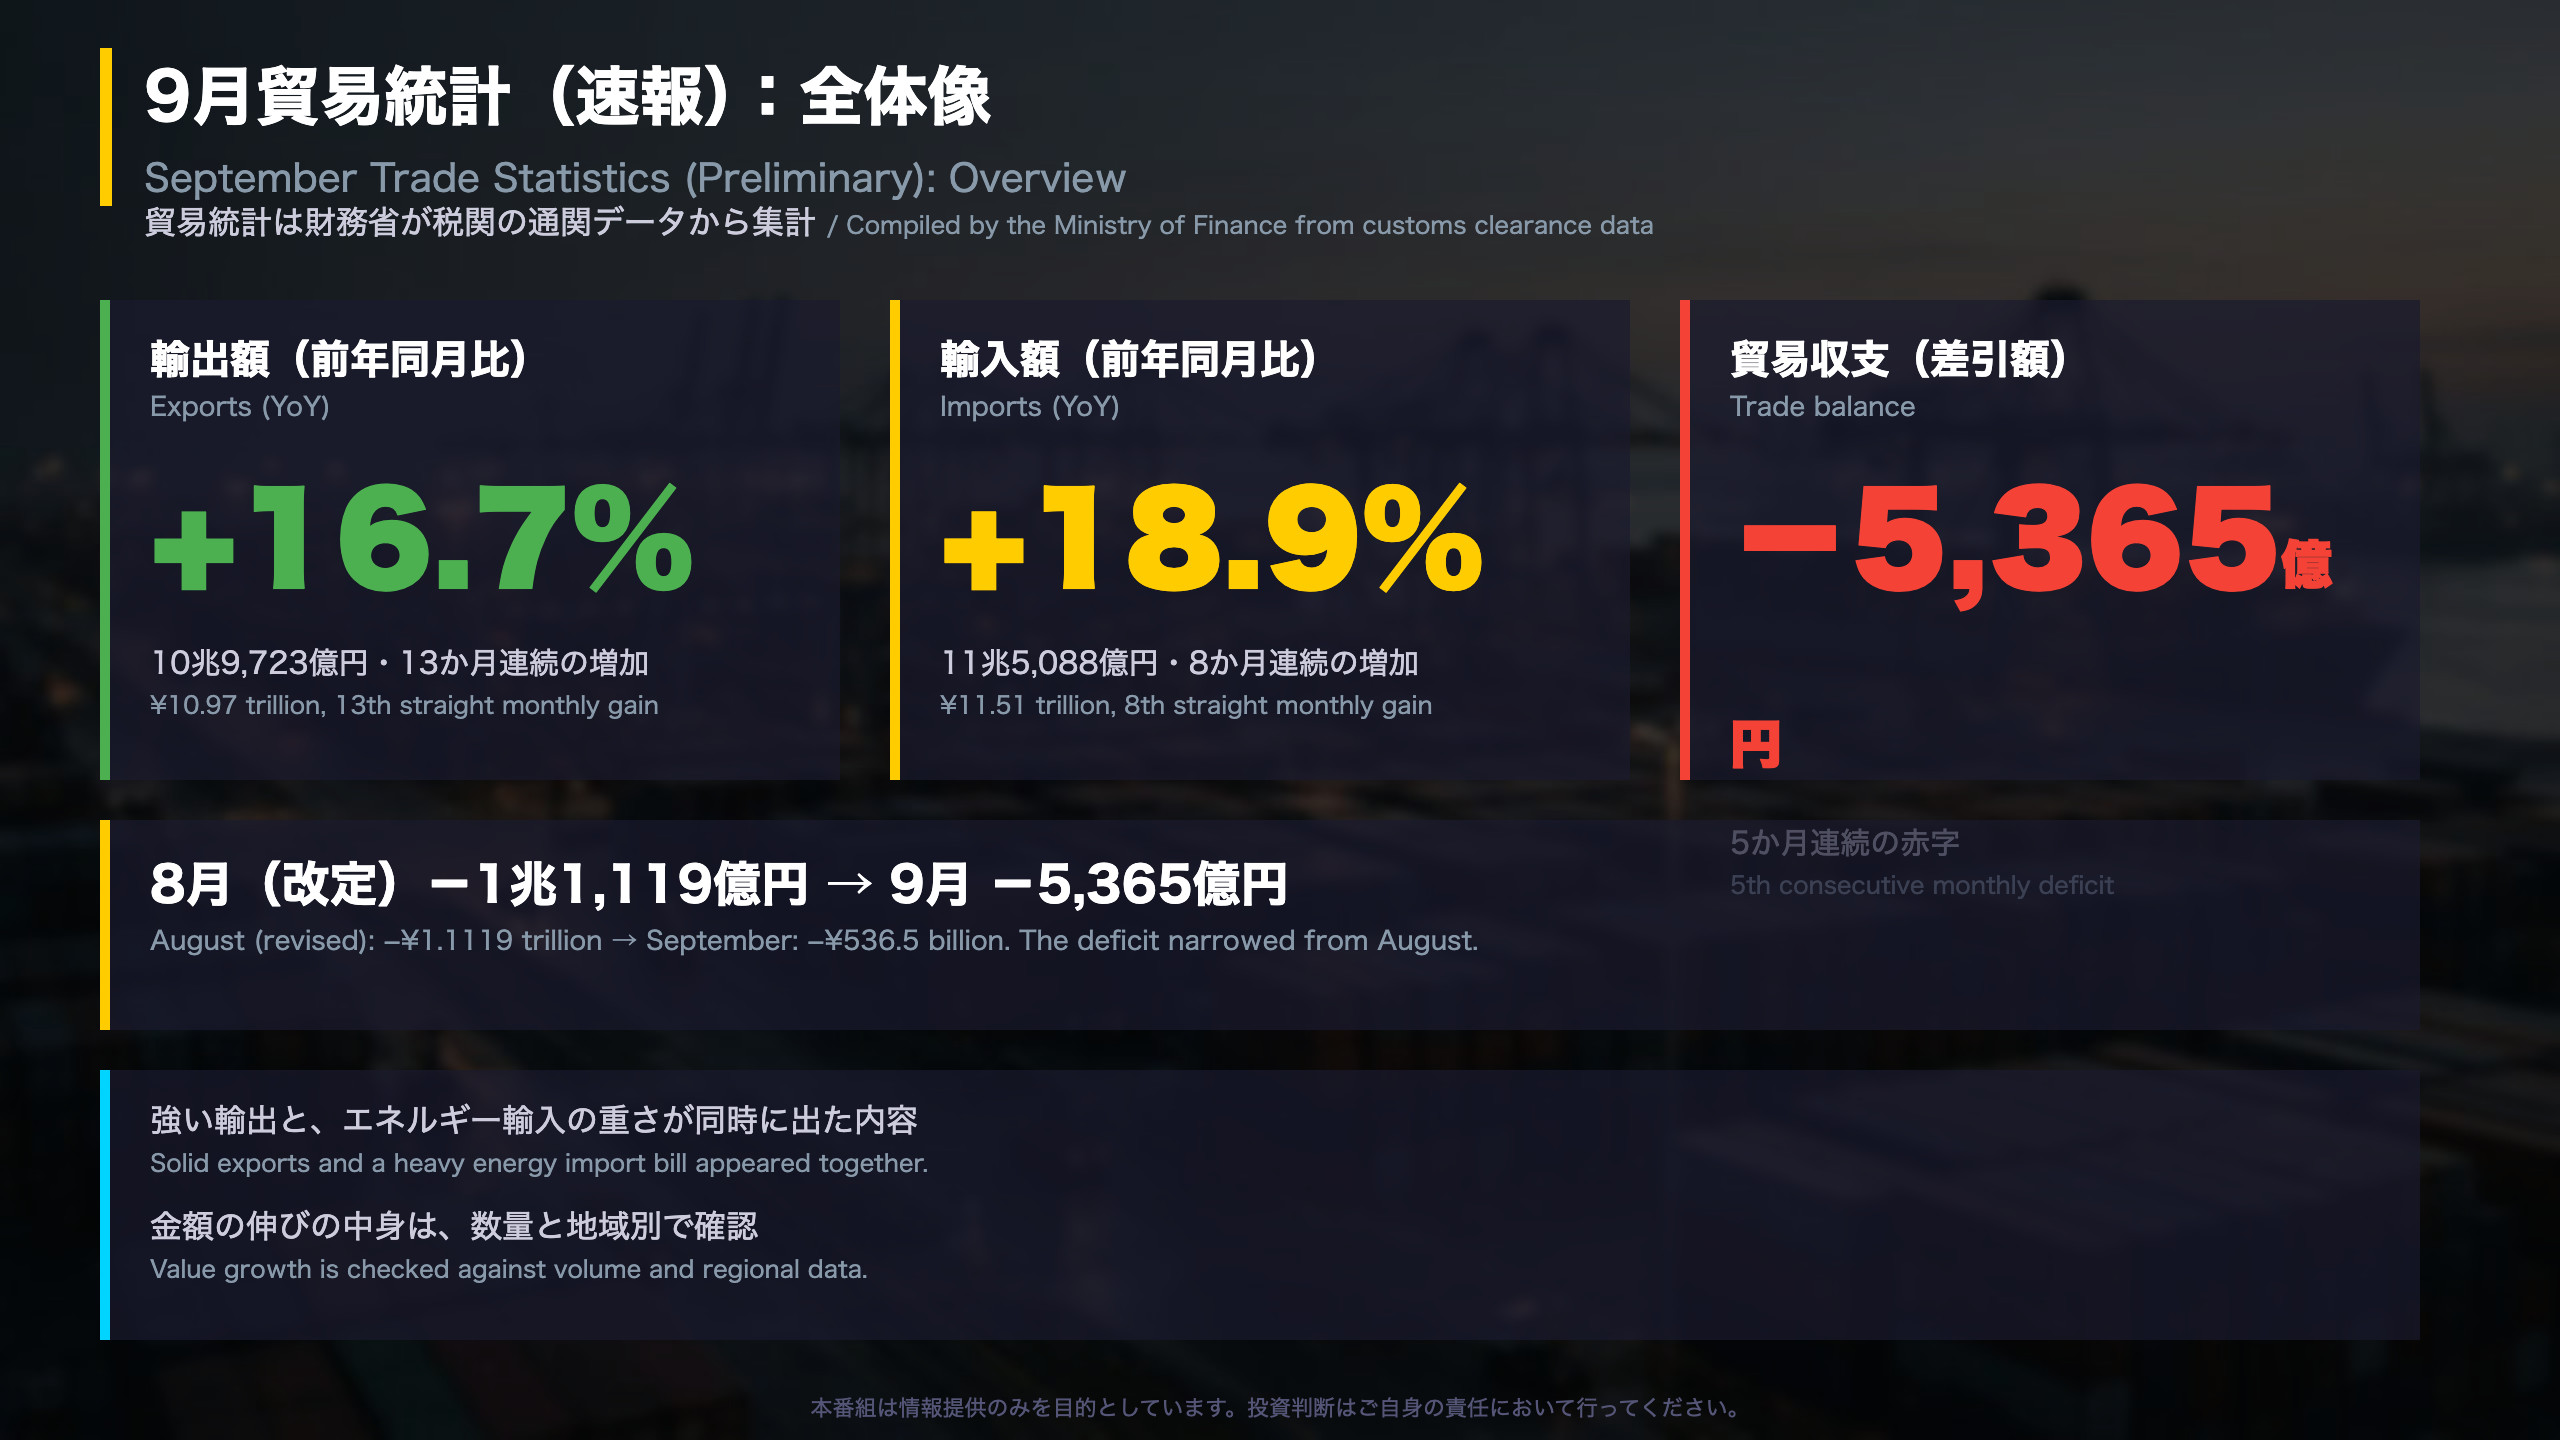
📈 Exports rose 16.7% YoY, the 13th straight monthly gain, led by semiconductor-related parts and autos.
📉 Imports rose 18.9% and the trade deficit was ¥536.5 billion, but it narrowed from August.
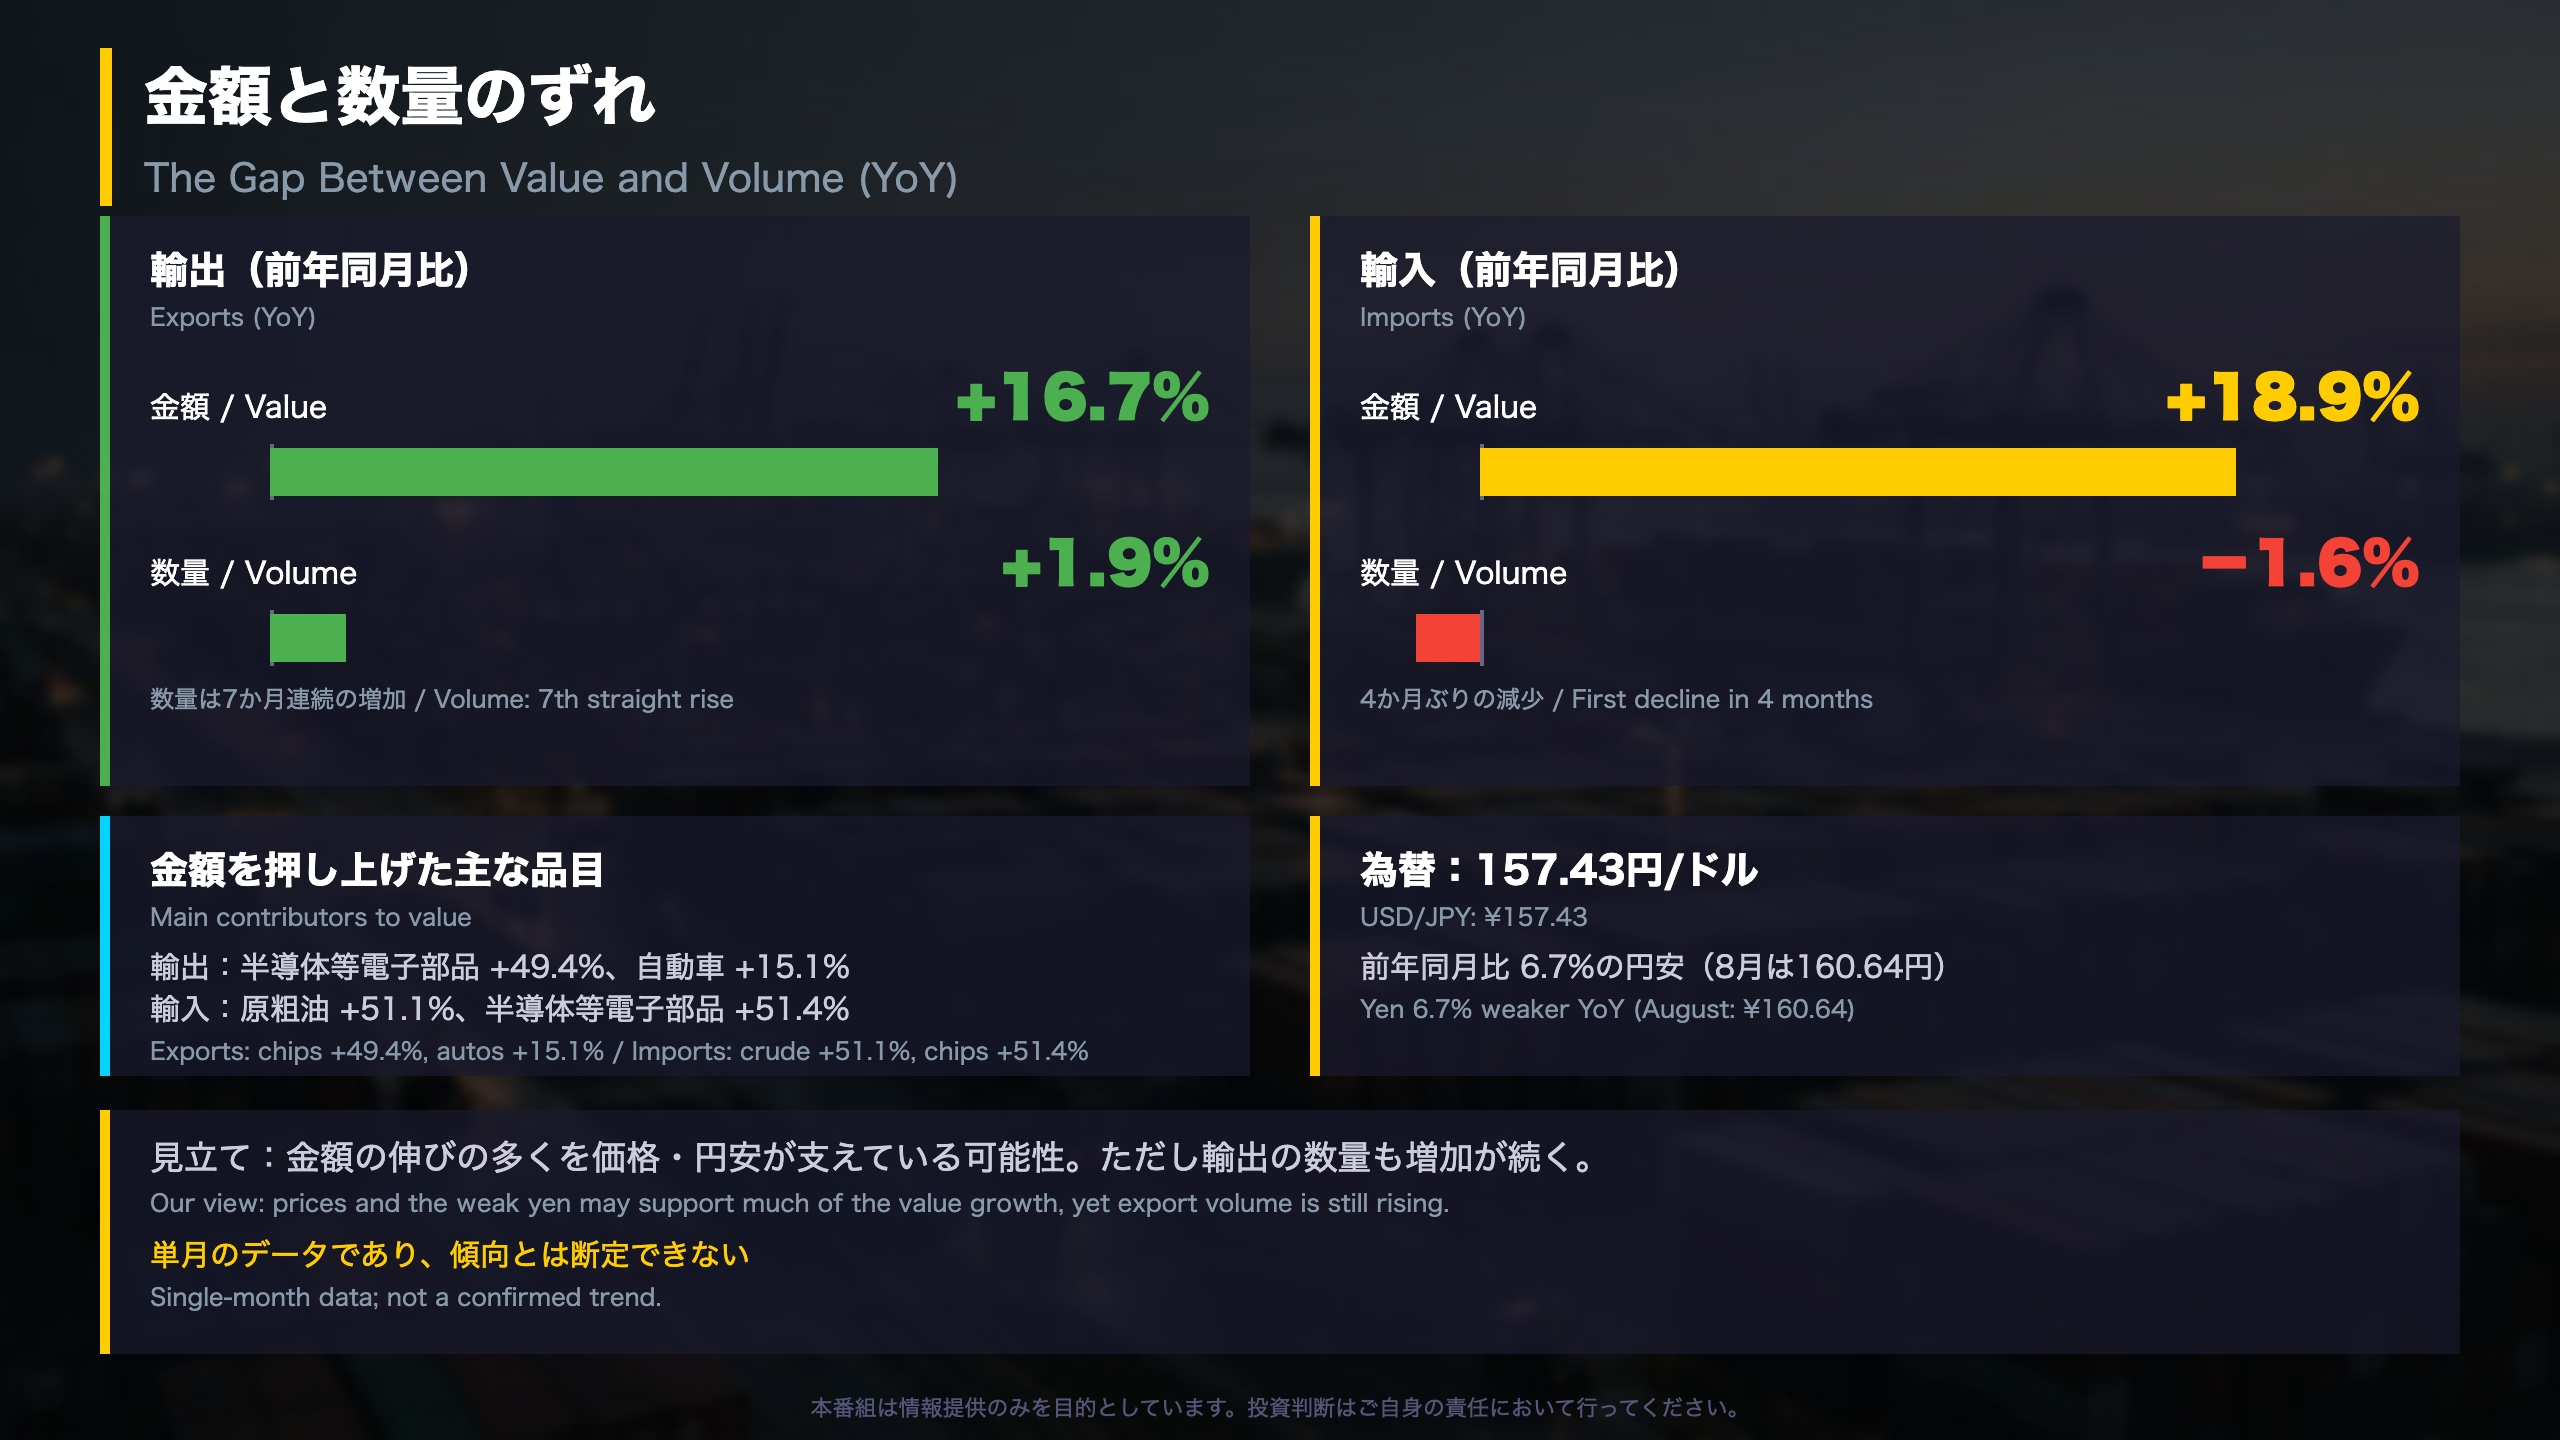
💡 Volume indices: exports +1.9%, imports −1.6%. We review the gap between value and volume, weaker auto shipments to China, and surging US crude imports.
9月貿易統計(速報):全体像
Japan’s September Trade Data: Strong Exports, Heavy Import Bill
What is this report? The preliminary trade statistics are compiled by Japan’s Ministry of Finance (MOF) from customs clearance records. They are the closest Japanese counterpart to the US Census Bureau goods trade release, with year-on-year changes as the headline.
Key figures
- Exports: ¥10.97 trillion, +16.7% YoY, the 13th straight monthly increase
- Imports: ¥11.51 trillion, +18.9% YoY, the 8th straight increase
- Trade balance: −¥536.5 billion, the 5th consecutive monthly deficit
- Volume indices: exports +1.9%, imports −1.6%
Context
The MOF said exports were led by “semiconductor-related electronic parts” and autos, and imports by crude oil and chips. Exports ranked 3rd on record and 1st for any September in data since 1979, while the deficit ranks 496th of 573 months, versus 548th in August.
Why it matters
Trade flows feed Japan’s current account and the real-economy supply and demand for yen. The yen averaged ¥157.43 per dollar, versus ¥160.64 in August. This report alone does not indicate future Bank of Japan policy or exchange-rate moves.
Balanced read
Seasonally adjusted, exports (−1.1% MoM) and imports (−1.9%) both slipped, so one month should not be over-read. Still, 13 months of export growth is a solid run.
金額と数量のずれ
Value vs. Volume: Reading Japan’s Trade Data
Why the distinction matters. Japan’s MOF publishes both a value series (yen amounts) and a volume index. The volume index strips out price and exchange-rate effects, much like the real (chained-dollar) series in US trade data. When value grows faster than volume, prices or the currency are doing part of the work.
August to September
| Item | August | September |
|---|---|---|
| Export value (YoY) | +19.3% | +16.7% |
| Export volume index | 94.5 (+2.5%) | 105.9 (+1.9%) |
| Import value (YoY) | +28.0% | +18.9% |
| Import volume index | 97.2 (+2.7%) | 103.0 (−1.6%) |
| USD/JPY | ¥160.64 | ¥157.43 |
Top contributors
- Exports: semiconductor-related parts +49.4% (contribution 3.3 pts), autos +15.1% (2.4), chip-making equipment +43.9% (1.8)
- Imports: crude oil +51.1% (3.9), semiconductor parts +51.4% (2.1), LNG +39.2% (1.7)
Two readings
- Constructive: export volume has risen for seven straight months, so growth is not just price. Import value growth slowed from August as the yen’s weakness eased.
- Cautious: the gap between value and volume suggests prices and the weak yen may account for much of the headline. Imports rose in value despite lower volume, which implies a heavy cost burden, especially for energy.
This is one month of data, so it is a reading rather than a confirmed trend.
地域別:中国向けと米国
Regional Breakdown: China, the US, the EU and Asia
Context. Japan’s MOF reports trade by region, which helps separate global demand effects from country-specific ones. Here the regional picture shows China and the US moving in different directions.
September snapshot
| Region | Exports (YoY) | Imports (YoY) | Balance |
|---|---|---|---|
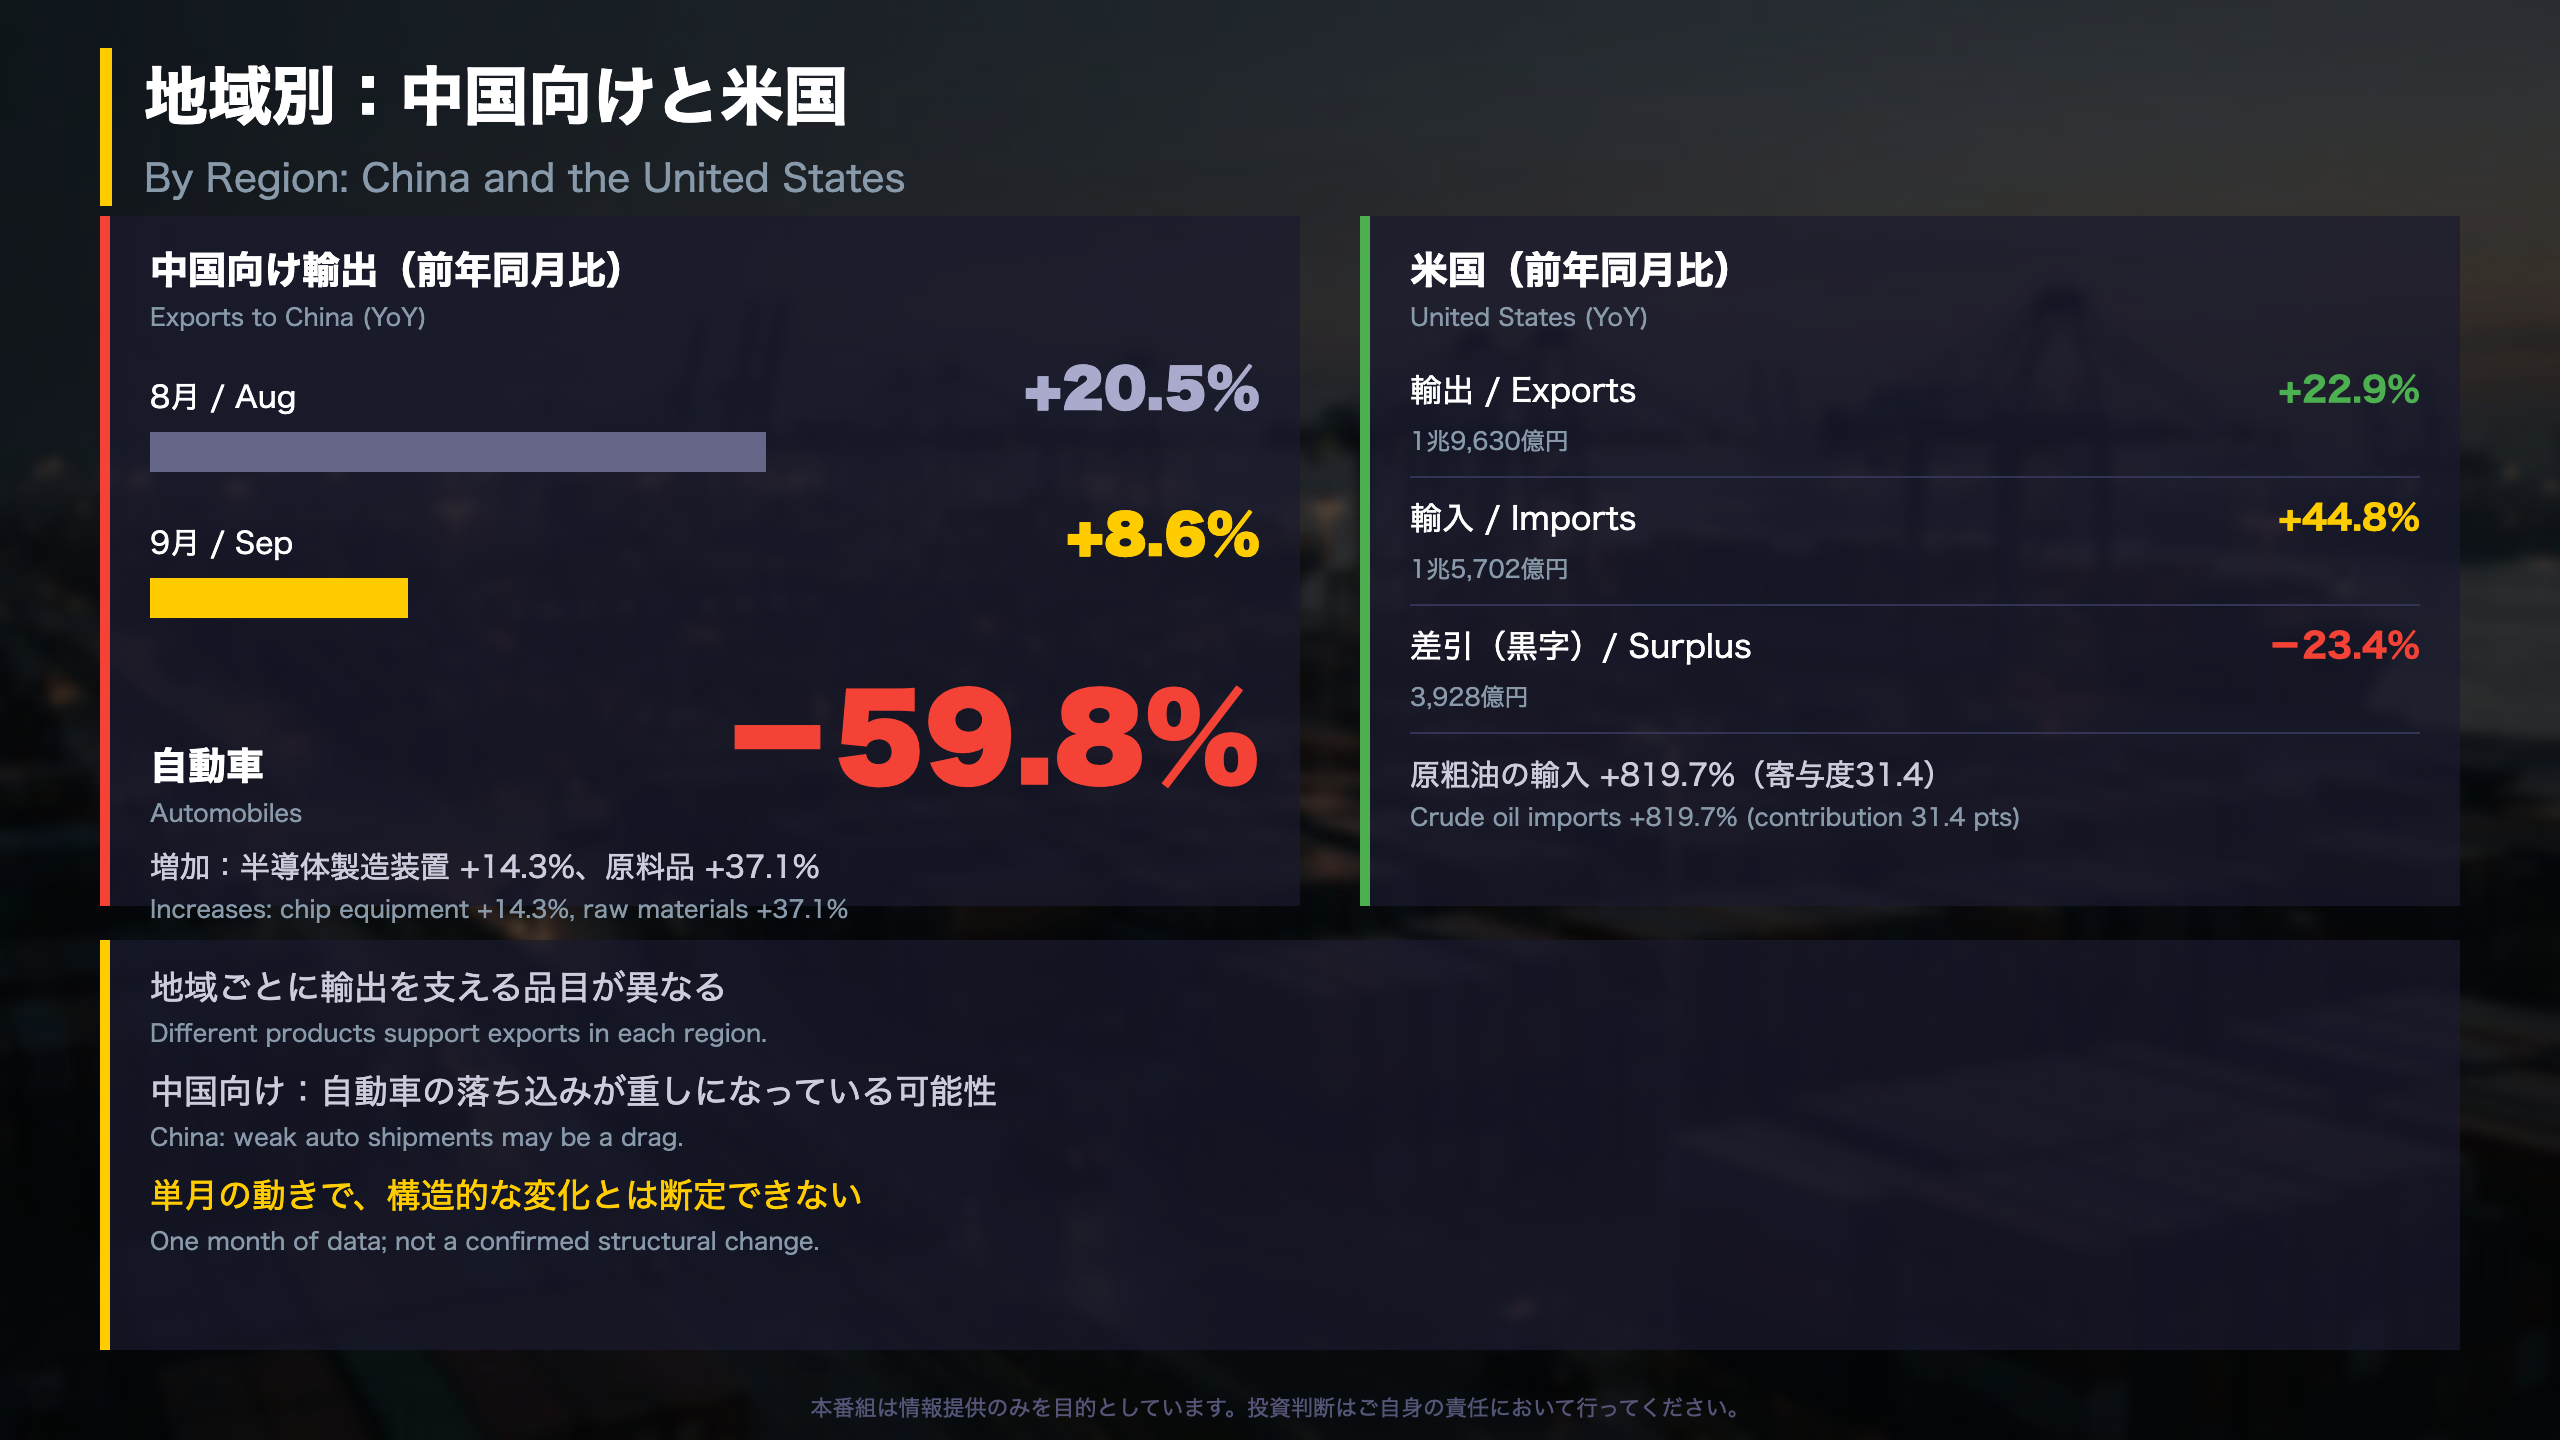
| US | ¥1.963 tn (+22.9%) | ¥1.570 tn (+44.8%) | +¥392.8 bn surplus |
| EU | ¥985 bn (+10.5%) | ¥1.126 tn (−0.1%) | −¥140.9 bn |
| Asia | ¥6.074 tn (+17.5%) | ¥6.027 tn (+22.2%) | +¥47.1 bn surplus |
| China | ¥1.730 tn (+8.6%) | ¥2.757 tn (+16.4%) | −¥1.027 tn |
China
Export growth slowed from +20.5% in August to +8.6%. Autos fell 59.8% (contribution −3.5 pts), while chip-making equipment (+14.3%) and raw materials (+37.1%) rose. The deficit with China widened from ¥552.1 billion in August to ¥1.027 trillion, the 66th straight monthly deficit.
United States
Exports of autos rose 31.0% (contribution 7.1 pts), while crude oil imports jumped 819.7% (contribution 31.4 pts). The US surplus rebounded from about ¥70 billion in August to ¥392.8 billion but is still 23.4% below a year earlier.
Two readings
- Constructive: exports to every region listed rose from a year earlier.
- Cautious: weak autos to China and a wider China deficit are headwinds, but one month does not establish a structural shift.
質疑で深める
Q&A Recap and What to Watch Next
Background. Japan’s trade data are headline-driven by yen weakness and commodity prices, so analysts often check volume indices, as US analysts check real trade series. The questions below follow that logic.
Three questions
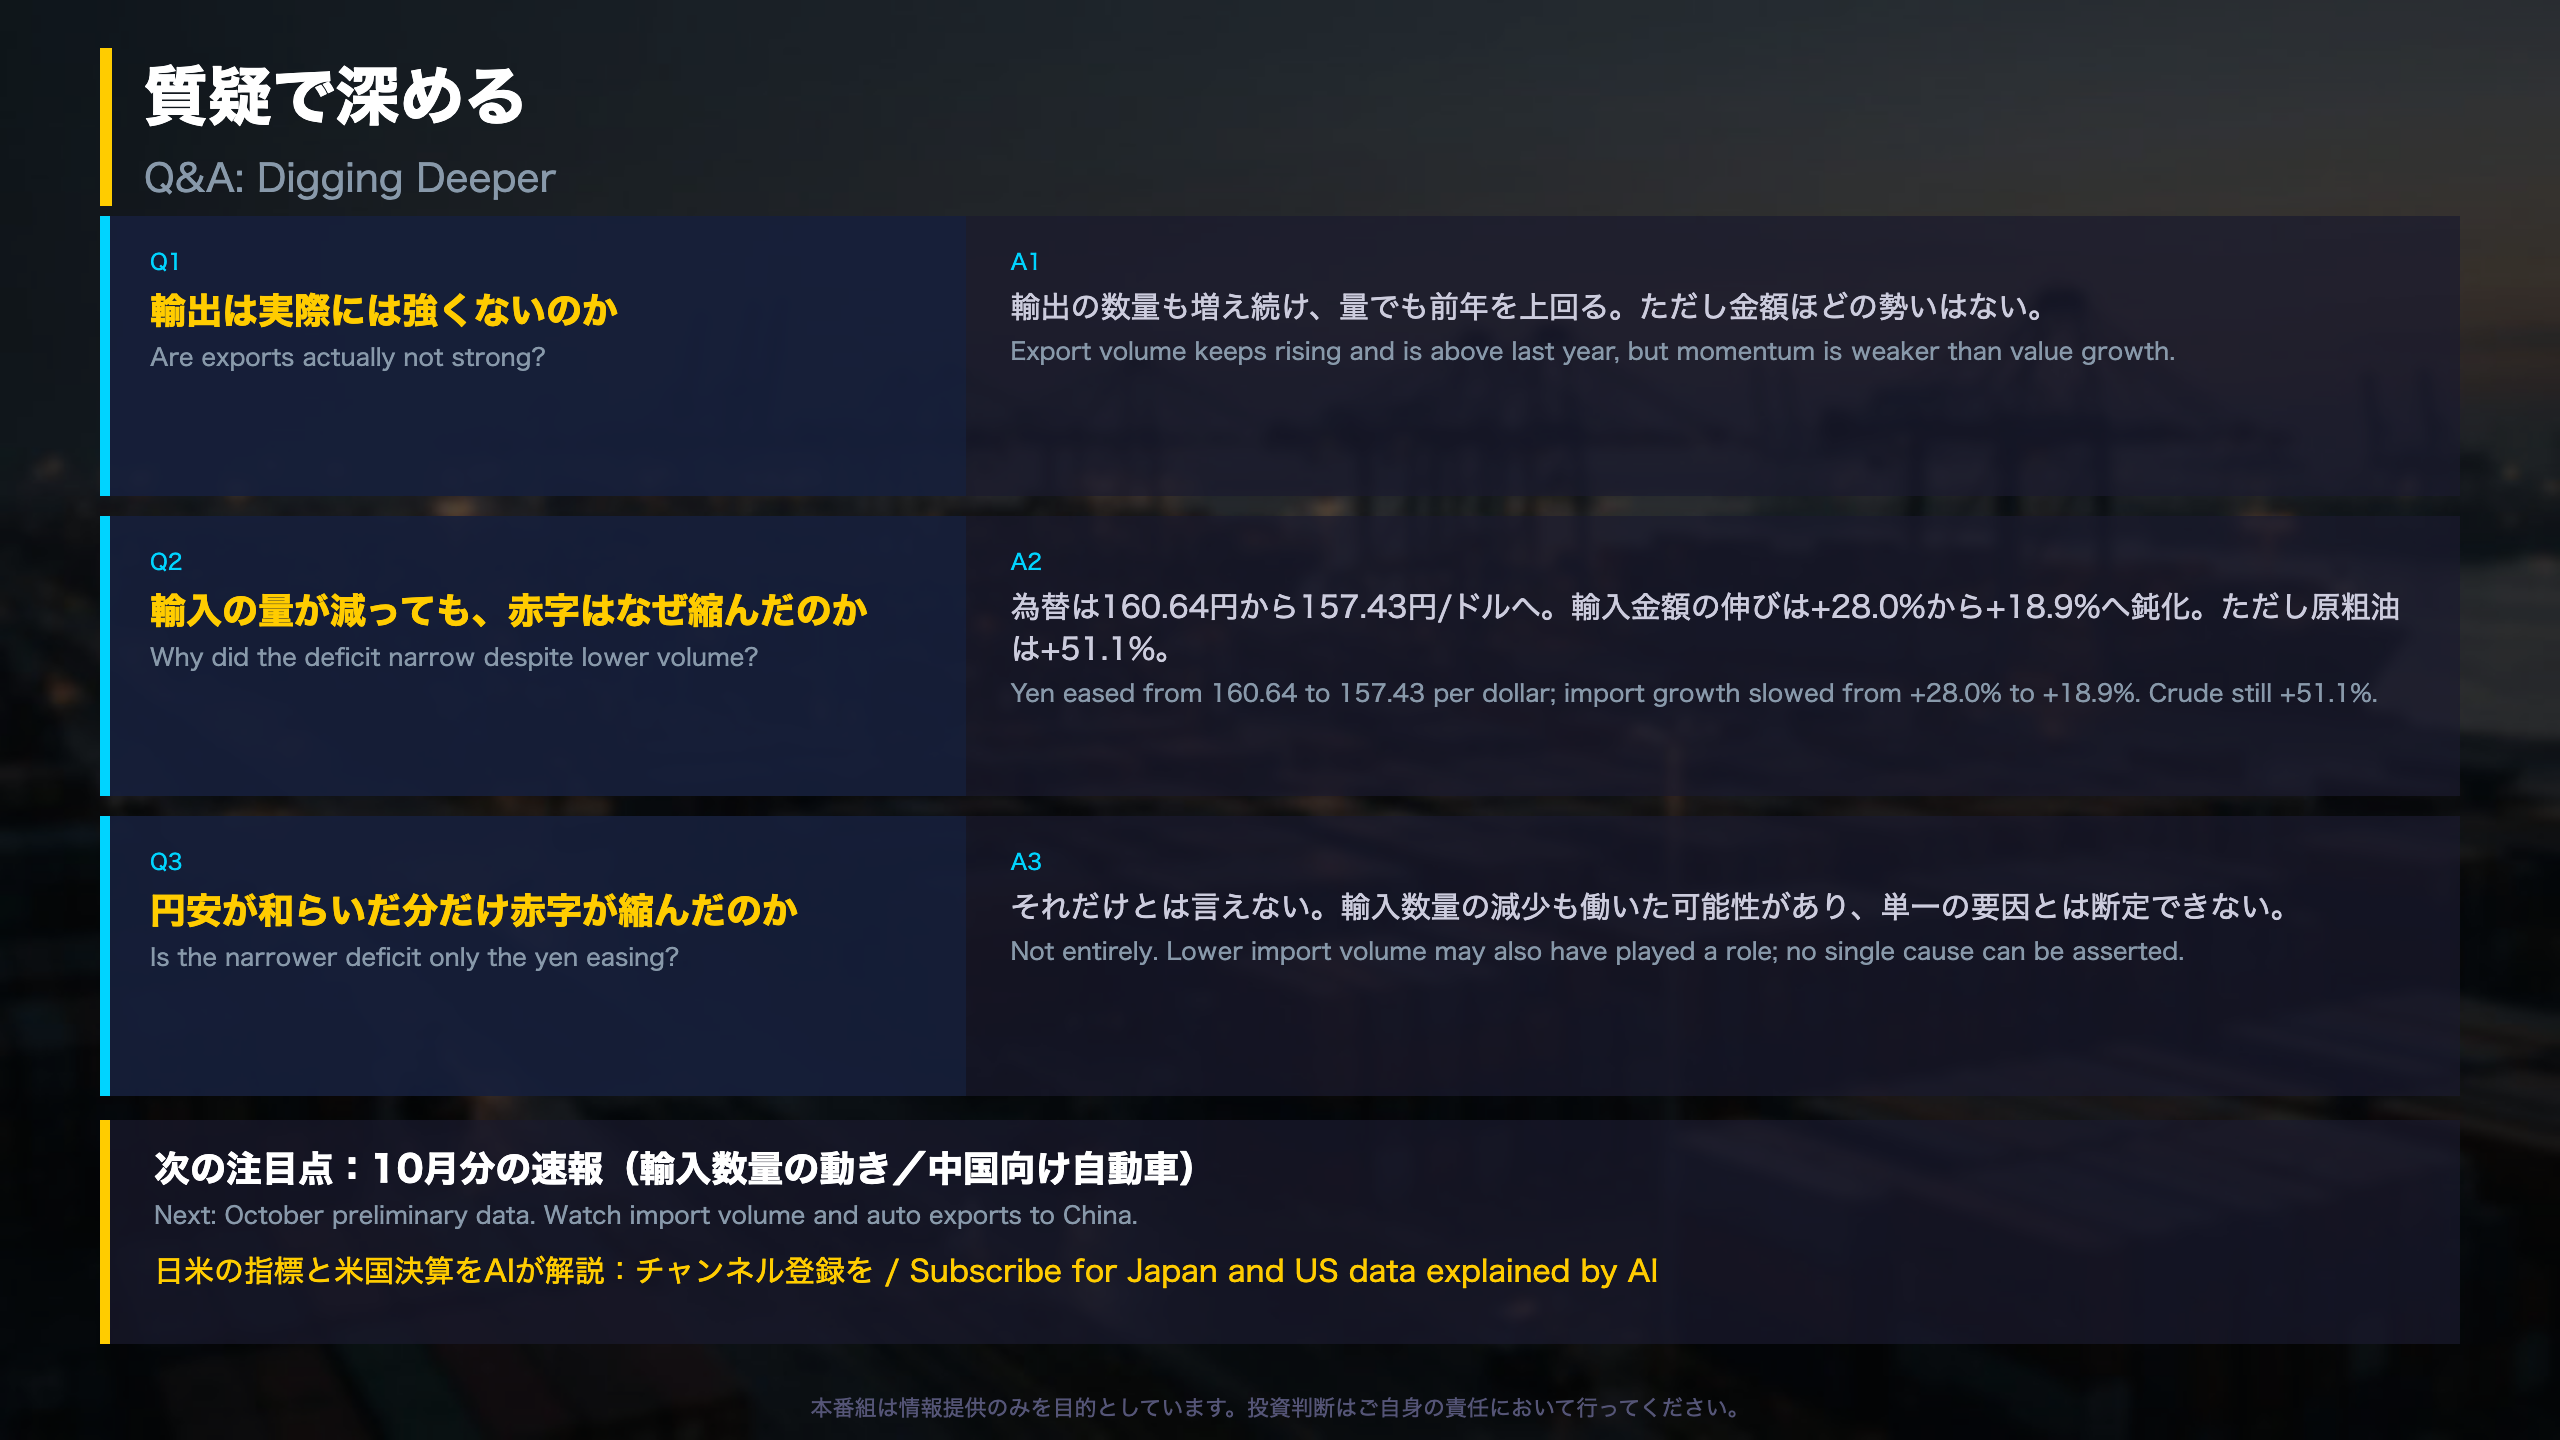
- Are exports weak? Not on volume: the export volume index rose 1.9% YoY, its 7th straight gain. Momentum is weaker than the +16.7% value growth implies.
- Why did the deficit narrow? USD/JPY eased from ¥160.64 to ¥157.43, and import value growth slowed from +28.0% to +18.9%. Crude oil imports were still up 51.1% (contribution 3.9 pts).
- Is it just the yen? Not entirely. Import volume fell 1.6%, which may also have contributed, so no single cause can be asserted.
Data quality notes
Preliminary figures are revised. The August balance was reported at −¥1.1056 trillion last month and now appears at −¥1.1119 trillion. The September deficit ranks 496th among 573 months of data since 1979, so the level remains large.
Balanced view
- Constructive: 13 straight months of export gains and a narrower deficit than August.
- Cautious: seasonally adjusted exports and imports both fell month on month, and the deficit has now lasted five months.
Next
The October preliminary release will show whether import volume keeps falling and whether auto exports to China recover. The release date is not stated in the source.
Disclaimer: This article is for informational purposes only. All investment decisions are made solely at your own risk.