📺 Watch the Full Video Analysis
This article was automatically generated by the NFC Market Live AI analysis system. (Updated: 2026-10-18 10:13 JST)
📊 NFC Weekly Programming Review (Oct 11-17)
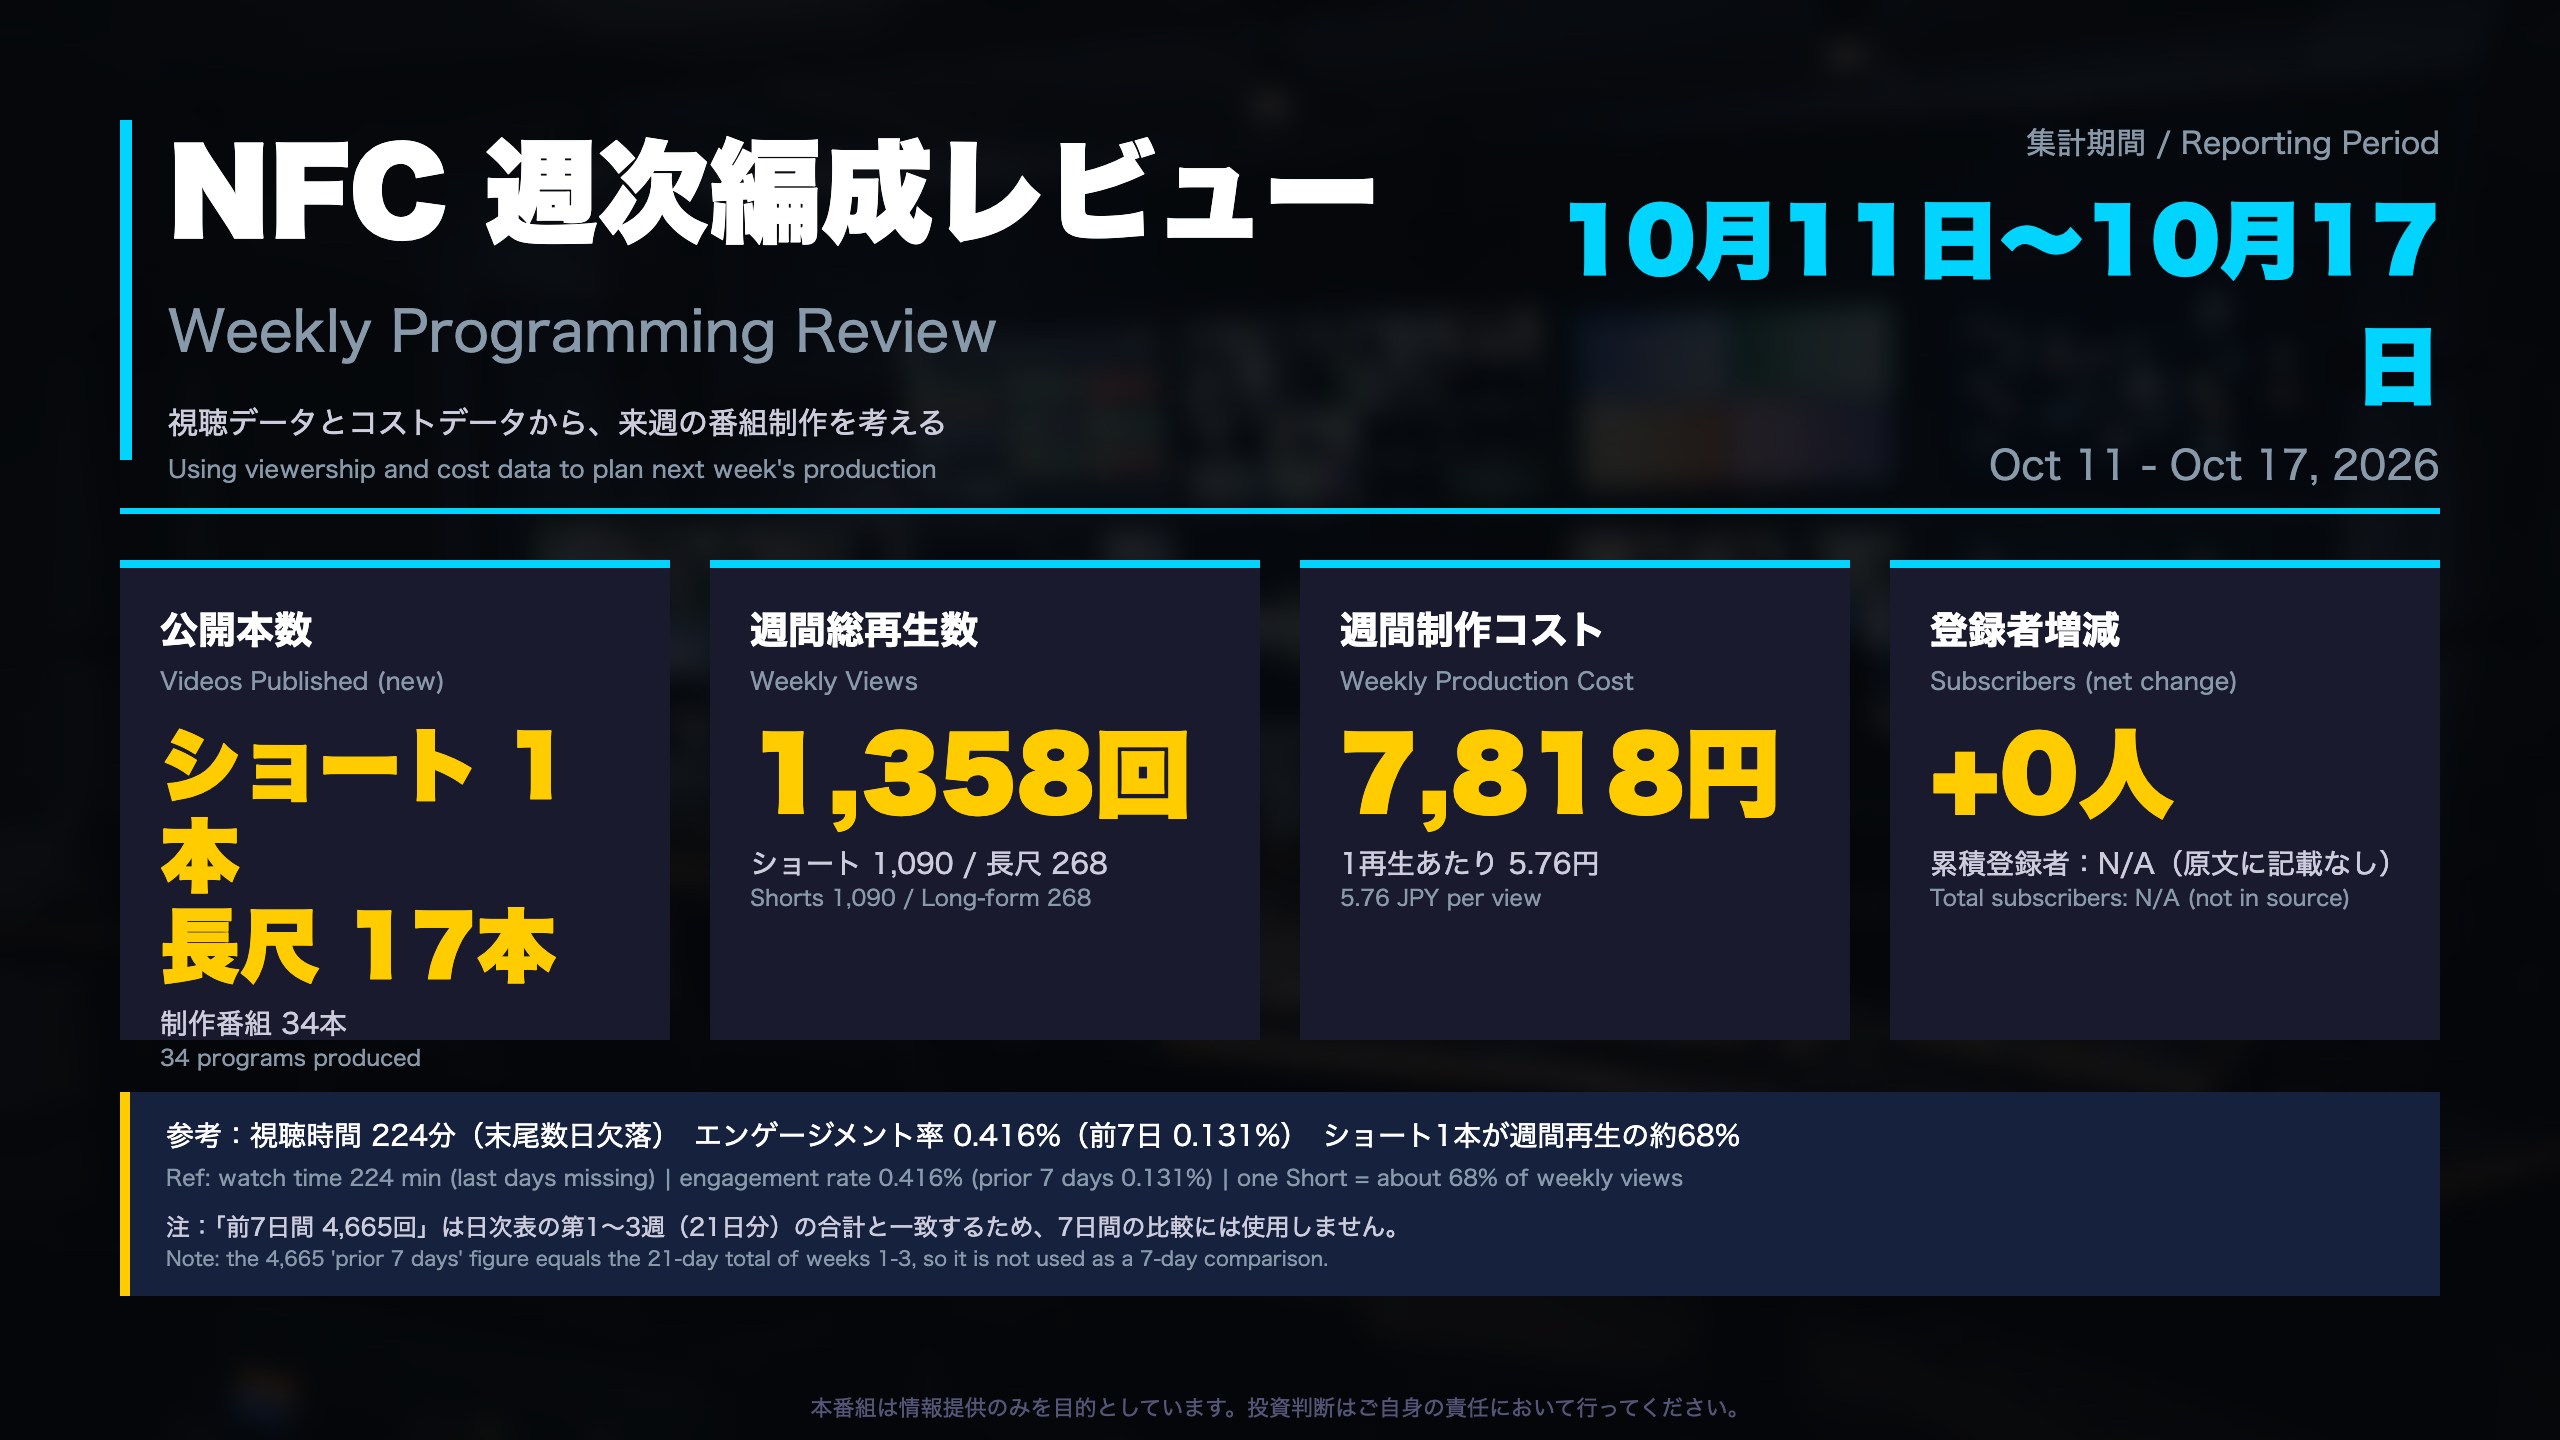
We produced 34 programs. One Short on the September US CPI took 921 of 1,358 weekly views (about 68%) with a 76.5% average view percentage.
📉 Only one new Short was published. The 17 new long-form videos drew 202 views, and the two live streams held just 2-3% view percentage.
💡 Production cost was 7,818 yen, or 5.76 yen per view (about 17.9 yen excluding that one video, our estimate).
⚠️ Daily data runs only through Oct 15. We cannot yet tell whether the Oct 14 peak reflects our recent changes or CPI’s newsworthiness.
Next week: can the peak be reproduced, and are the four changes working?
オープニング:週次編成レビュー
How to read this week’s numbers
NFC Market Live is an AI-driven channel that explains US and Japanese macro data and major US earnings. This weekly review looks at the channel itself, as a programming desk would.
Data caveats
- The reporting window is Oct 11-17, but the daily channel series ends on Oct 15, so watch time (224 minutes) is approximate.
- The ‘previous 7 days: 4,665 views’ figure equals the sum of weeks 1-3 (21 days) in the daily table, so we do not use it as a week-over-week benchmark.
- Engagement rate was 0.416% versus 0.131% before, but with tiny counts a handful of actions moves it.
Output this week
| Format | New | Tracked | Views |
|---|---|---|---|
| Shorts | 1 | 63 | 1,090 |
| Long-form (public) | 17 | 55 | 260 |
| Long-form (unlisted) | 0 | 4 | 8 |
Unlike a broadcaster’s ratings, YouTube analytics typically lag by about 48 hours, so very recent uploads carry N/A values. The gap between 34 programs produced and one new Short published is the central programming question this week.
今週新規ショート動画 成績リスト
The one new Short, in context
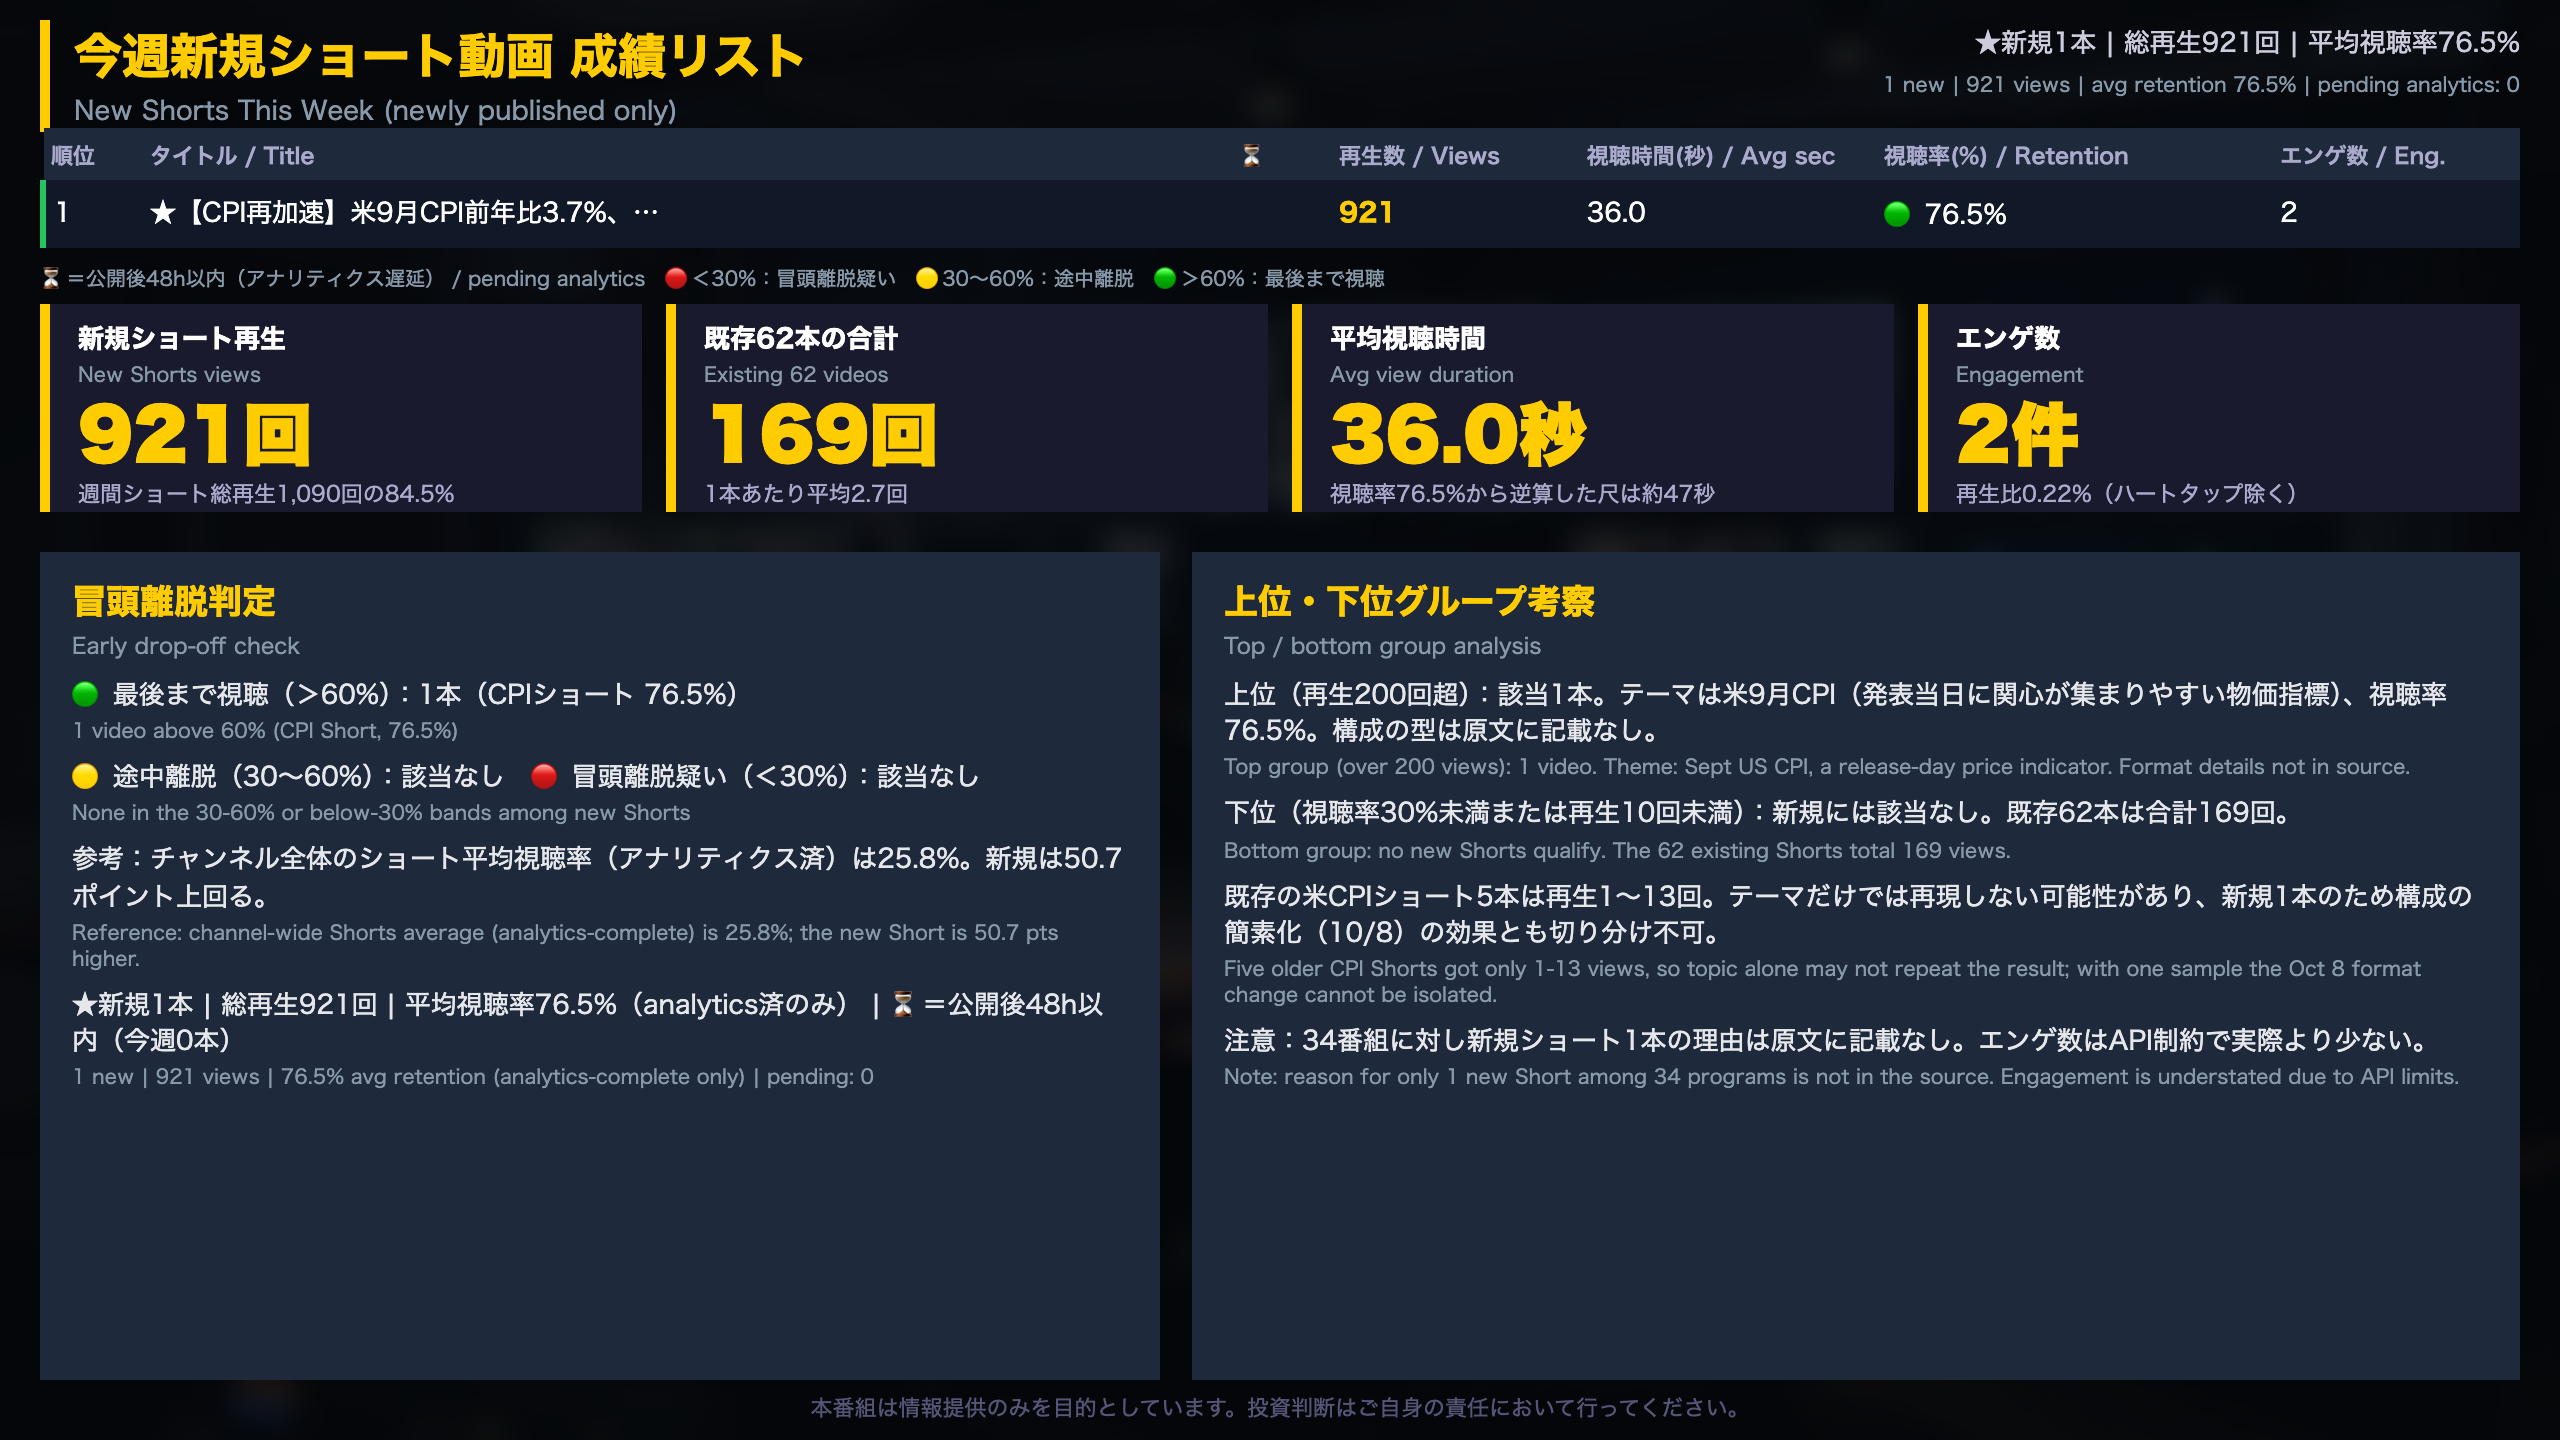
| Metric | Value |
|---|---|
| Views | 921 (84.5% of 1,090 weekly Short views) |
| Avg view duration | 36.0 sec |
| Avg view percentage | 76.5% (implies a runtime of about 47 sec) |
| Engagement | 2 (0.22% of views) |
Earlier CPI Shorts on the same channel
Five older Shorts on US CPI drew only 1 to 13 views each, with view percentages from 0.0% to 49.2%. Publication months differ, so this is not a clean comparison, but it shows the topic alone did not generate 921 views.
About the topic
US CPI comes from the Bureau of Labor Statistics and is among the most watched monthly releases. The video’s title cites a 3.7% year-over-year rise, with gasoline up 9.1%.
Two readings
- Constructive: the Short came after the Oct 8 simplification of our Shorts format, so the 76.5% retention may reflect that change.
- Cautious: with one data point we cannot separate format, release-day timing and algorithmic distribution.
A note on the metric
Some older Shorts show view percentages above 100% (for example 213.2% and 377.5%), which usually means viewers looped the video. Retention above 100% is therefore not directly comparable with a non-looping video.
What we will check next
Whether another release-day Short can reach 60%+ retention and 100+ views.
今週新規長尺動画 成績リスト
Digging into this week’s long-form videos
Implied runtimes versus retention
Dividing average view duration by view percentage gives rough runtimes:
| Video | Retention | Implied length |
|---|---|---|
| Live: weekly preview | 2.0% | about 20 min |
| Live: US CPI (September) | 3.2% | about 35 min |
| BOJ price survey explainer | 11.9% | about 4.3 min |
| JPMorgan earnings explainer | 18.1% | about 4.9 min |
| Money stock explainer | 51.6% | about 4.6 min |
| Energy-led price explainer | 49.6% | about 5.7 min |
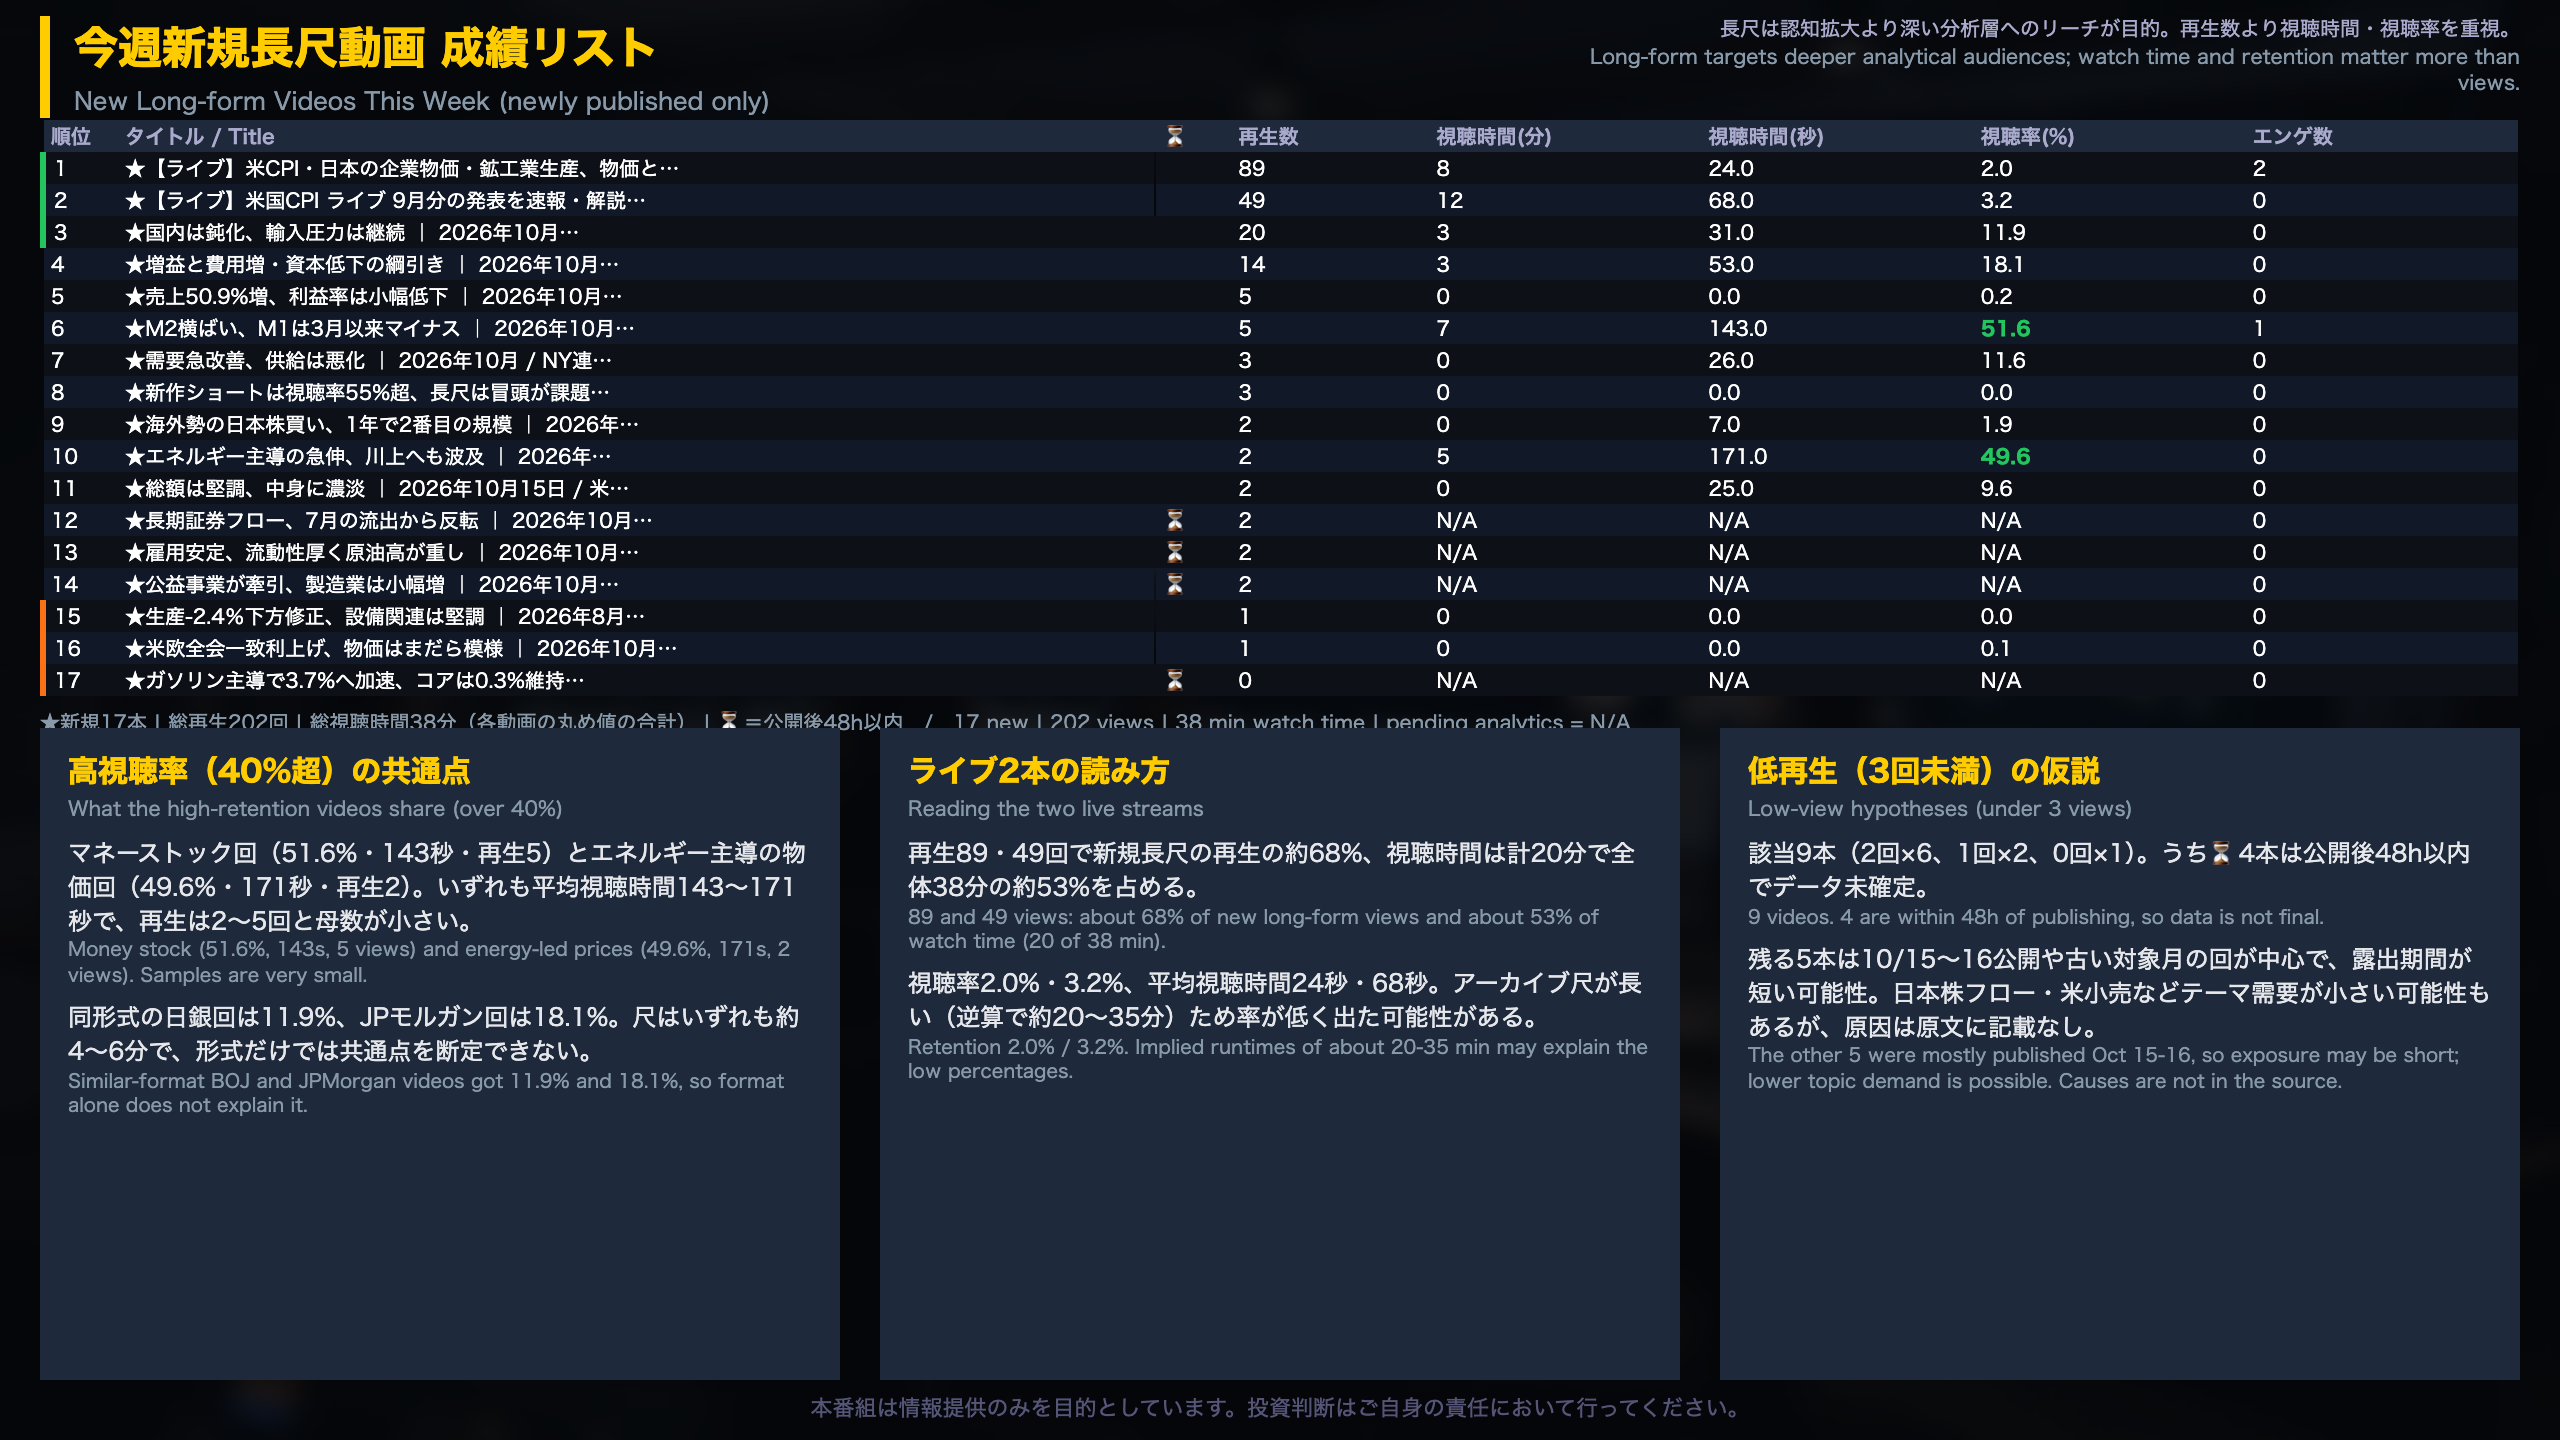
The Deep Dives are all roughly 4-6 minutes, yet retention ranges from 11.9% to 51.6%. Length does not explain the gap; topic and traffic source may.
Reading the live streams
The two live streams account for about 68% of new long-form views and roughly 53% of watch time (20 of 38 minutes). Low percentages are expected for 20-35 minute recordings, much as a full-length broadcast shows lower average-percent-viewed than a short clip.
Context on the topics
The money stock data comes from the Bank of Japan, which tracks M1 and M2, broad measures of money in circulation. The US producer price index is published by the Bureau of Labor Statistics and measures prices at the wholesale stage, which tends to feed into consumer prices later.
Caveat
Five and two views are too few to rank formats. We will re-check the four just-published videos after 48 hours.
28日間 チャンネル成長トレンド
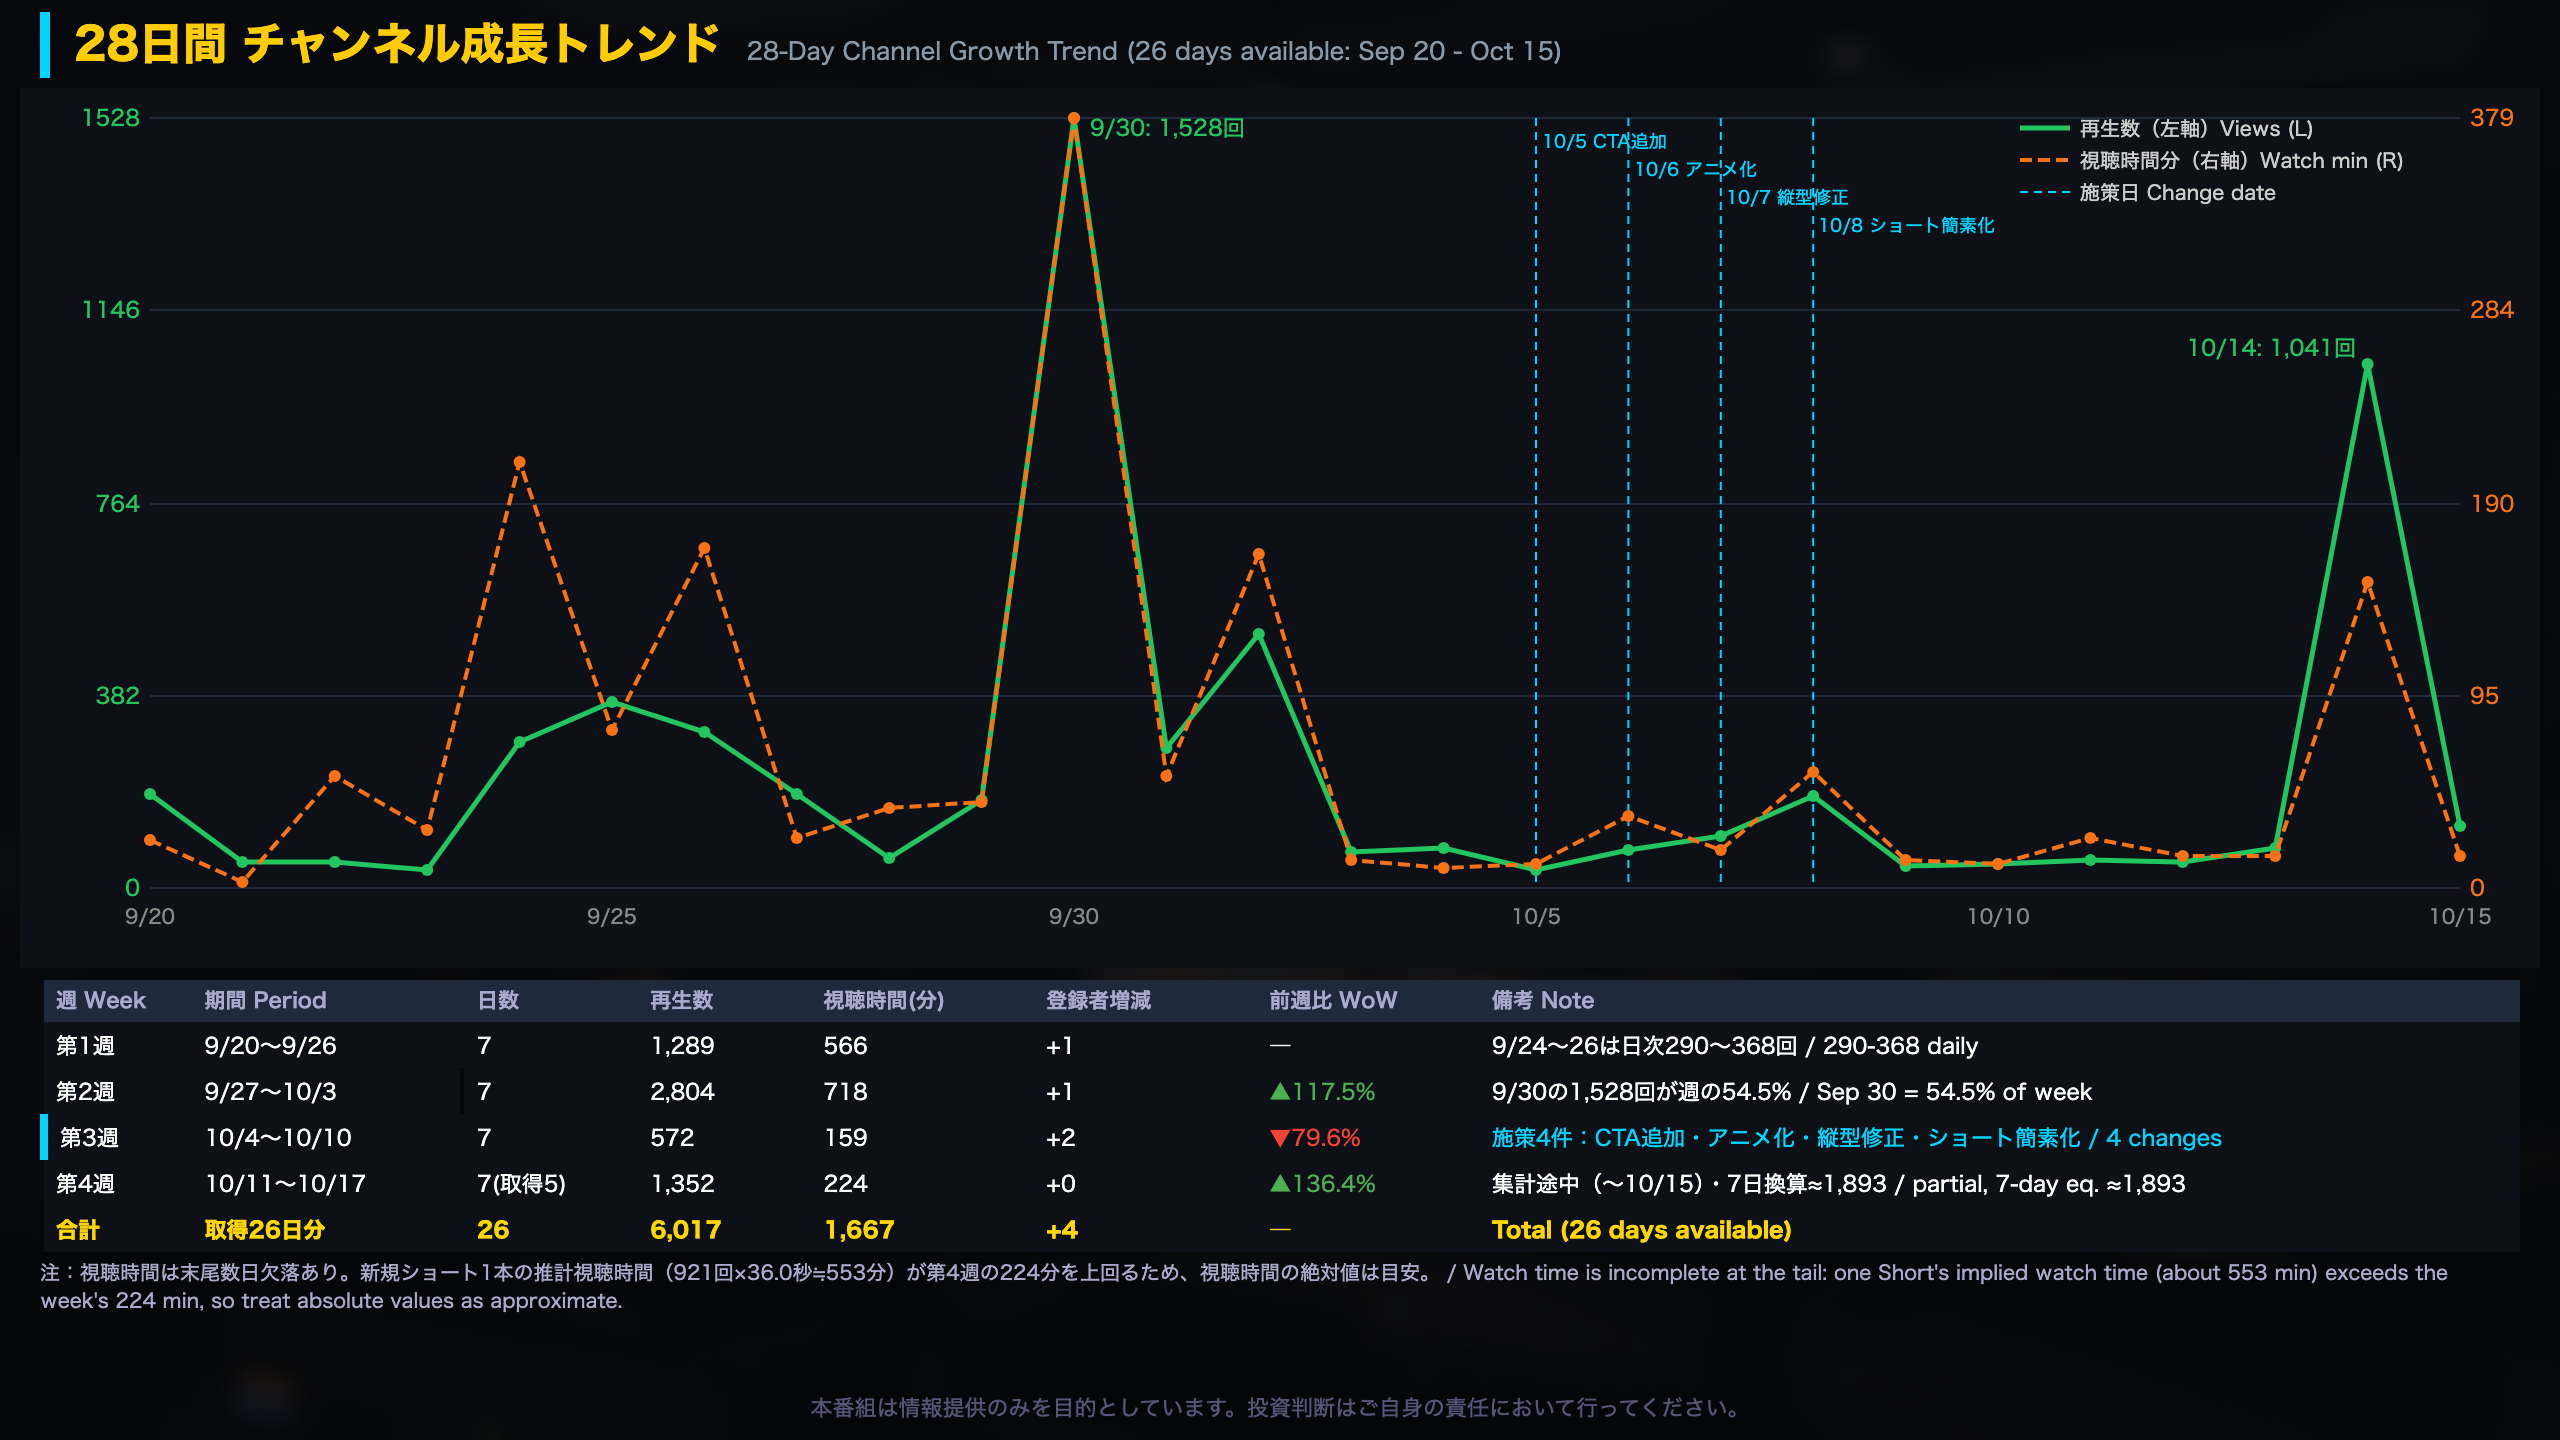
Decomposing the daily series
The baseline without spikes
- Sep 20-29 (before the spike): daily views averaged about 171.
- Oct 3-13 (including the change window): daily views averaged about 75.
Excluding spike days, the baseline is lower than in late September, and weekly totals are dominated by single-day peaks.
Weekly view
| Week | Views | Note |
|---|---|---|
| 1 | 1,289 | 290-368 daily on Sep 24-26 |
| 2 | 2,804 | Sep 30 alone = 54.5% |
| 3 | 572 | Four changes introduced |
| 4 | 1,352 | Oct 14 alone = 77% (data through Oct 15) |
Cross-checking the four changes
Oct 5 added a tailored subscribe call-to-action; Oct 6 introduced animated slides; Oct 7 fixed the vertical-slide layout; Oct 8 simplified the Shorts structure. Oct 8 posted 181 views and 57 watch minutes, the best day in the Oct 3-13 window. Subscriber changes were +2 in week 3 and +0 in week 4, too small to judge anything.
Data quality
One Short’s implied watch time (921 views x 36.0 sec, about 553 minutes) exceeds the week’s reported 224 minutes. Watch-time data is incomplete at the tail, so absolute values are only indicative.
Two readings
Constructive: the peak came after the changes and the Short’s retention was high. Cautious: Oct 14 was US CPI release day, so newsworthiness may be a one-off. Unlike a ratings spike for a scheduled broadcast, a single day cannot show a trend.
What would settle it
Once Oct 16-17 data lands, we will check whether daily views stay above the roughly 75 baseline.
今週の番組制作コスト分析
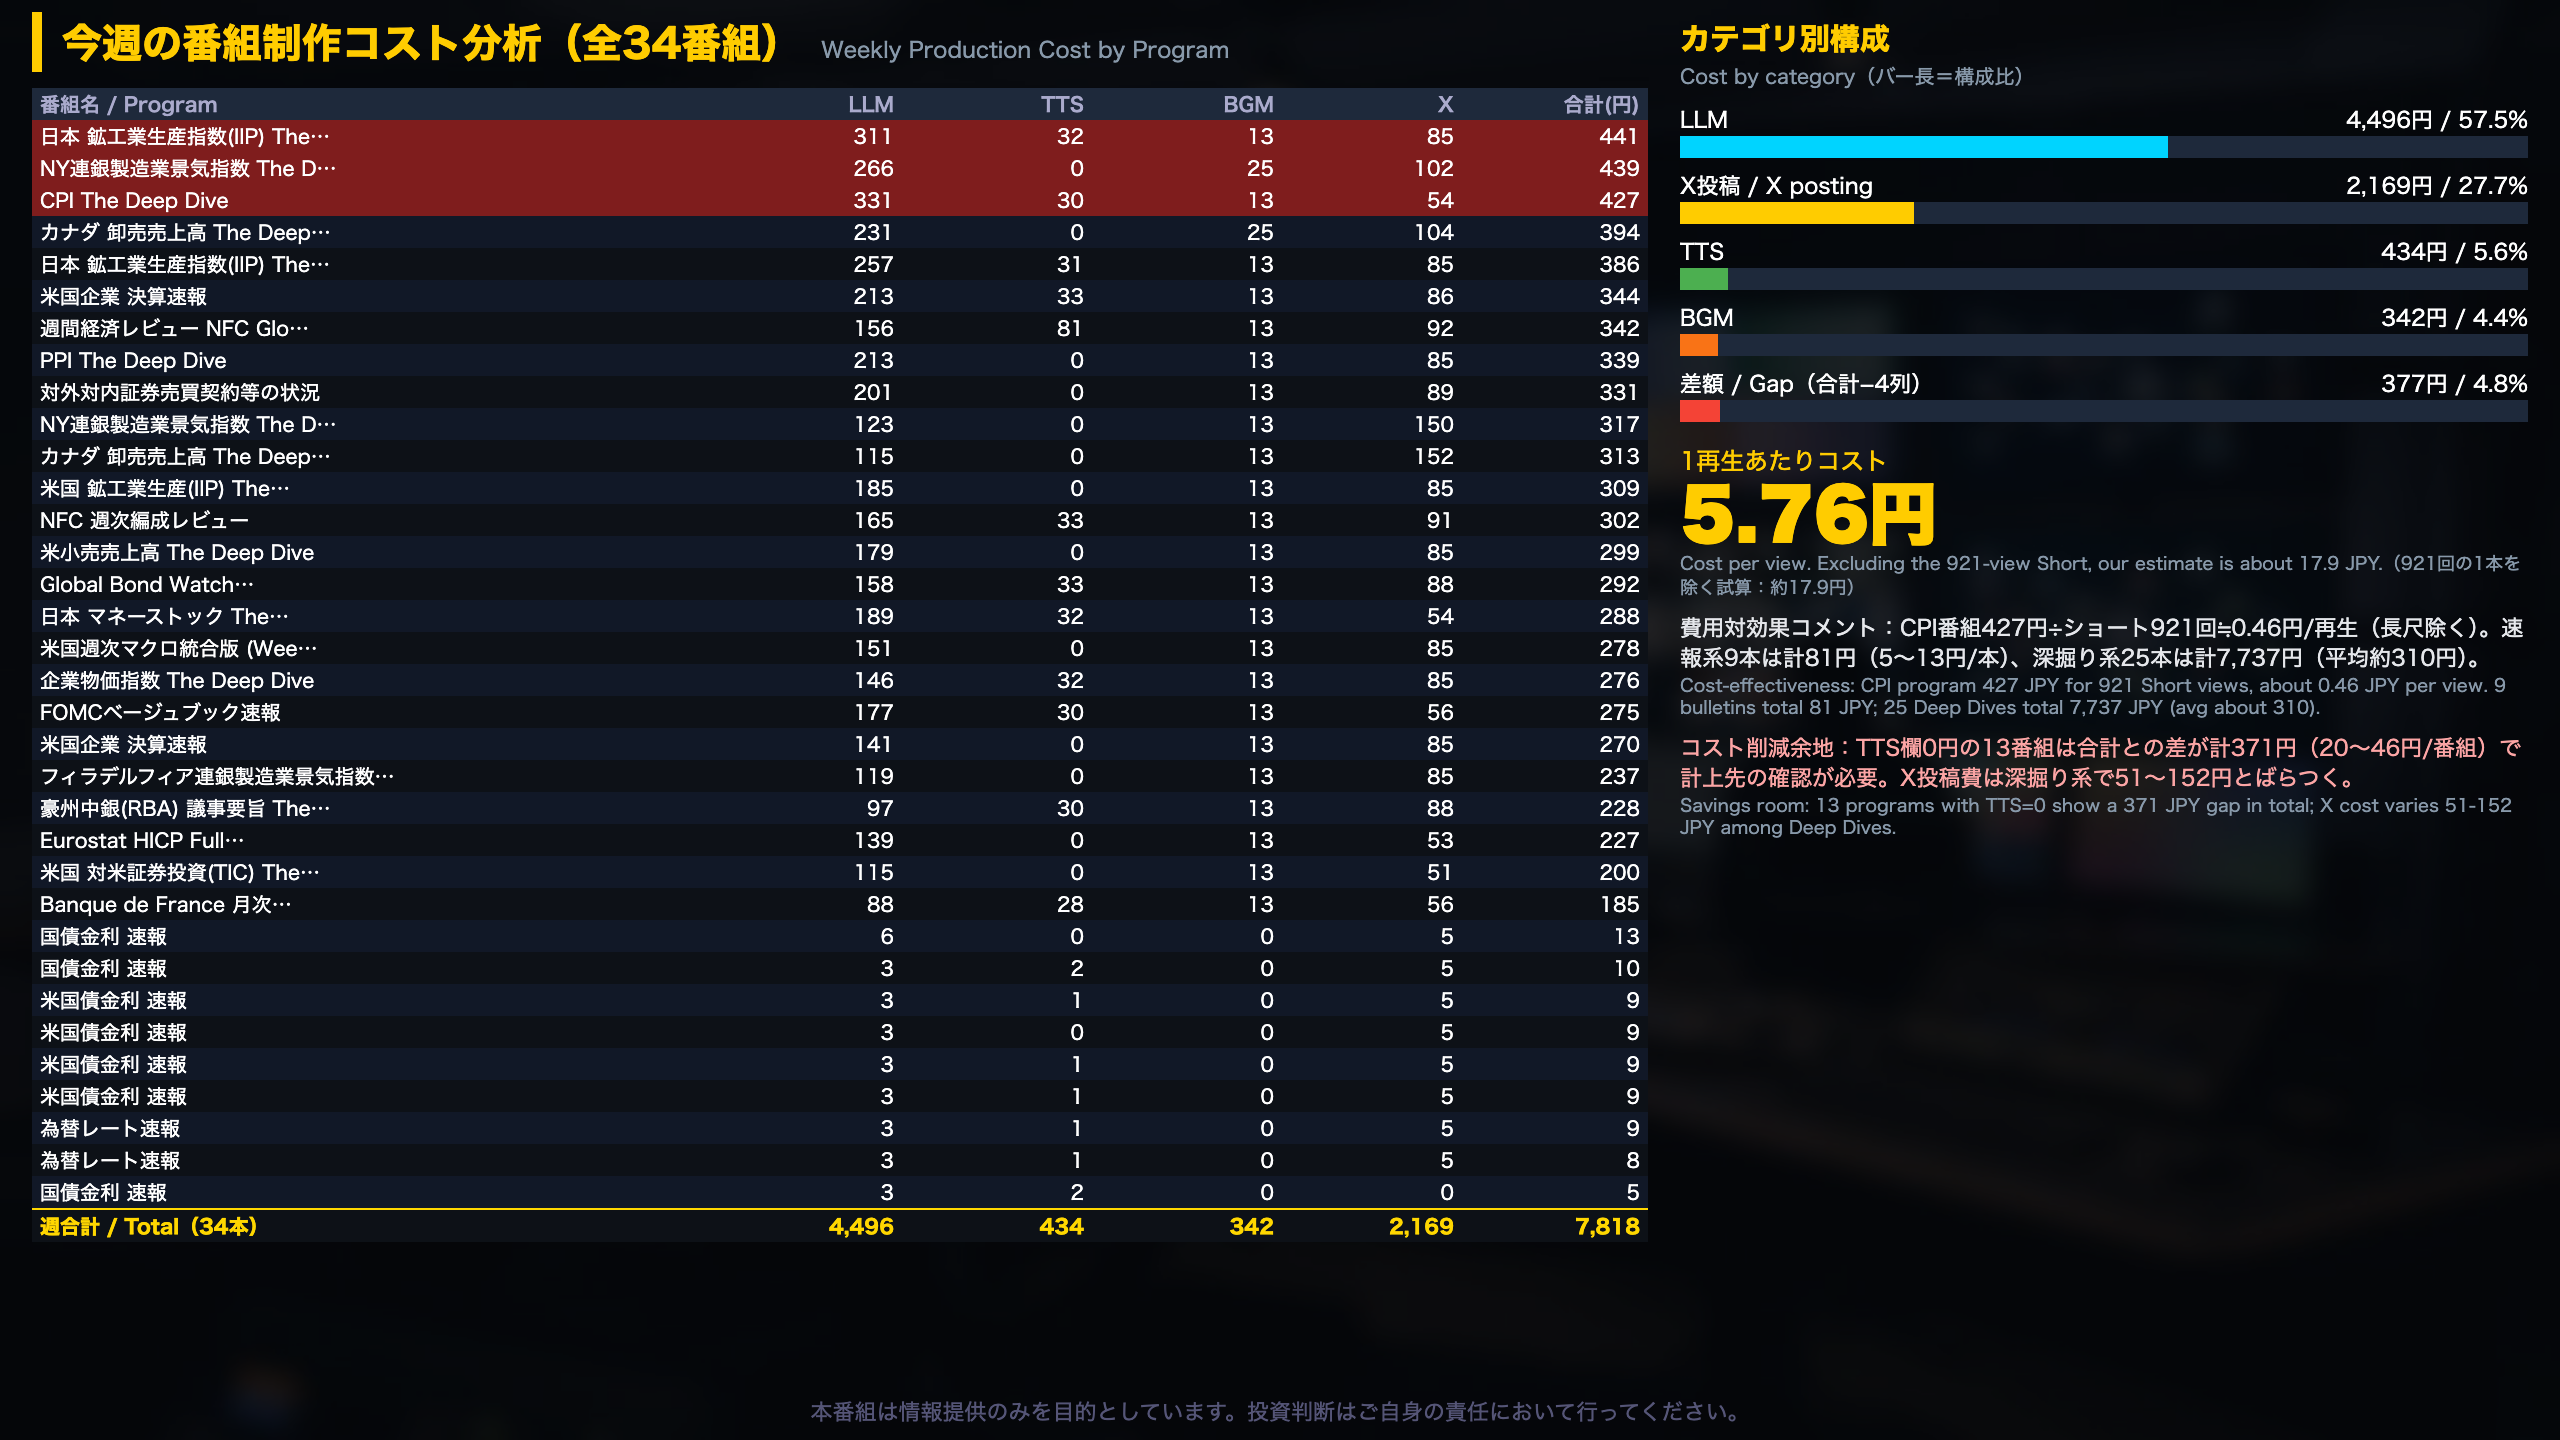
Cost structure in detail
| Category | Amount | Share |
|---|---|---|
| LLM | 4,496 JPY | 57.5% |
| X posting | 2,169 JPY | 27.7% |
| TTS | 434 JPY | 5.6% |
| BGM | 342 JPY | 4.4% |
| Unattributed gap | 377 JPY | 4.8% |
The gap is the weekly total (7,818) minus the four listed columns (7,441).
Bulletins versus Deep Dives
Nine bulletin programs (JGB yields, US Treasury yields, FX) cost 81 yen in total, or 5-13 yen each (1.0% of spend). The 25 Deep Dive-type programs cost 7,737 yen in total, averaging about 310 yen, in a range of 185-441 yen.
What stands out
- In 13 programs where the TTS column shows zero, totals exceed the listed components by 371 yen in aggregate (20-46 yen each). Text-to-speech costs may be booked elsewhere, so the 434 yen TTS figure may be understated.
- X posting varies from 51 to 152 yen among Deep Dives; the reason is not in the source data.
Cost-effectiveness
The CPI Deep Dive cost 427 yen against 921 Short views, about 0.46 yen per view (excluding its long-form output). But one video drives the weekly average of 5.76 yen; excluding it, our estimate rises to about 17.9 yen per view. In media terms, this is like one hit episode flattering the cost-per-viewer figure for the whole season.
Next step
Clean up cost attribution first, then build a per-program table linking spend to views.
来週の番組制作方針
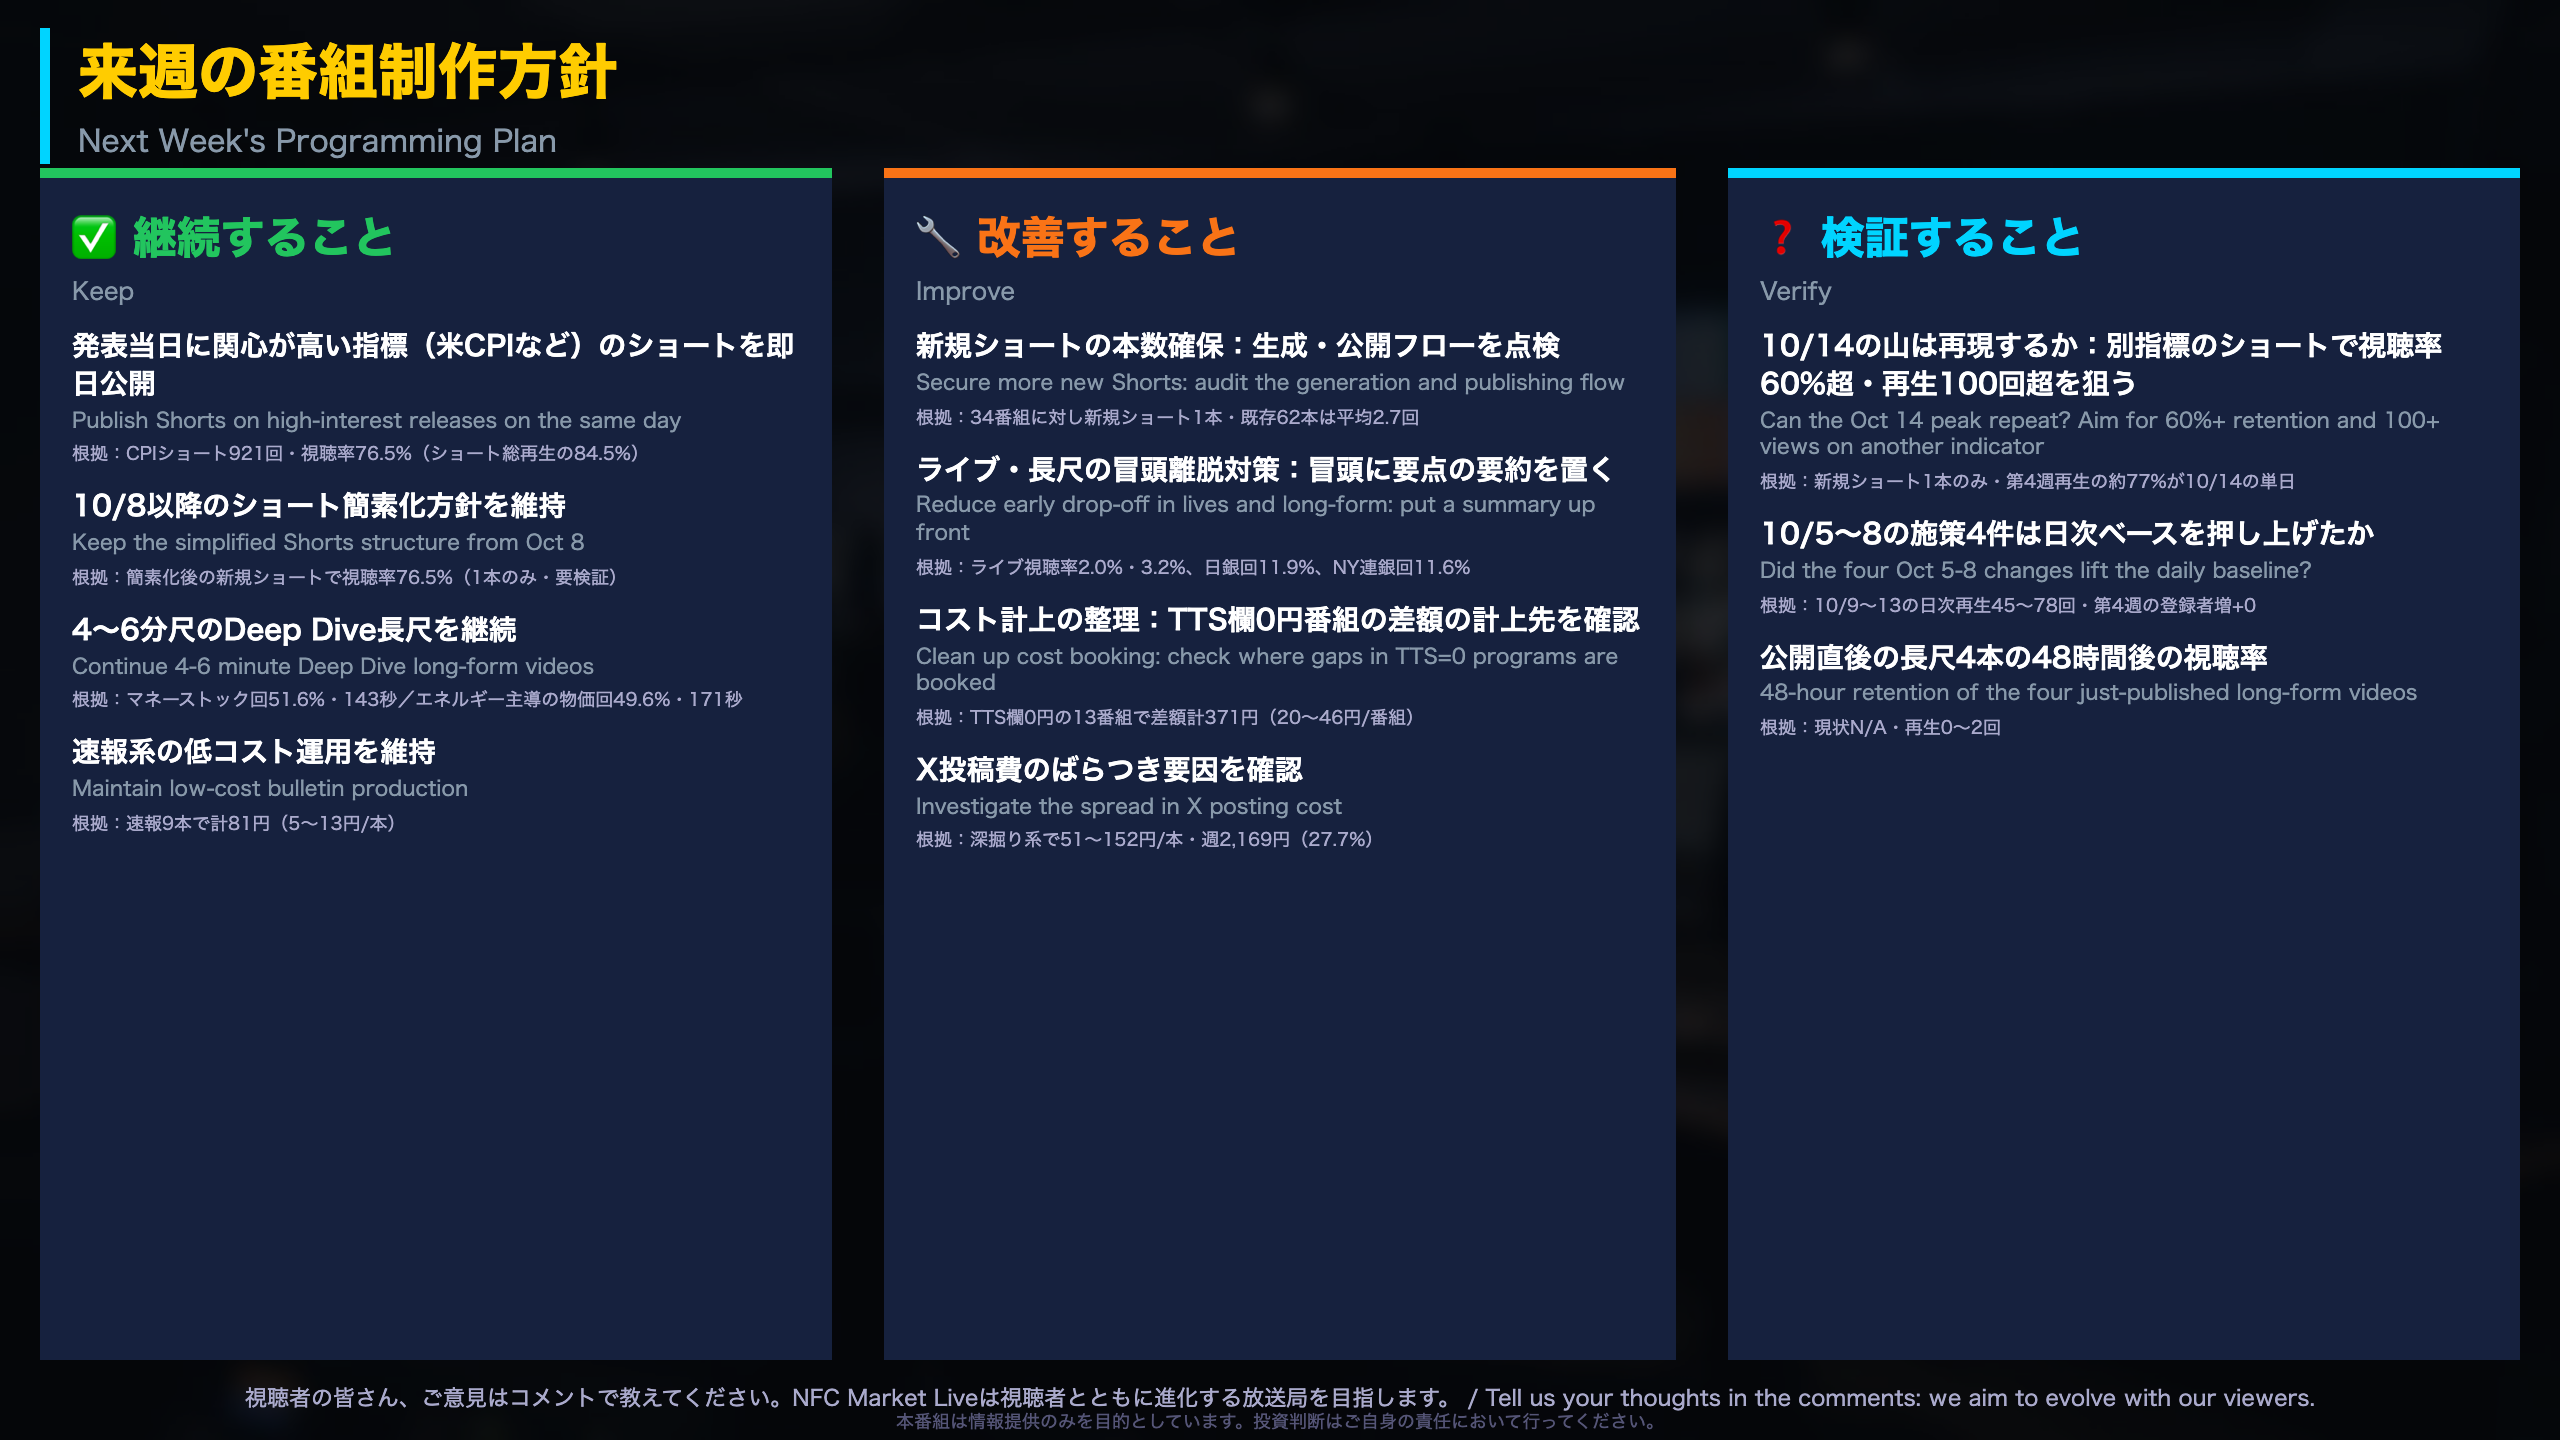
Next week’s actions and decision rules
Keep
- Same-day Shorts on high-interest releases (the CPI Short: 921 views, 76.5% retention).
- The simplified Shorts structure introduced on Oct 8, though it rests on one new Short.
- 4-6 minute Deep Dive long-form videos (51.6% and 49.6% retention episodes).
- Low-cost bulletins (nine programs for 81 yen in total).
Improve
- Output: only one new Short came from 34 programs. We will audit the generation and publishing flow.
- Opening retention for live and long-form: the two lives ran an implied 20-35 minutes with 2.0% and 3.2% retention, so a tighter opening summary is the first candidate.
- Cost bookkeeping: 13 programs with zero TTS show a combined 371 yen gap.
- X posting cost: spread of 51-152 yen per Deep Dive.
Verify
- Can the Oct 14 peak be reproduced? A working benchmark: a Short on a different indicator reaching 60%+ retention and 100+ views (an internal rule of thumb, not an industry standard).
- Did the Oct 5-8 changes work? Check whether daily views stay above the roughly 75 baseline once Oct 16-17 data arrives.
- 48-hour retention of the four just-published long-form videos.
Why we stay cautious
This week’s data covers 26 days and is dominated by single-day peaks. Like a TV programmer reading overnight ratings after a one-off event, we avoid drawing conclusions from one spike and keep testing.
Disclaimer: This article is for informational purposes only. All investment decisions are made solely at your own risk.