📺 Watch the Full Video Analysis
This article was automatically generated by the NFC Market Live AI analysis system. (Updated: 2026-10-16 13:22 JST)
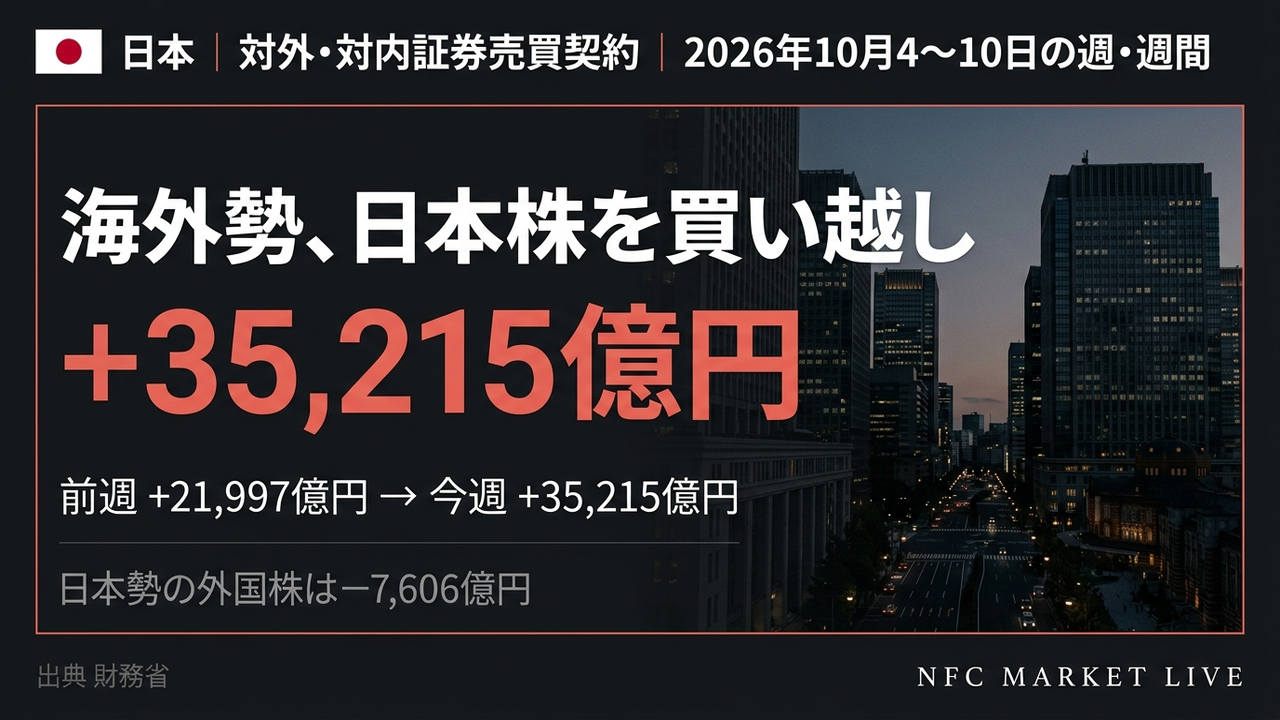
📊 Japan’s Ministry of Finance weekly securities data for Oct 4-10 (released Oct 16).
📈 Foreign investors net bought JPY 3.52 trillion of Japanese stocks, the second-largest week in the past year’s data. Long-term bonds (+JPY 1.08T) and short-term bonds (+JPY 842B) were also net bought.
📉 Japanese residents net sold JPY 761B of foreign stocks and JPY 340B of foreign long-term bonds.
⚠️ But the three weeks of Sep 6-26 saw JPY 6.82T of foreign selling, so part of this may be a rebound. USD/JPY: 158.34.
💡 Next: does buying continue in the week of Oct 11-17?
海外勢が日本株を大幅買い越し、資金は株と債券に
Foreign Money Returned to Japanese Assets, With Caveats
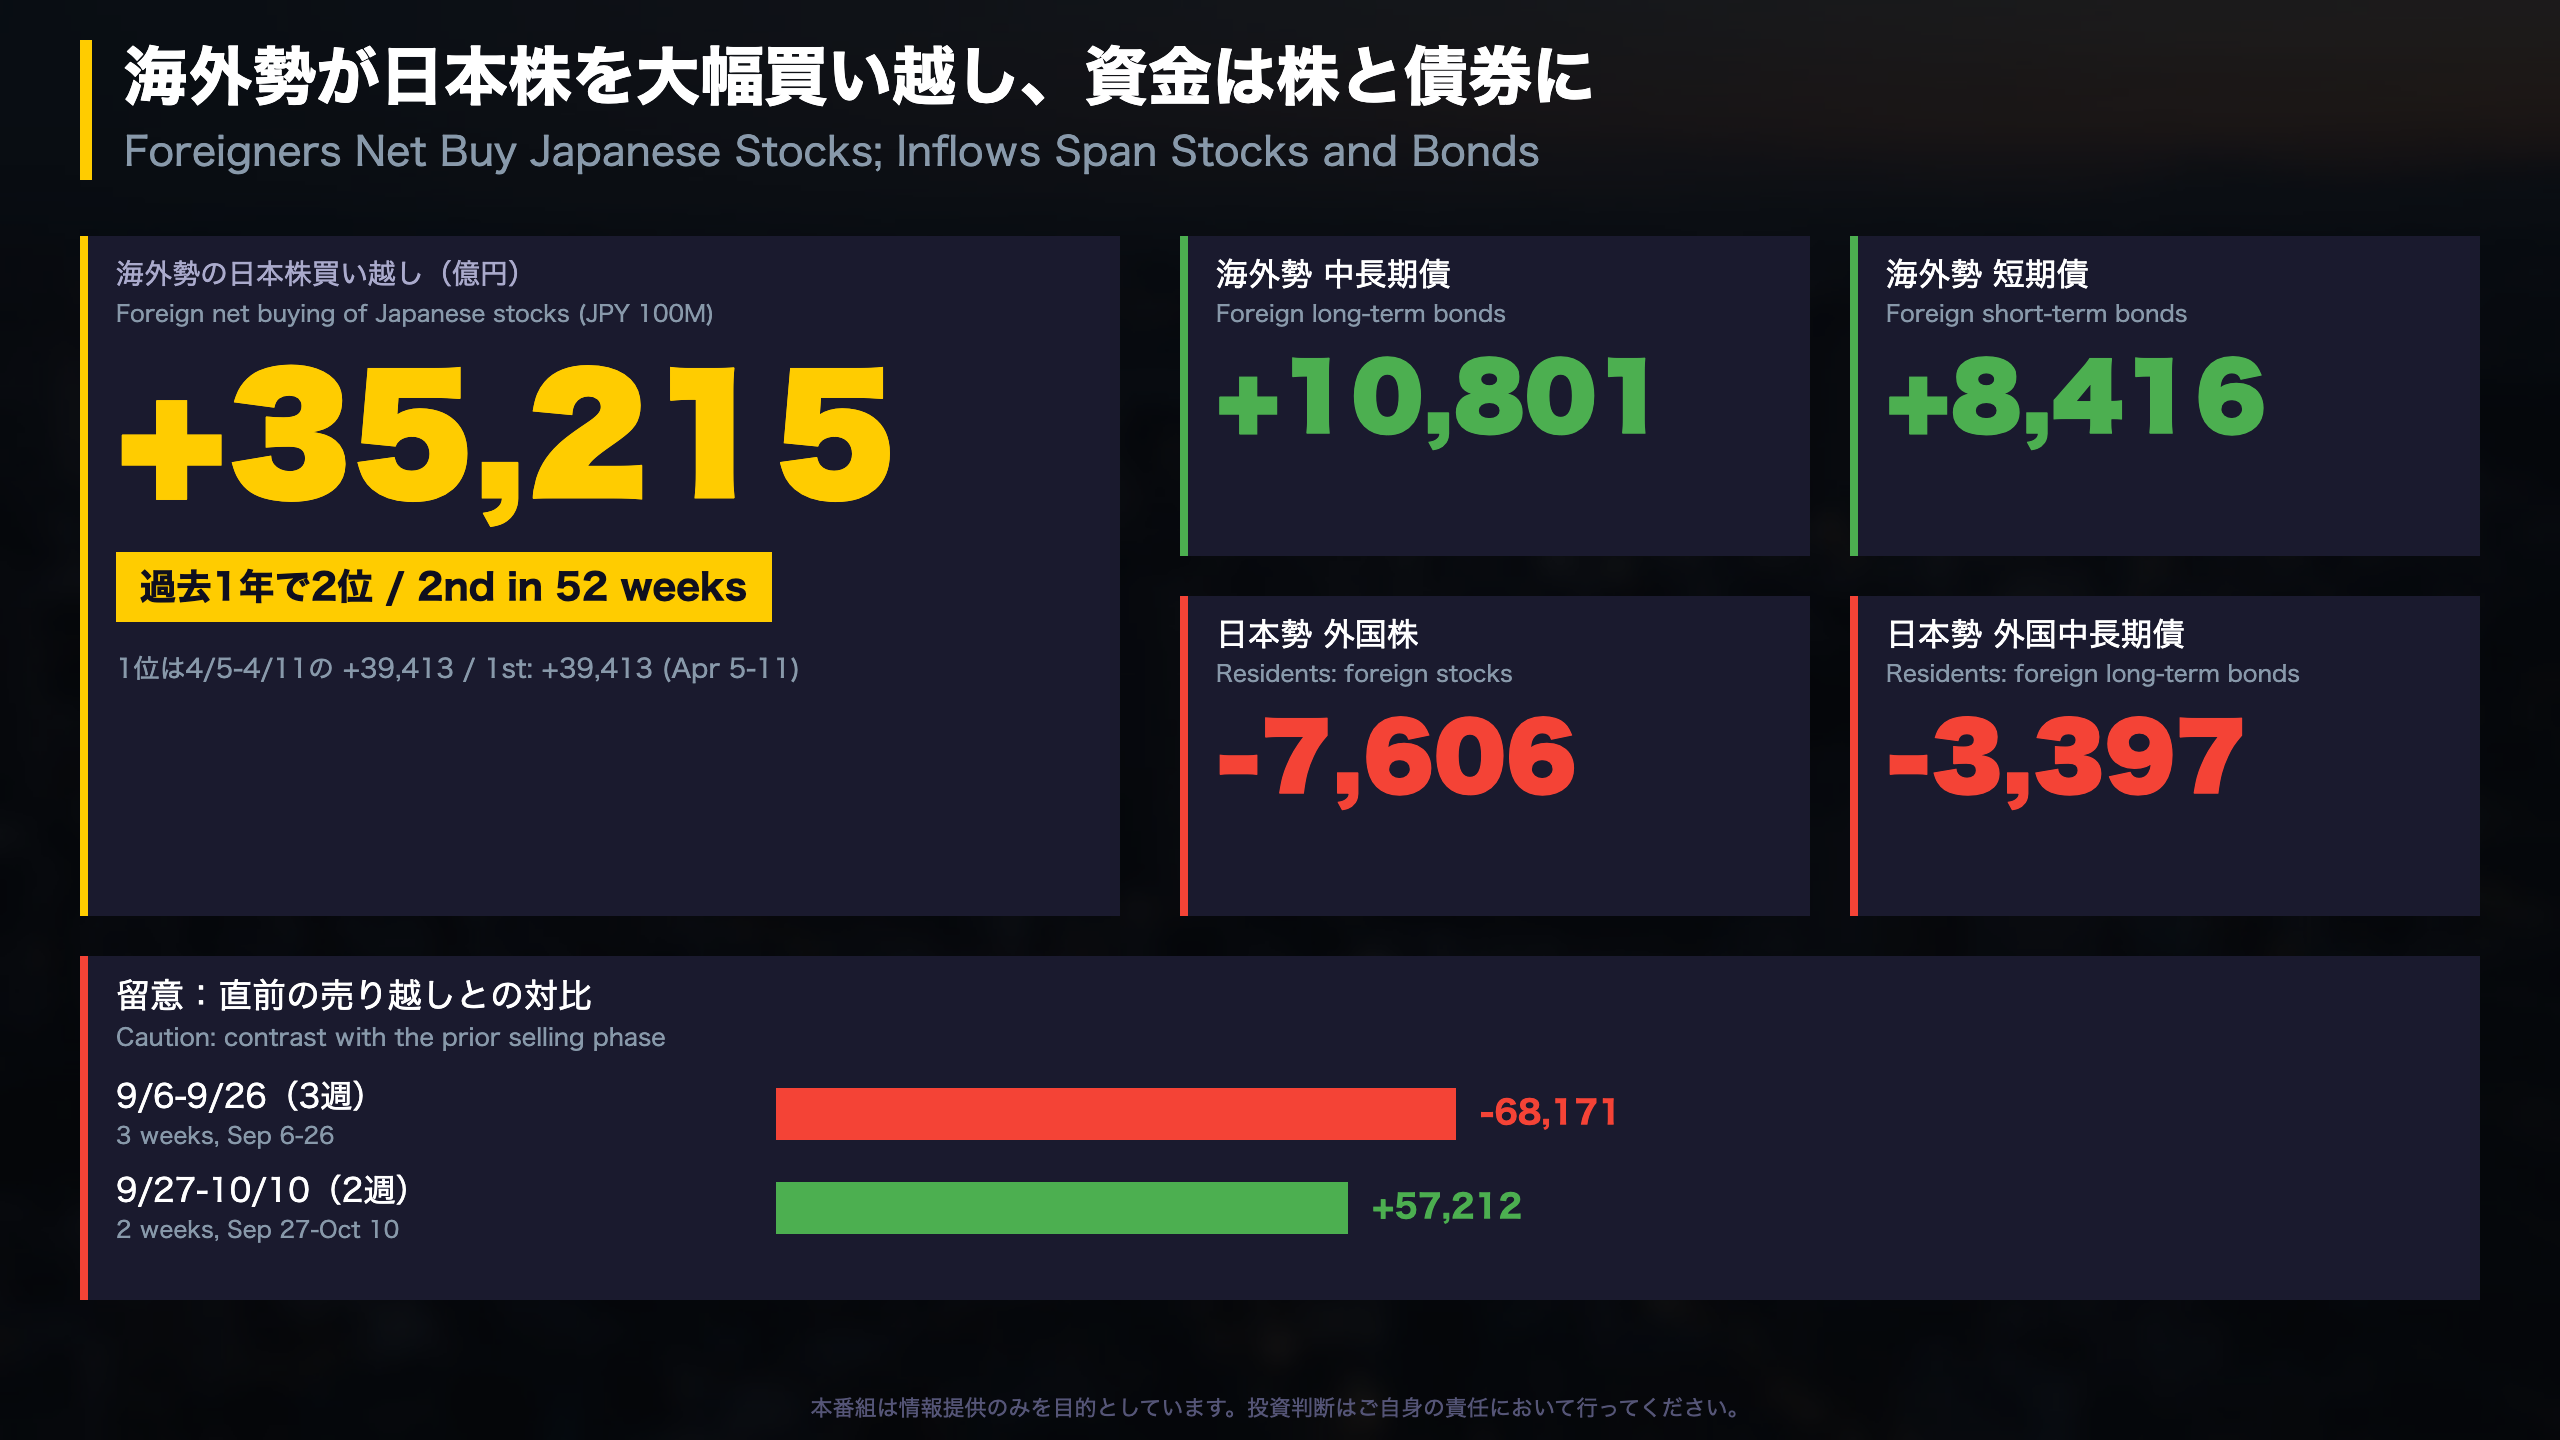
Japan’s Ministry of Finance (MOF) publishes weekly data on cross-border securities transactions, recorded on a contract basis. For the week of Oct 4-10, 2026 (released Oct 16), non-residents net bought JPY 3.52 trillion of Japanese equities, JPY 1.08 trillion of long-term bonds and JPY 842 billion of short-term bills. Positive figures mean net purchases; negative figures mean net sales.
Snapshot (JPY 100 million)
| Flow | This week | Prior week |
|---|---|---|
| Foreigners: Japanese stocks | +35,215 | +21,997 |
| Foreigners: Japanese long-term bonds | +10,801 | +6,081 |
| Foreigners: Japanese short-term bonds | +8,416 | -2,385 |
| Residents: foreign stocks | -7,606 | +13,286 |
| Residents: foreign long-term bonds | -3,397 | -3,457 |
Why it matters
The equity figure is the second-largest weekly net purchase in the 52-week dataset, behind +39,413 in the week of Apr 5-11. It is the Japanese counterpart to the US Treasury’s TIC data, but it is released weekly rather than monthly, which makes it noisier and more prone to reversals.
Two readings
- Constructive: inflows spanned stocks and bonds, while residents were net sellers of both foreign stocks and long-term foreign bonds.
- Cautious: the three weeks of Sep 6-26 saw JPY 6.82 trillion of net foreign selling, so the five-week total is still -10,959. One week does not confirm a regime change.
What to watch
The week of Oct 11-17 will show whether foreign buying extends to a third straight week. The data alone say nothing about market direction.
海外勢の日本株フロー:52週の推移と反動の構図
Foreign Equity Flows: A 52-Week Look at Sell-Offs and Rebounds
Reading the series
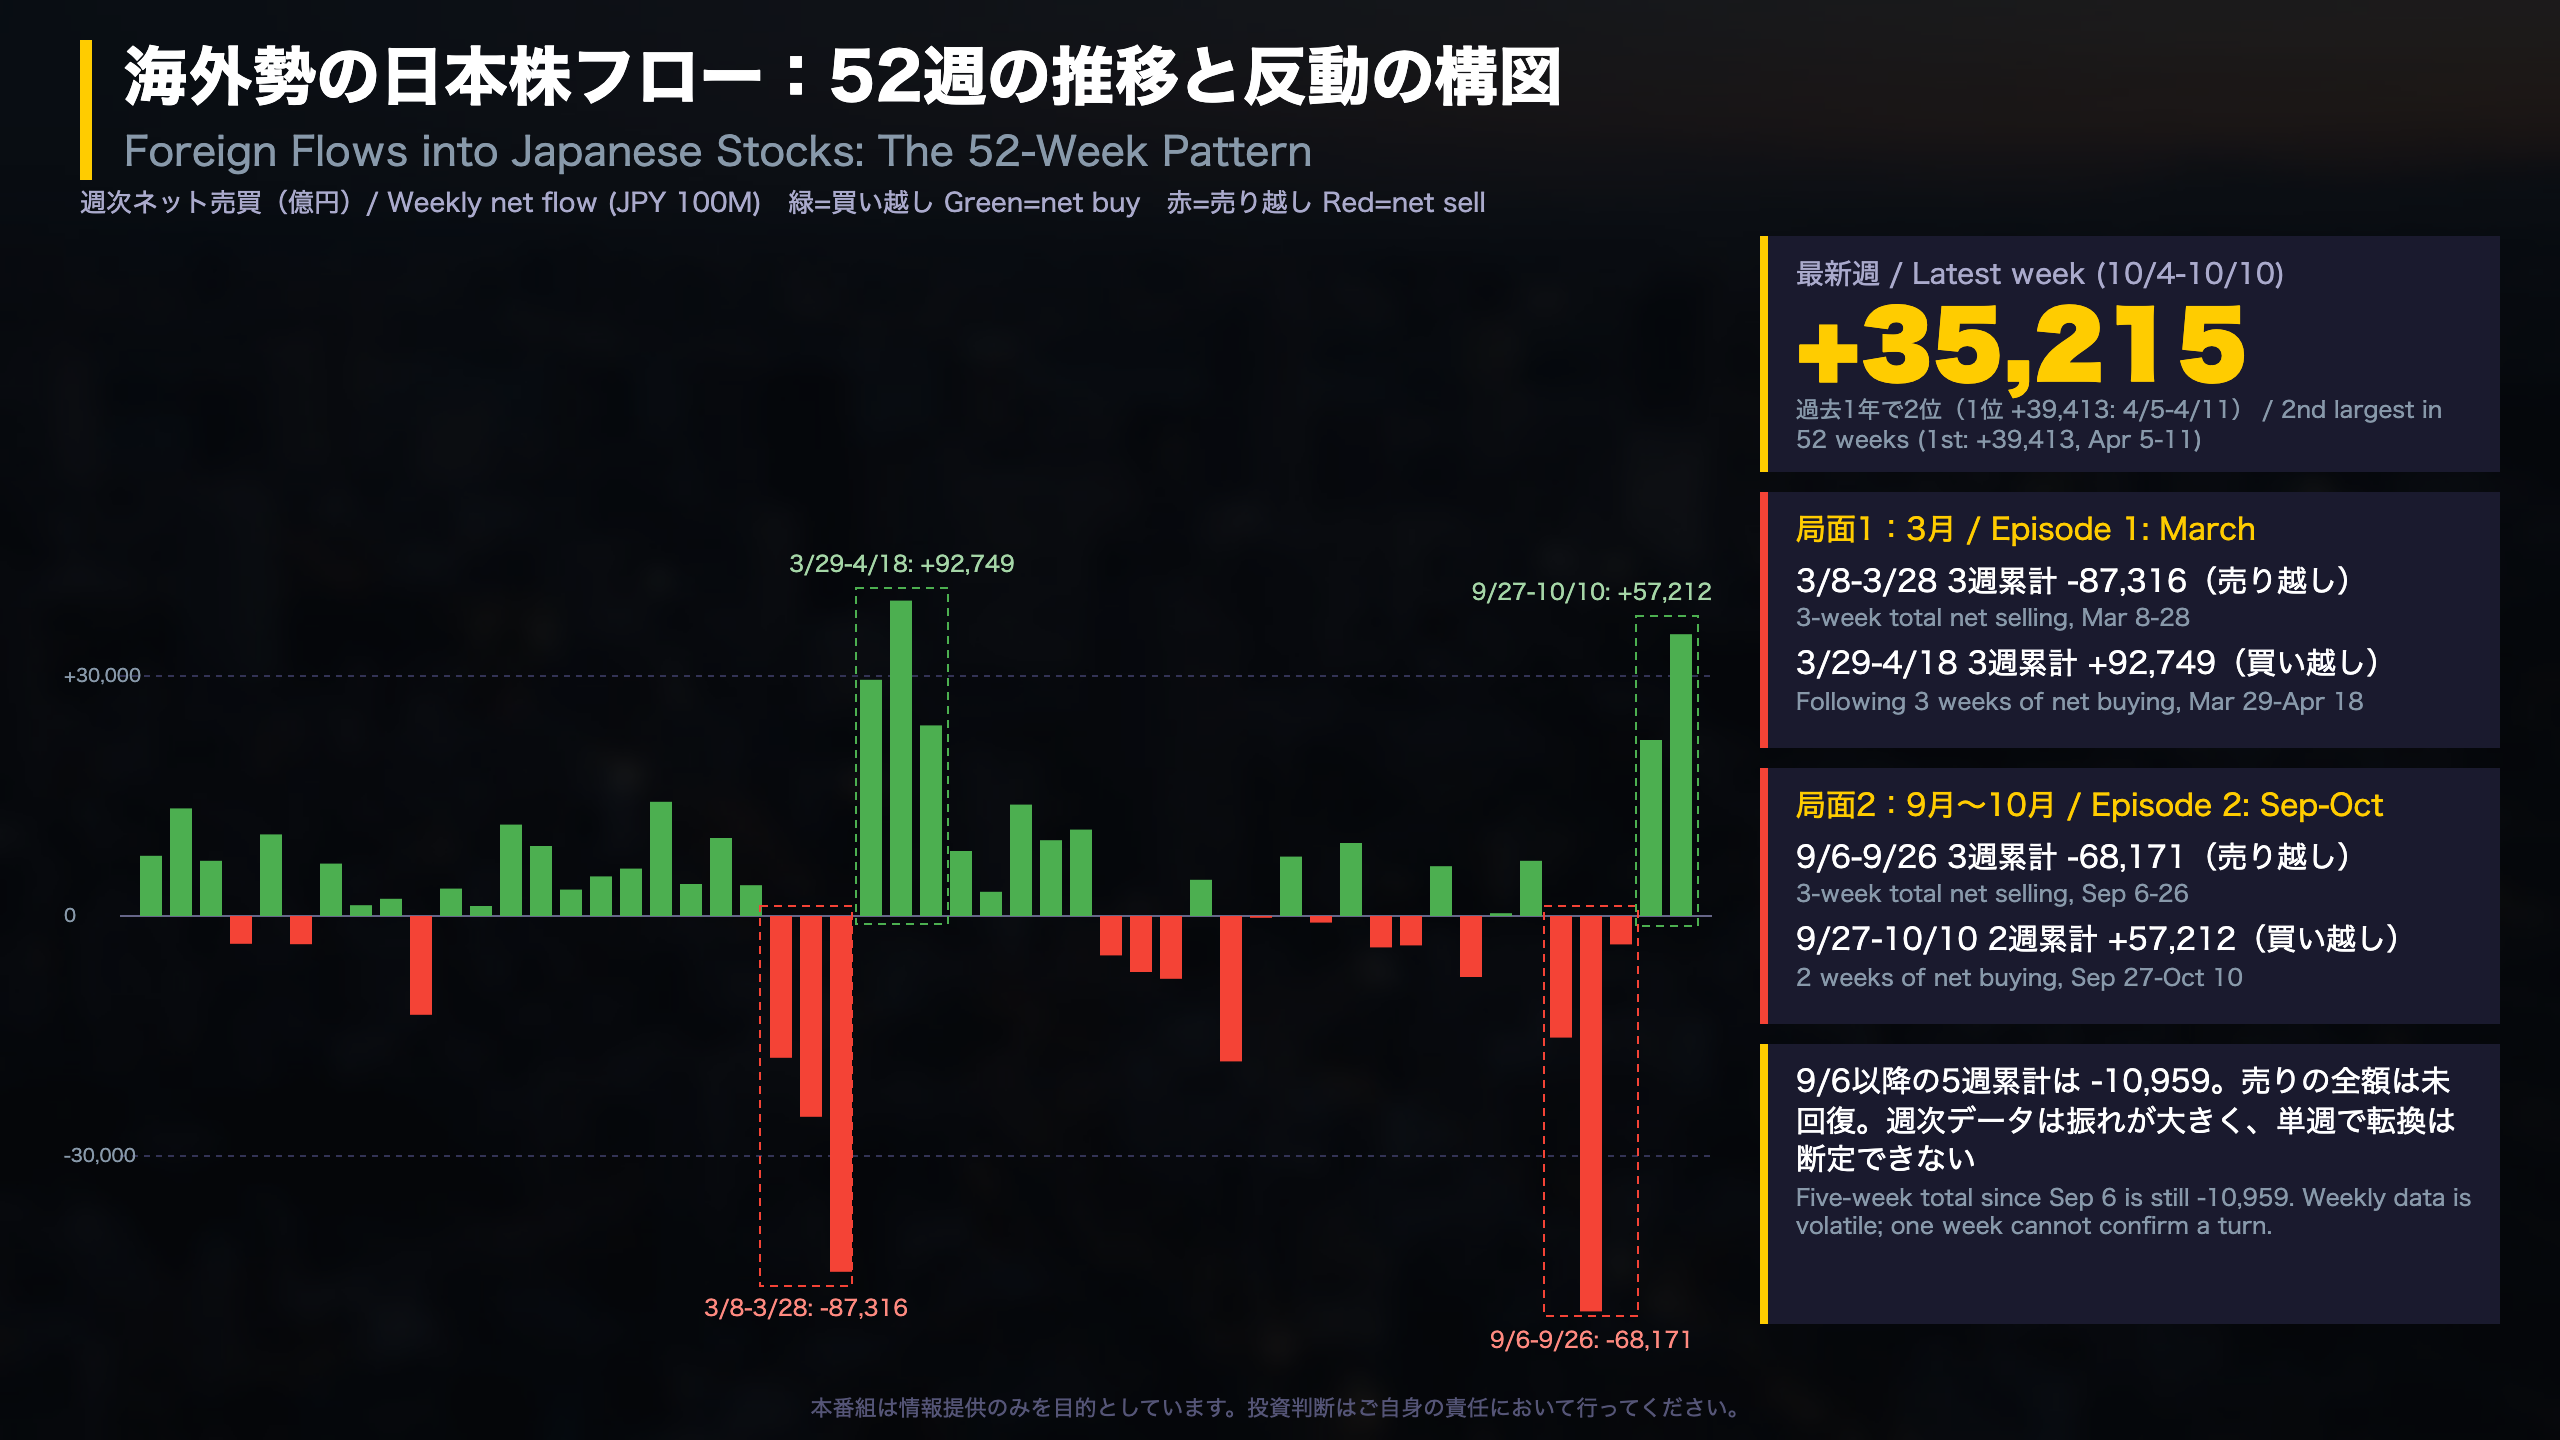
The weekly series published by Japan’s Ministry of Finance records net purchases (positive) or net sales (negative) of Japanese stocks by non-residents, in units of JPY 100 million. Over the 52 weeks in the dataset, the largest net purchase was +39,413 (Apr 5-11) and the largest net sale was -49,425 (Sep 13-19). This week’s +35,215 ranks second among purchases.
Two sell-then-buy episodes
| Episode | Three-week selling | Subsequent buying |
|---|---|---|
| Mar-Apr | Mar 8-28: -87,316 | Mar 29-Apr 18 (3 wks): +92,749 |
| Sep-Oct | Sep 6-26: -68,171 | Sep 27-Oct 10 (2 wks): +57,212 |
In the spring episode, buying more than offset the selling (a net +5,433 over six weeks). In the current episode, the five-week total is still -10,959, so the earlier selling has not been fully recovered.
How to interpret
- Constructive view: large outflows have been followed by large inflows before, which suggests flows can mean-revert quickly.
- Cautious view: there is only one prior example, and weekly flows are volatile. Unlike US ETF flow data, which is often smoothed in commentary, this series is raw and lumpy.
Context for global investors
These contract-based figures differ from the Tokyo Stock Exchange’s weekly investor-type survey, which tracks executed trades by category. The two series can diverge in a given week.
Next step
If buying continues in the week of Oct 11-17, it would be a third straight week, matching the length of the spring rebound. That is a factual comparison, not a forecast.
海外勢の債券フロー:中長期債・短期債とも買い越し
Foreign Demand for Japanese Government Bonds: Long and Short Ends
What the numbers say
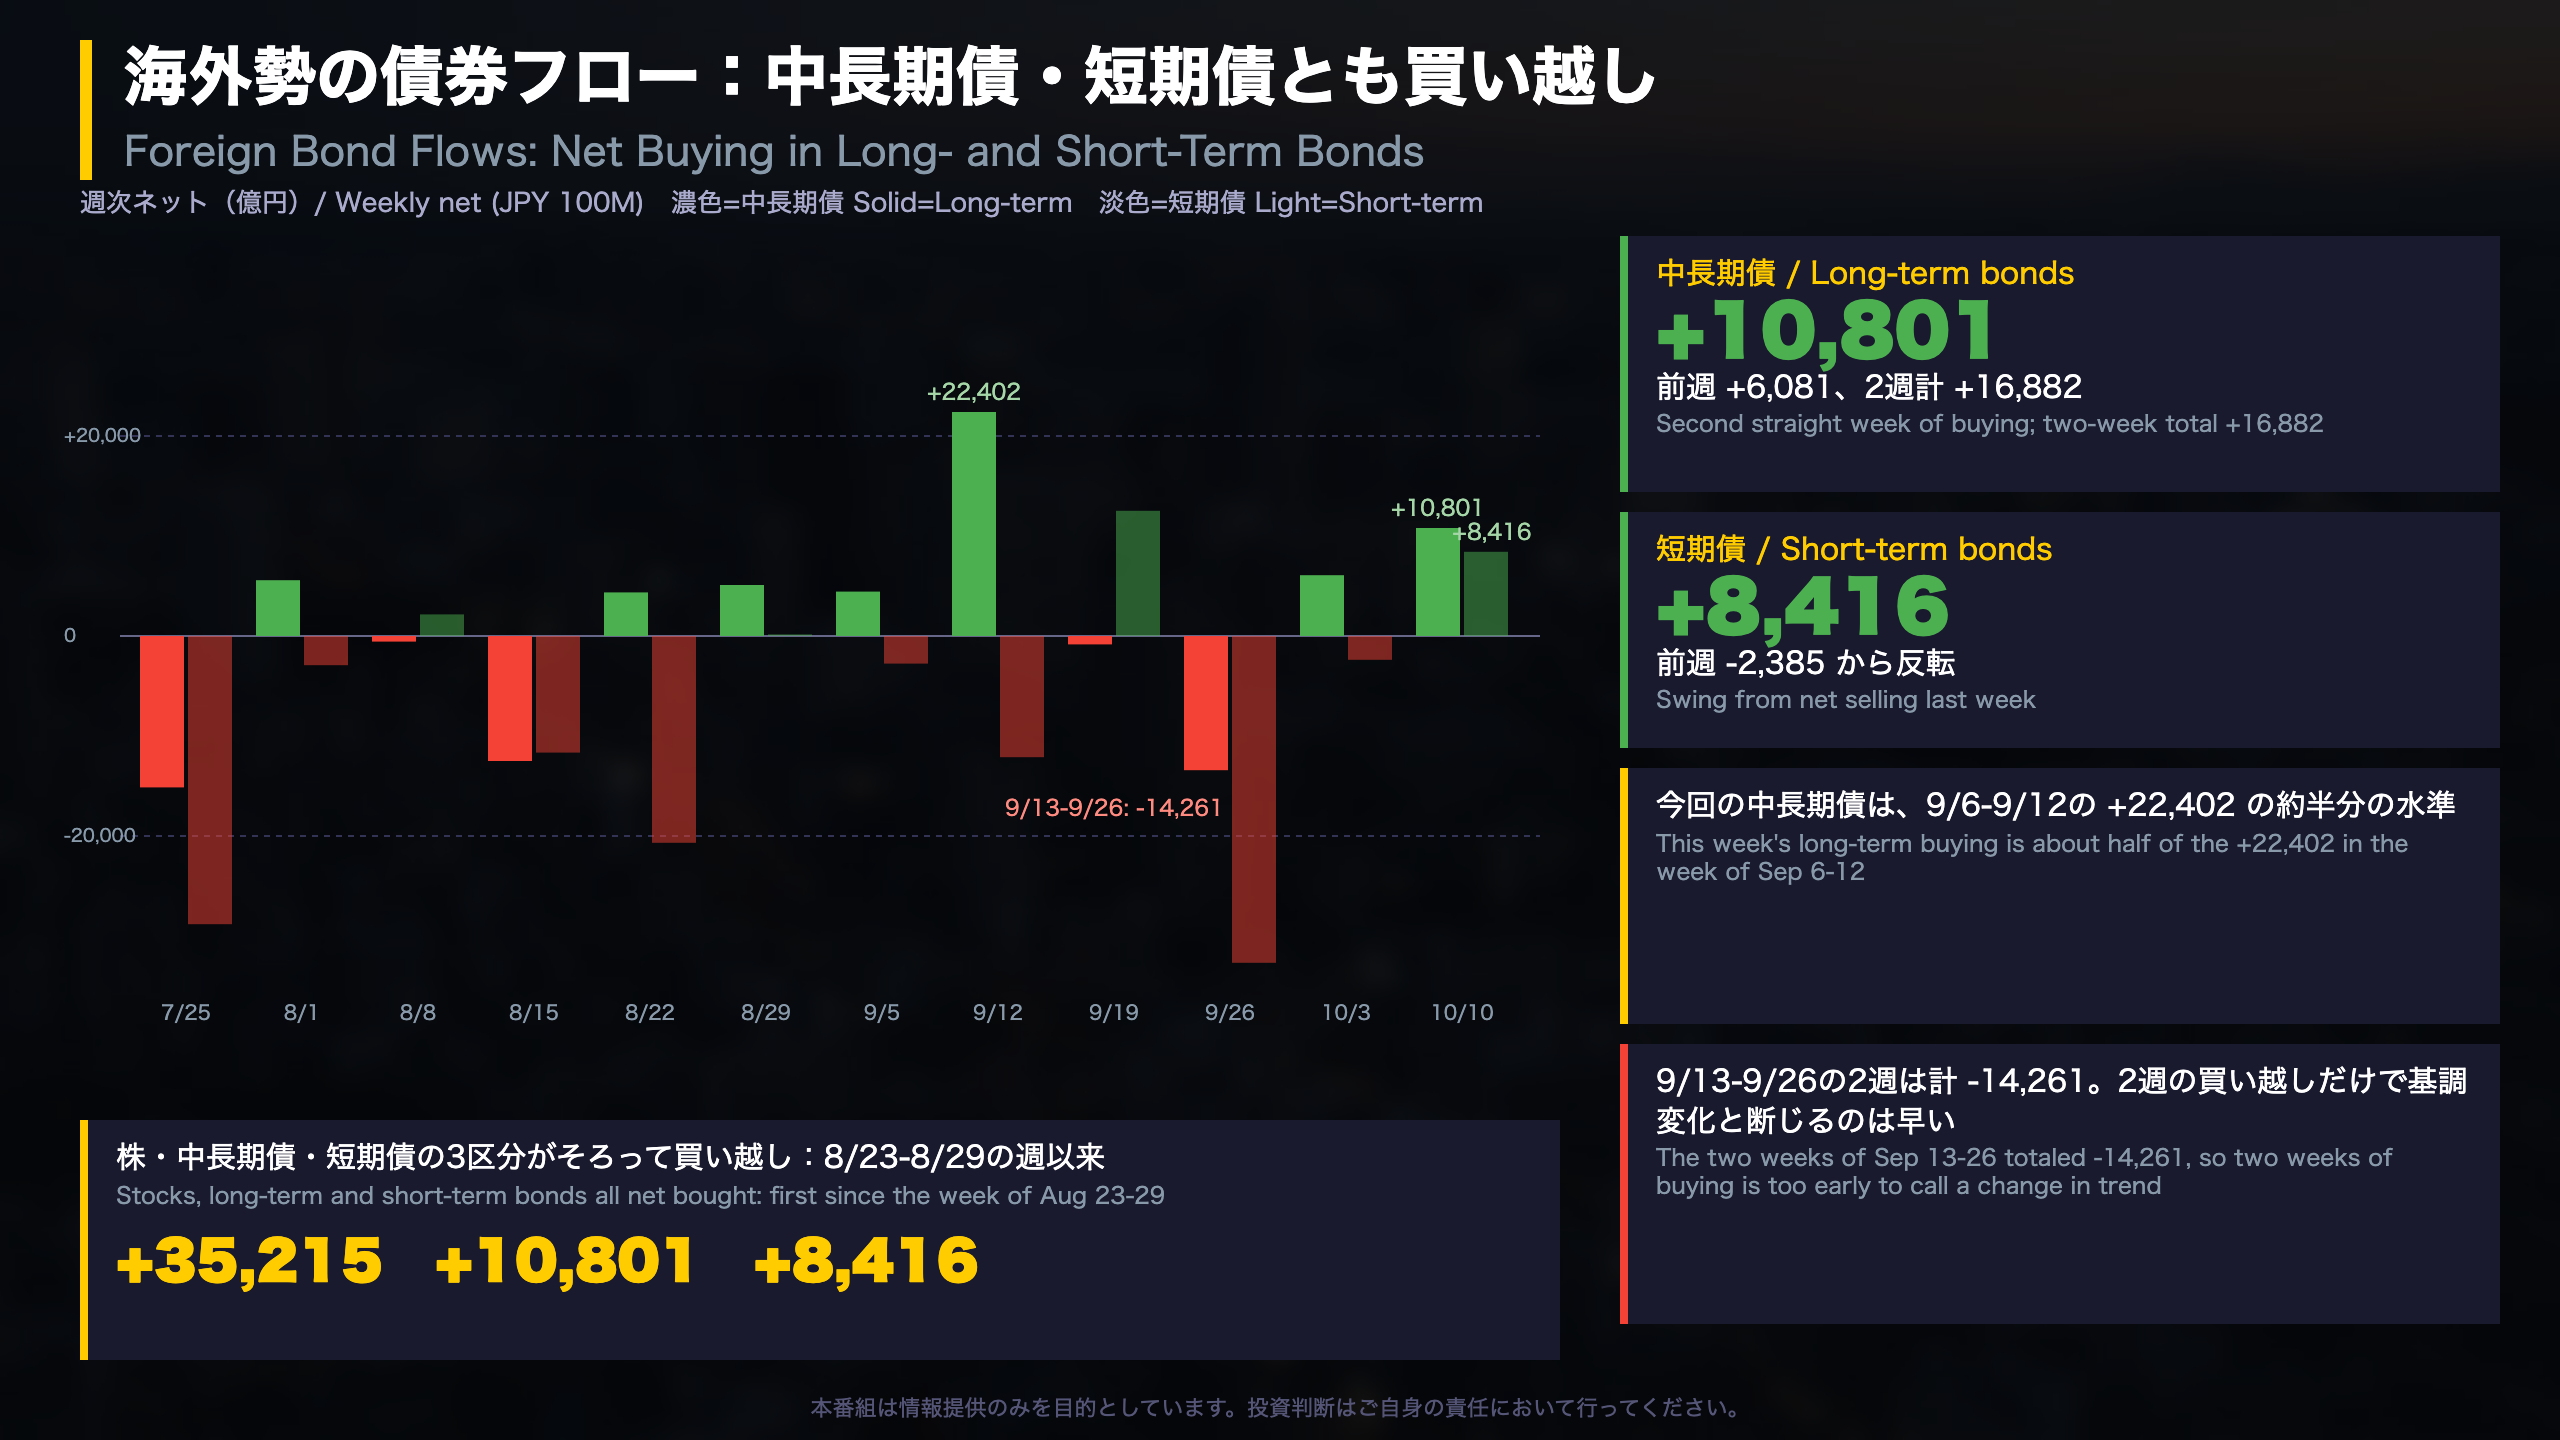
Non-residents net bought JPY 1.08 trillion of long-term bonds (JGBs with maturities over one year) and JPY 842 billion of short-term bills in the week of Oct 4-10. Together with stocks (+JPY 3.52 trillion), all three categories were net bought in the same week, the first time since Aug 23-29.
Recent history (JPY 100 million)
| Week | Long-term | Short-term |
|---|---|---|
| Sep 6-12 | +22,402 | -12,128 |
| Sep 13-19 | -843 | +12,511 |
| Sep 20-26 | -13,418 | -32,672 |
| Sep 27-Oct 3 | +6,081 | -2,385 |
| Oct 4-10 | +10,801 | +8,416 |
Long-term bond flows swung from a large purchase (+22,402) to a two-week net sale (-14,261) and back to a two-week purchase (+16,882). Short-term flows have an even wider range: the dataset’s extremes are -44,514 (Dec 21-27) and +35,949 (Jan 4-10).
Two readings
- Constructive: broad-based buying across stocks, long bonds and bills in the same week.
- Cautious: the Aug 23-29 week that last had three positive categories involved small amounts (+359, +5,091, +166), and this week’s long-term purchase is only about half of the Sep 6-12 level.
International context
In the US, comparable monthly TIC data show foreign holdings of Treasuries. Japan’s series is weekly and contract-based, so it reacts faster but is noisier. Bill flows are often tied to short-term funding and currency-hedging activity, so they should be read separately from long-term bond demand.
What to watch
A third consecutive week of long-term bond buying in Oct 11-17 would extend the current streak. This is a factual checkpoint, not a market call.
日本勢の対外投資:外国株は反転、外債売りは縮小
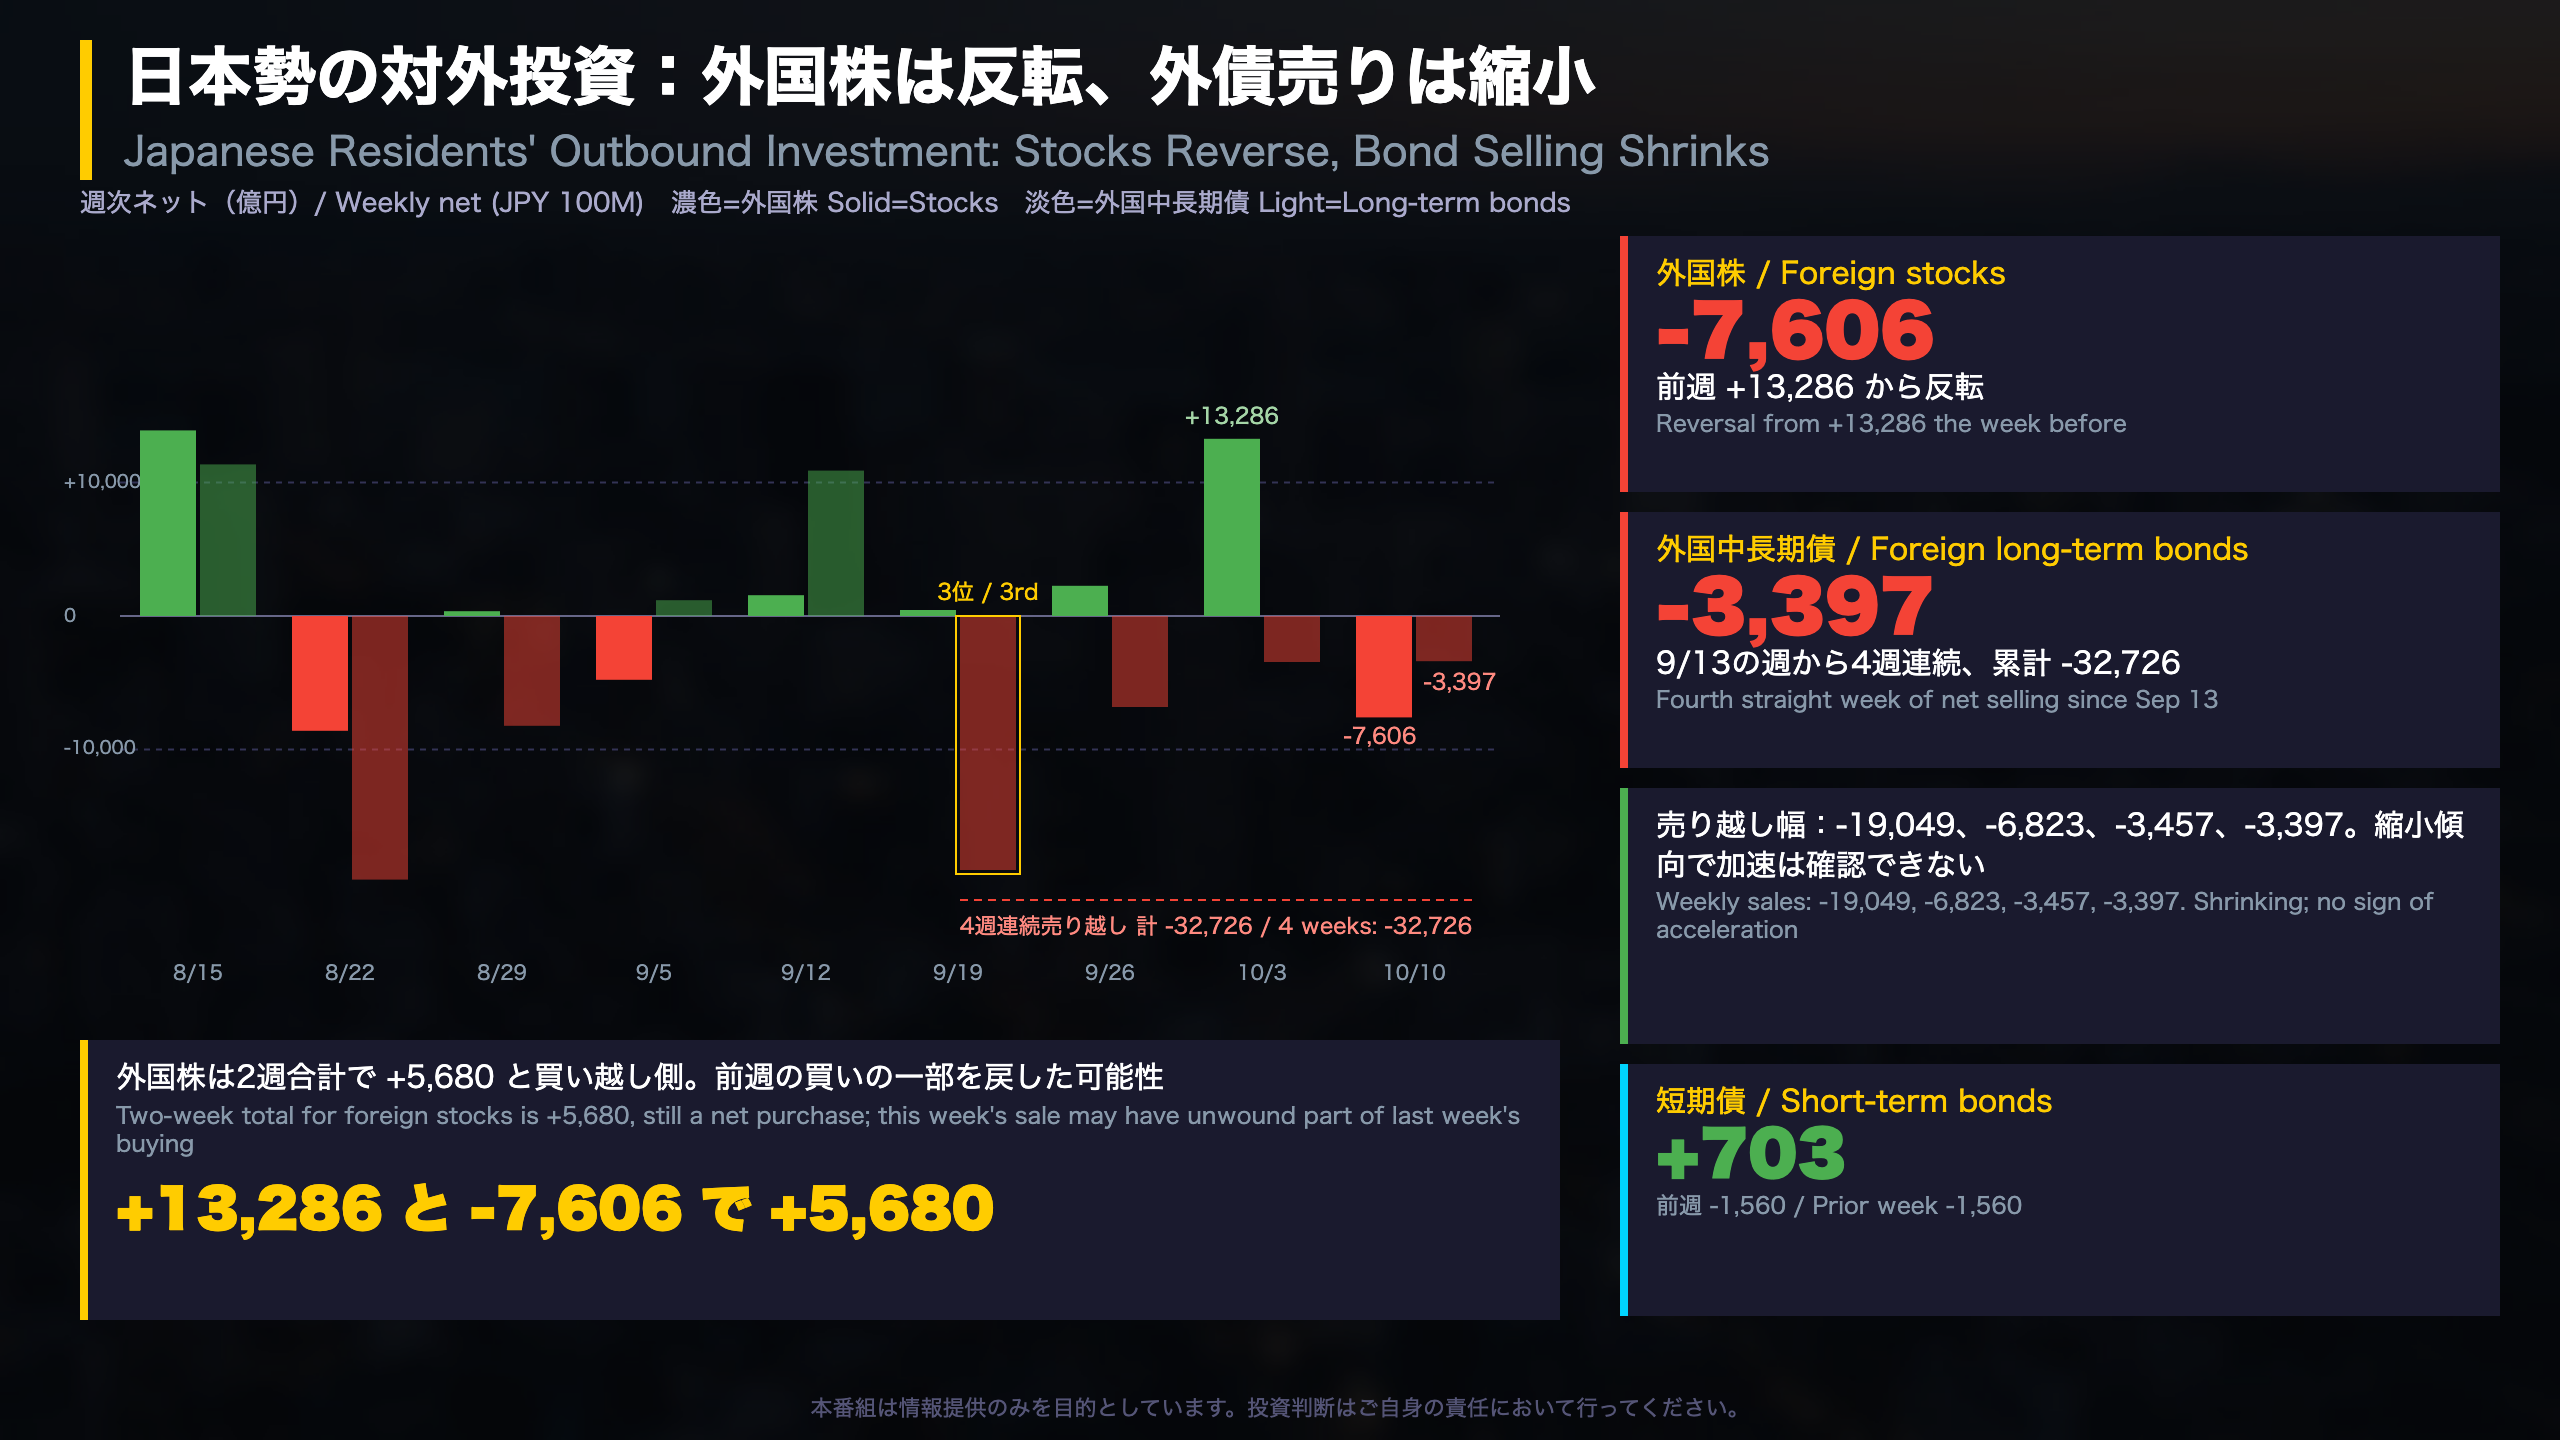
Japanese Residents’ Outbound Investment: Reading the Other Side of the Ledger
Why residents matter
While the headline is about foreign buying of Japan, the MOF report also tracks Japanese residents’ purchases of foreign securities. Because these purchases require converting yen into foreign currency, they are one of the channels through which Japanese savings flow abroad. Pension funds, life insurers and retail investors (including those using NISA accounts) all feed this series.
This week
- Foreign stocks: -7,606 (net sale), reversing +13,286 the week before. The two-week total is +5,680, still a net purchase. The largest weekly sale in the dataset is -24,252 (Apr 26-May 2).
- Foreign long-term bonds: -3,397, the fourth straight weekly net sale.
- Foreign short-term bonds: +703, after -1,560.
The four-week bond streak
| Week | Foreign long-term bonds |
|---|---|
| Sep 13-19 | -19,049 |
| Sep 20-26 | -6,823 |
| Sep 27-Oct 3 | -3,457 |
| Oct 4-10 | -3,397 |
| Total | -32,726 |
The Sep 13-19 sale ranks third in the 52-week data, behind -24,789 (Mar 29-Apr 4) and -19,768 (Aug 16-22). Since then, the pace of selling has slowed each week.
Two readings
- Cautious: four straight weeks of net selling may indicate continued caution toward foreign bonds, although a single series cannot prove it.
- Constructive: the shrinking size of weekly sales shows no sign of accelerating outflows.
What to watch
Whether the streak reaches five weeks in the week of Oct 11-17, or turns positive. As a point of comparison, the week of Apr 26-May 2 saw a +24,064 purchase, so weekly swings can be large.
ドル円とフロー:一方向の関係は確認できず
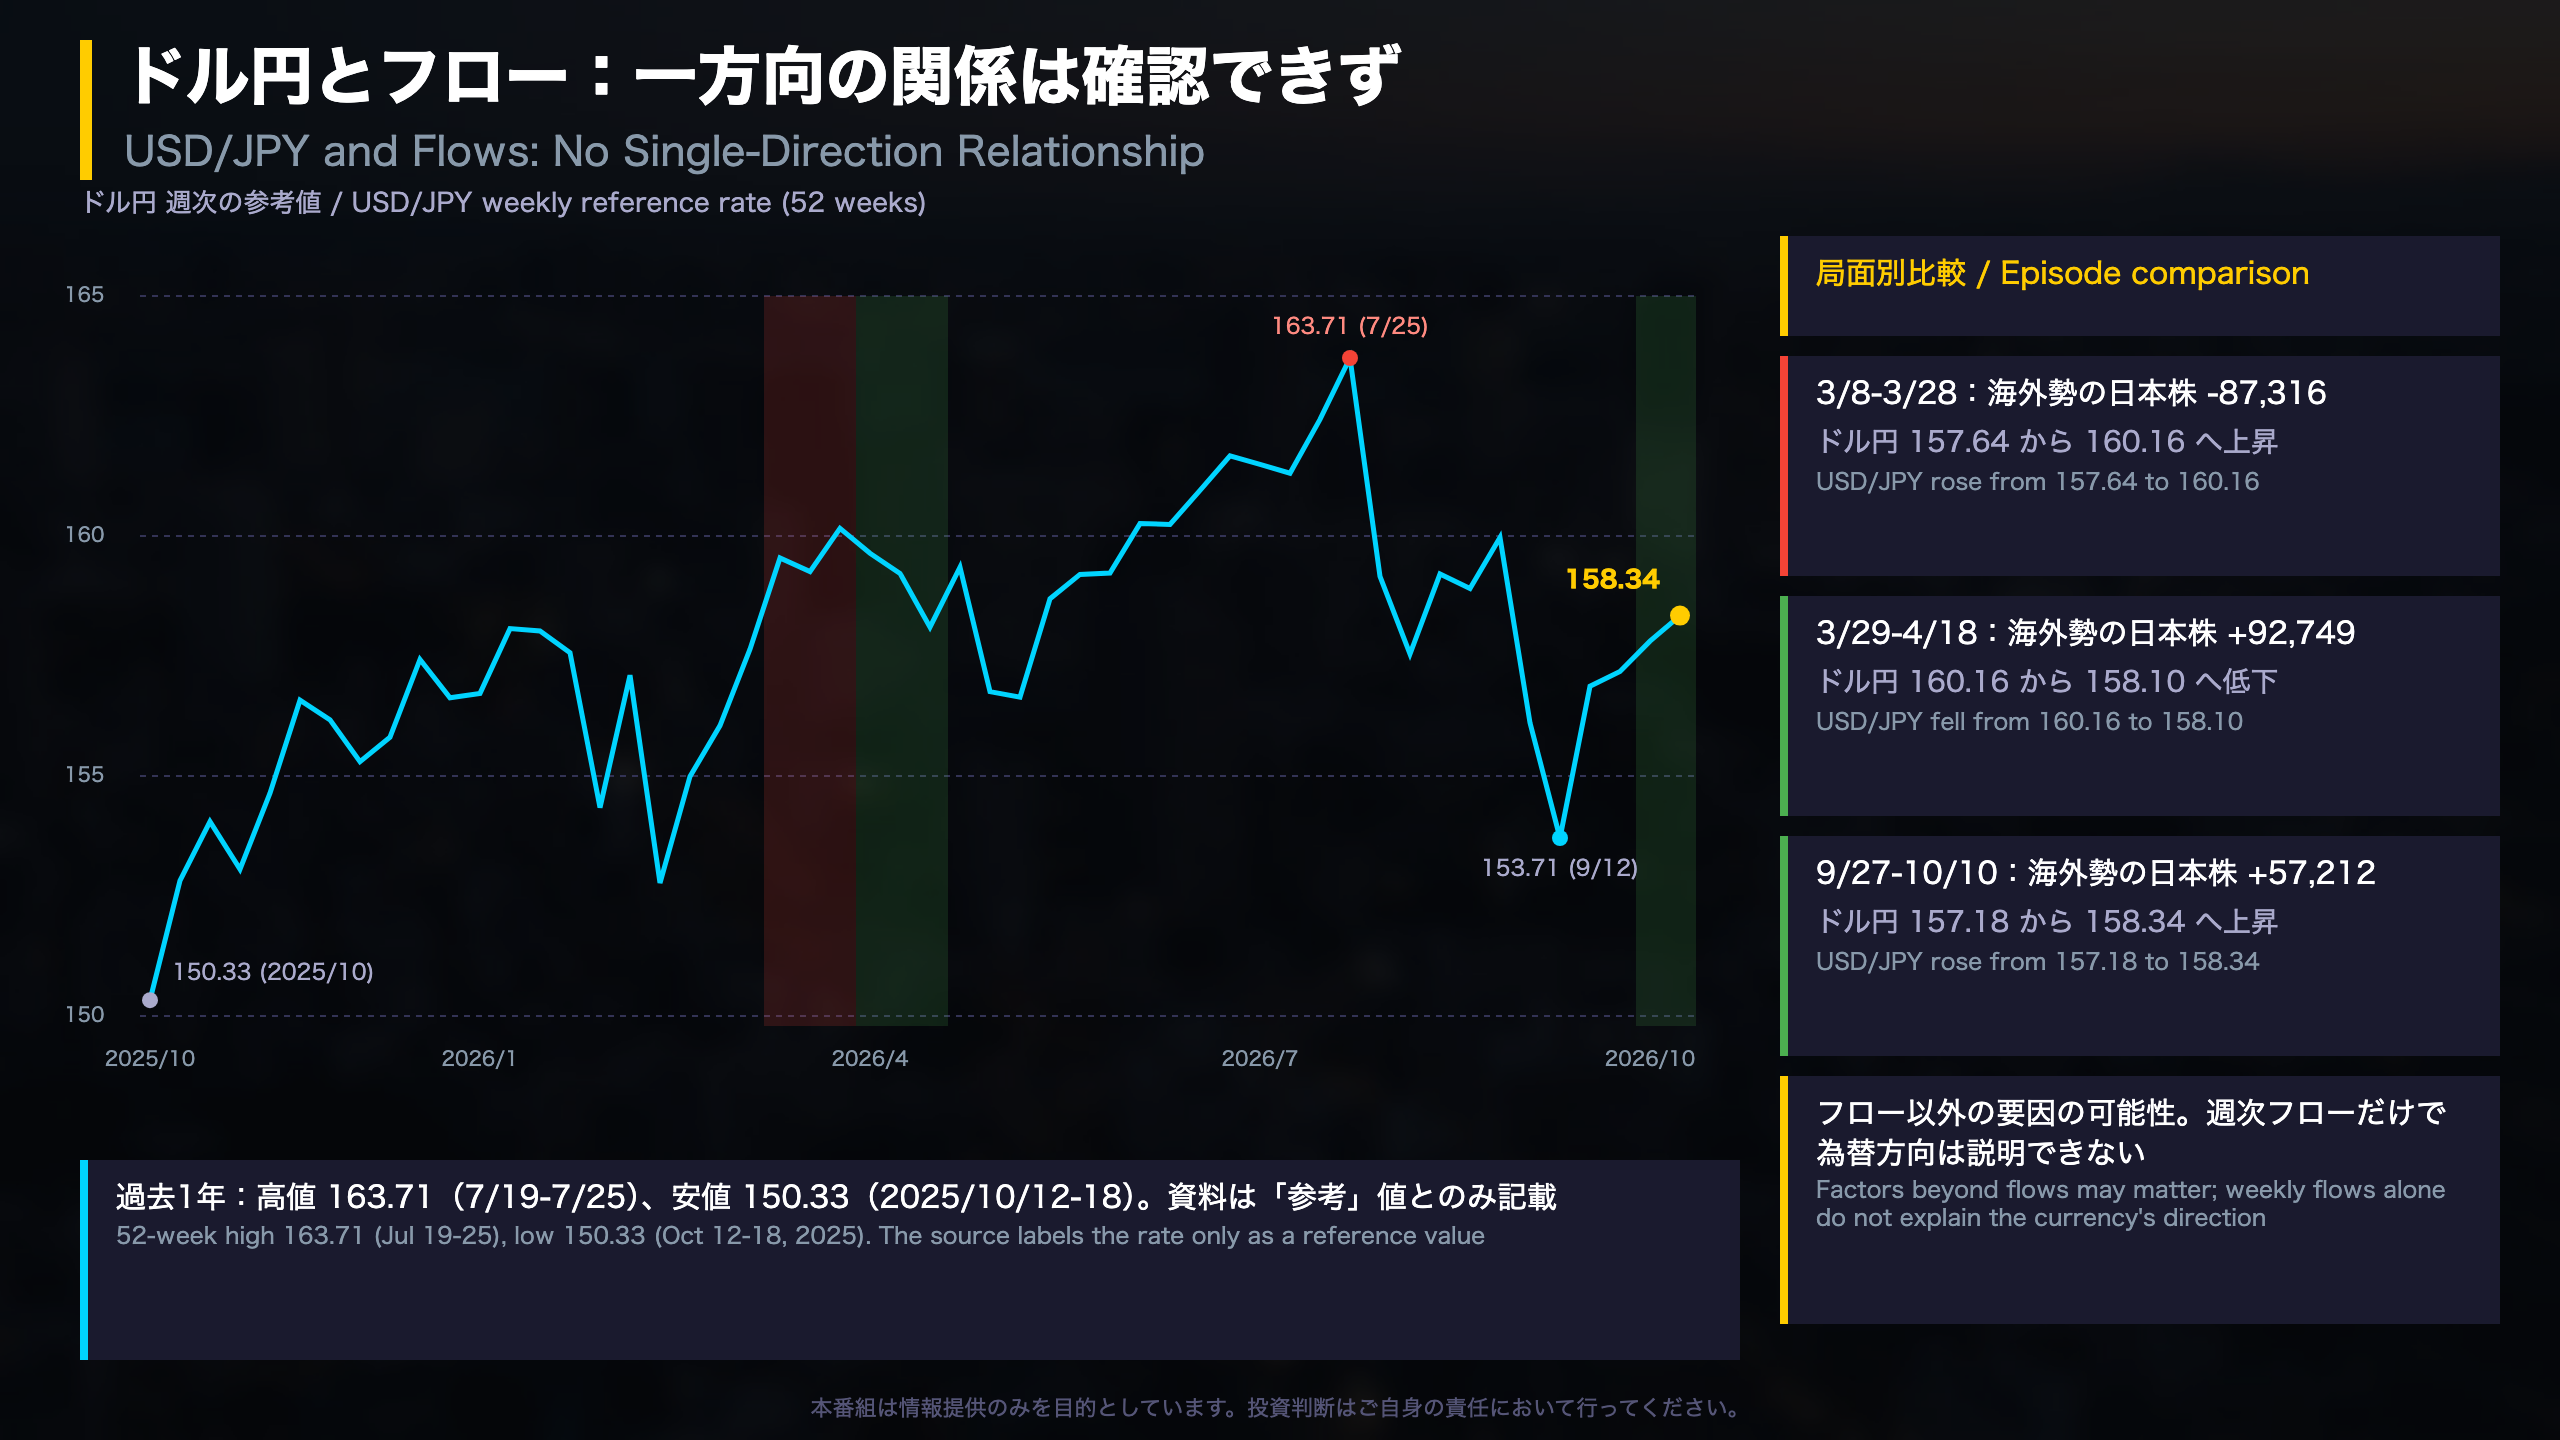
USD/JPY and Capital Flows: Why the Link Is Not Mechanical
The textbook link
In principle, foreign purchases of Japanese assets require buying yen, while Japanese residents’ purchases of foreign assets require selling yen. Weekly flow data are therefore often watched alongside the exchange rate. The MOF report supplies a USD/JPY “reference” rate (158.34 this week), but does not define the observation time.
What the 52-week data show
- High: 163.71 (week of Jul 19-25)
- Low: 150.33 (week of Oct 12-18, 2025)
- Latest: 158.34, up 4.63 yen from 153.71 four weeks ago (week of Sep 12)
Episode comparison
| Episode | Foreign net flow, Japan stocks | USD/JPY |
|---|---|---|
| Mar 8-28 (3 wks) | -87,316 | 157.64 to 160.16 |
| Mar 29-Apr 18 (3 wks) | +92,749 | 160.16 to 158.10 |
| Sep 6-26 (3 wks) | -68,171 | 156.11 to 157.18 |
| Sep 27-Oct 10 (2 wks) | +57,212 | 157.18 to 158.34 |
In spring, selling coincided with a weaker yen and buying with a firmer yen. In September-October the pattern is less clear: the dollar rose during both the selling and the buying phases.
Interpretation
- The data do not support a simple one-to-one relationship between weekly equity flows and the exchange rate.
- Other drivers, such as interest rate differentials between the Bank of Japan and the US Federal Reserve, may matter. The source does not discuss them, so we do not draw conclusions.
What to watch
Whether the direction of flows and the currency align over the next several weeks. A single week is too short to judge, so cumulative multi-week totals are more informative.
まとめ:強さと不確実性の併存、次に確認する指標
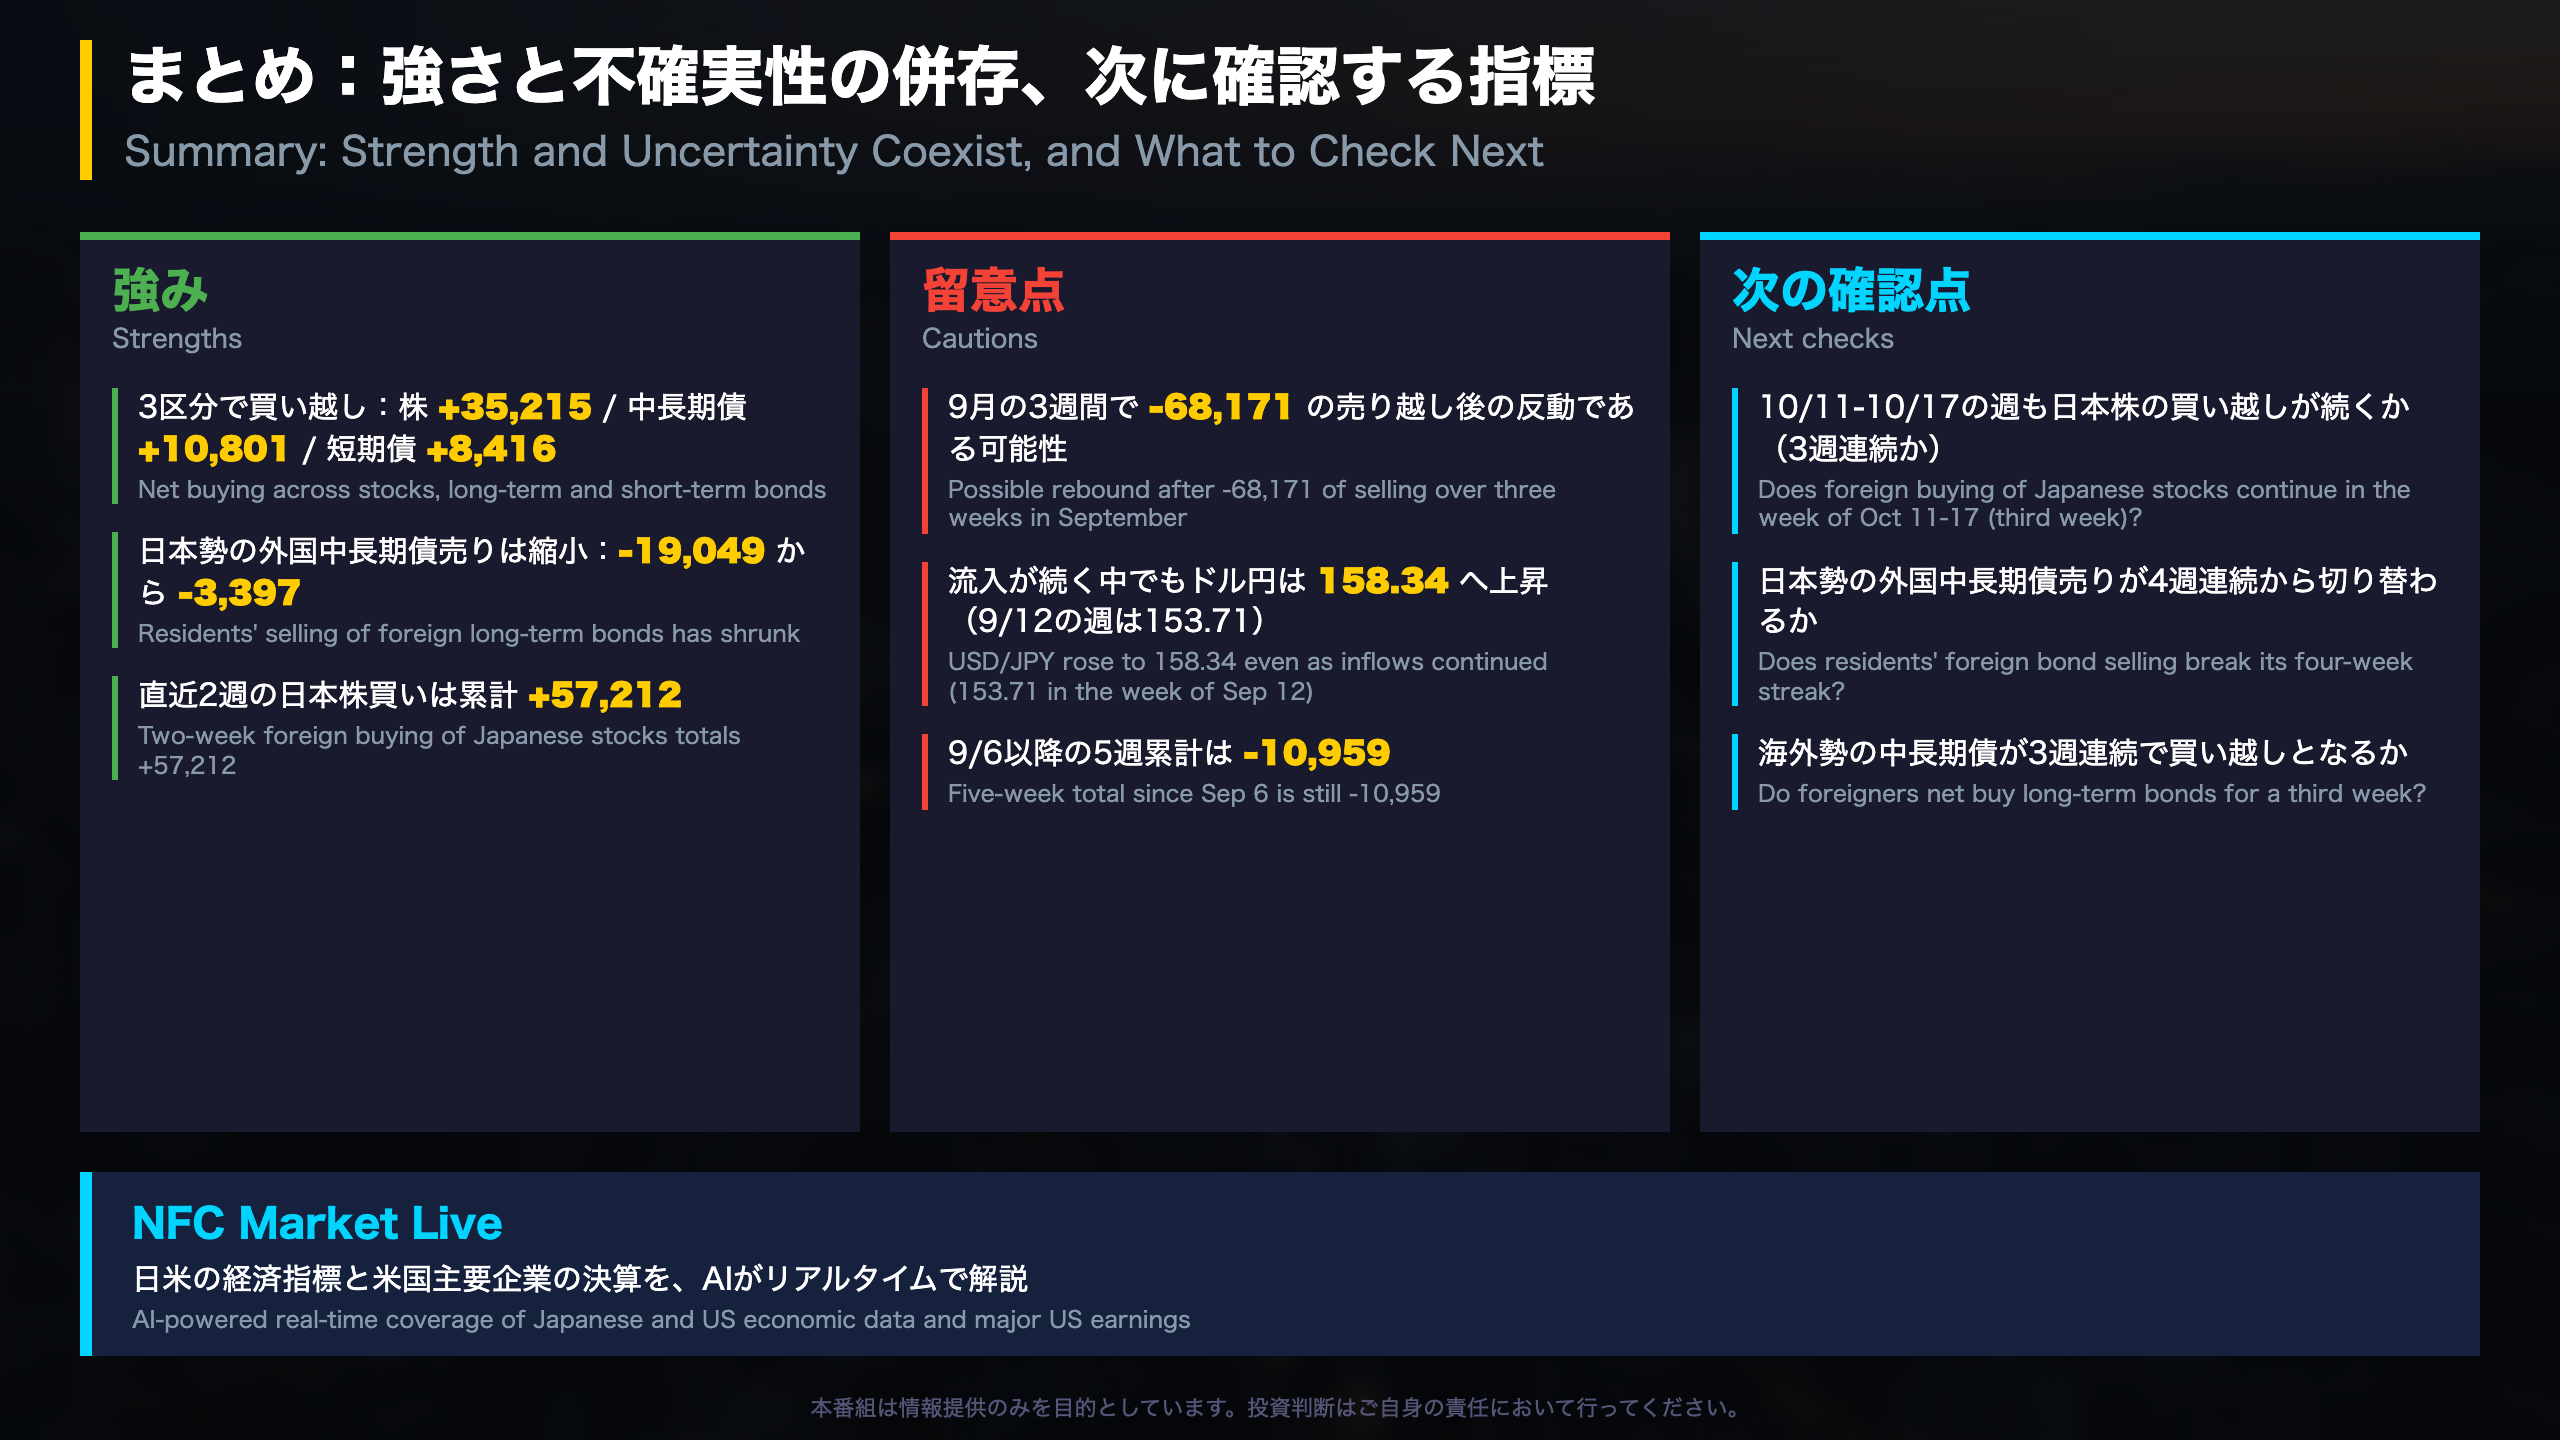
Summary: Strength and Uncertainty Side by Side
The constructive case
- Non-residents net bought Japanese stocks (+35,215), long-term bonds (+10,801) and short-term bonds (+8,416) in the same week.
- Japanese residents’ net sales of foreign long-term bonds shrank from -19,049 to -3,397.
- Foreign buying of Japanese stocks over the last two weeks totals +57,212.
The cautious case
- The buying follows -68,171 over Sep 6-26; the five-week total is still -10,959.
- Residents have sold foreign long-term bonds four weeks in a row (-32,726 in total).
- USD/JPY rose from 153.71 (week of Sep 12) to 158.34 even as inflows resumed.
Checklist for the next report
| Item | Current | What to check |
|---|---|---|
| Foreign buying of Japanese stocks | 2 straight weeks | A third week? |
| Residents’ foreign long-term bonds | 4 straight weeks of selling | Continue or reverse? |
| Foreign buying of Japanese long-term bonds | 2 straight weeks | Compare with +22,402 (Sep 6-12) |
| USD/JPY | 158.34 | Distance from 52-week high of 163.71 |
Context for global readers
This MOF series covers contract-based transactions and is released weekly. It is less smoothed than monthly balance-of-payments or US TIC data, so a single strong week should be weighed against the recent range. In the spring, three straight weeks of buying (+92,749) offset prior selling; in the current episode, the offset is not yet complete.
Next report
It covers the week of Oct 11-17. The data themselves make no prediction about market direction; the checklist above simply lists what can be verified.
Disclaimer: This article is for informational purposes only. All investment decisions are made solely at your own risk.