This article was automatically generated by the NFC Market Live AI analysis system. (Updated: 2026-10-15 21:44 JST)
📄 Primary Source
NFC Market Live
https://www.philadelphiafed.org/surveys-and-data/regional-economic-analysis/mbos-2026-10
📊 A breakdown of the Philadelphia Fed’s October Manufacturing Business Outlook Survey.
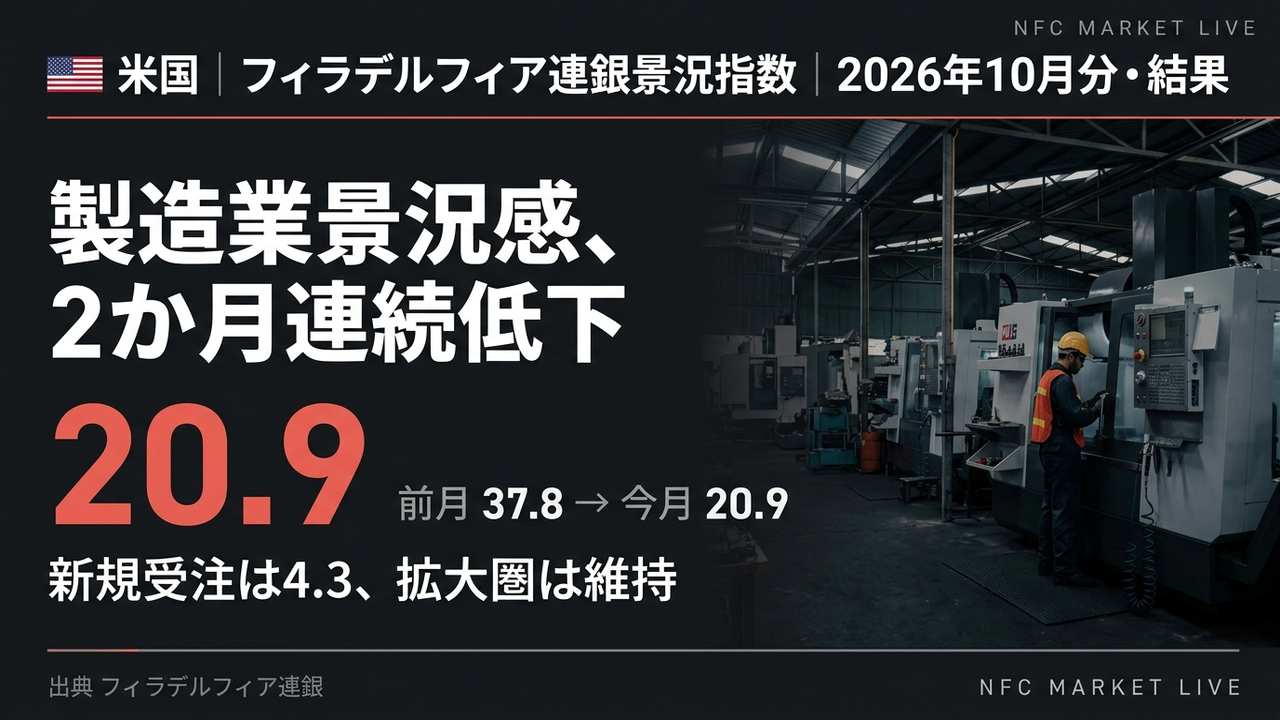
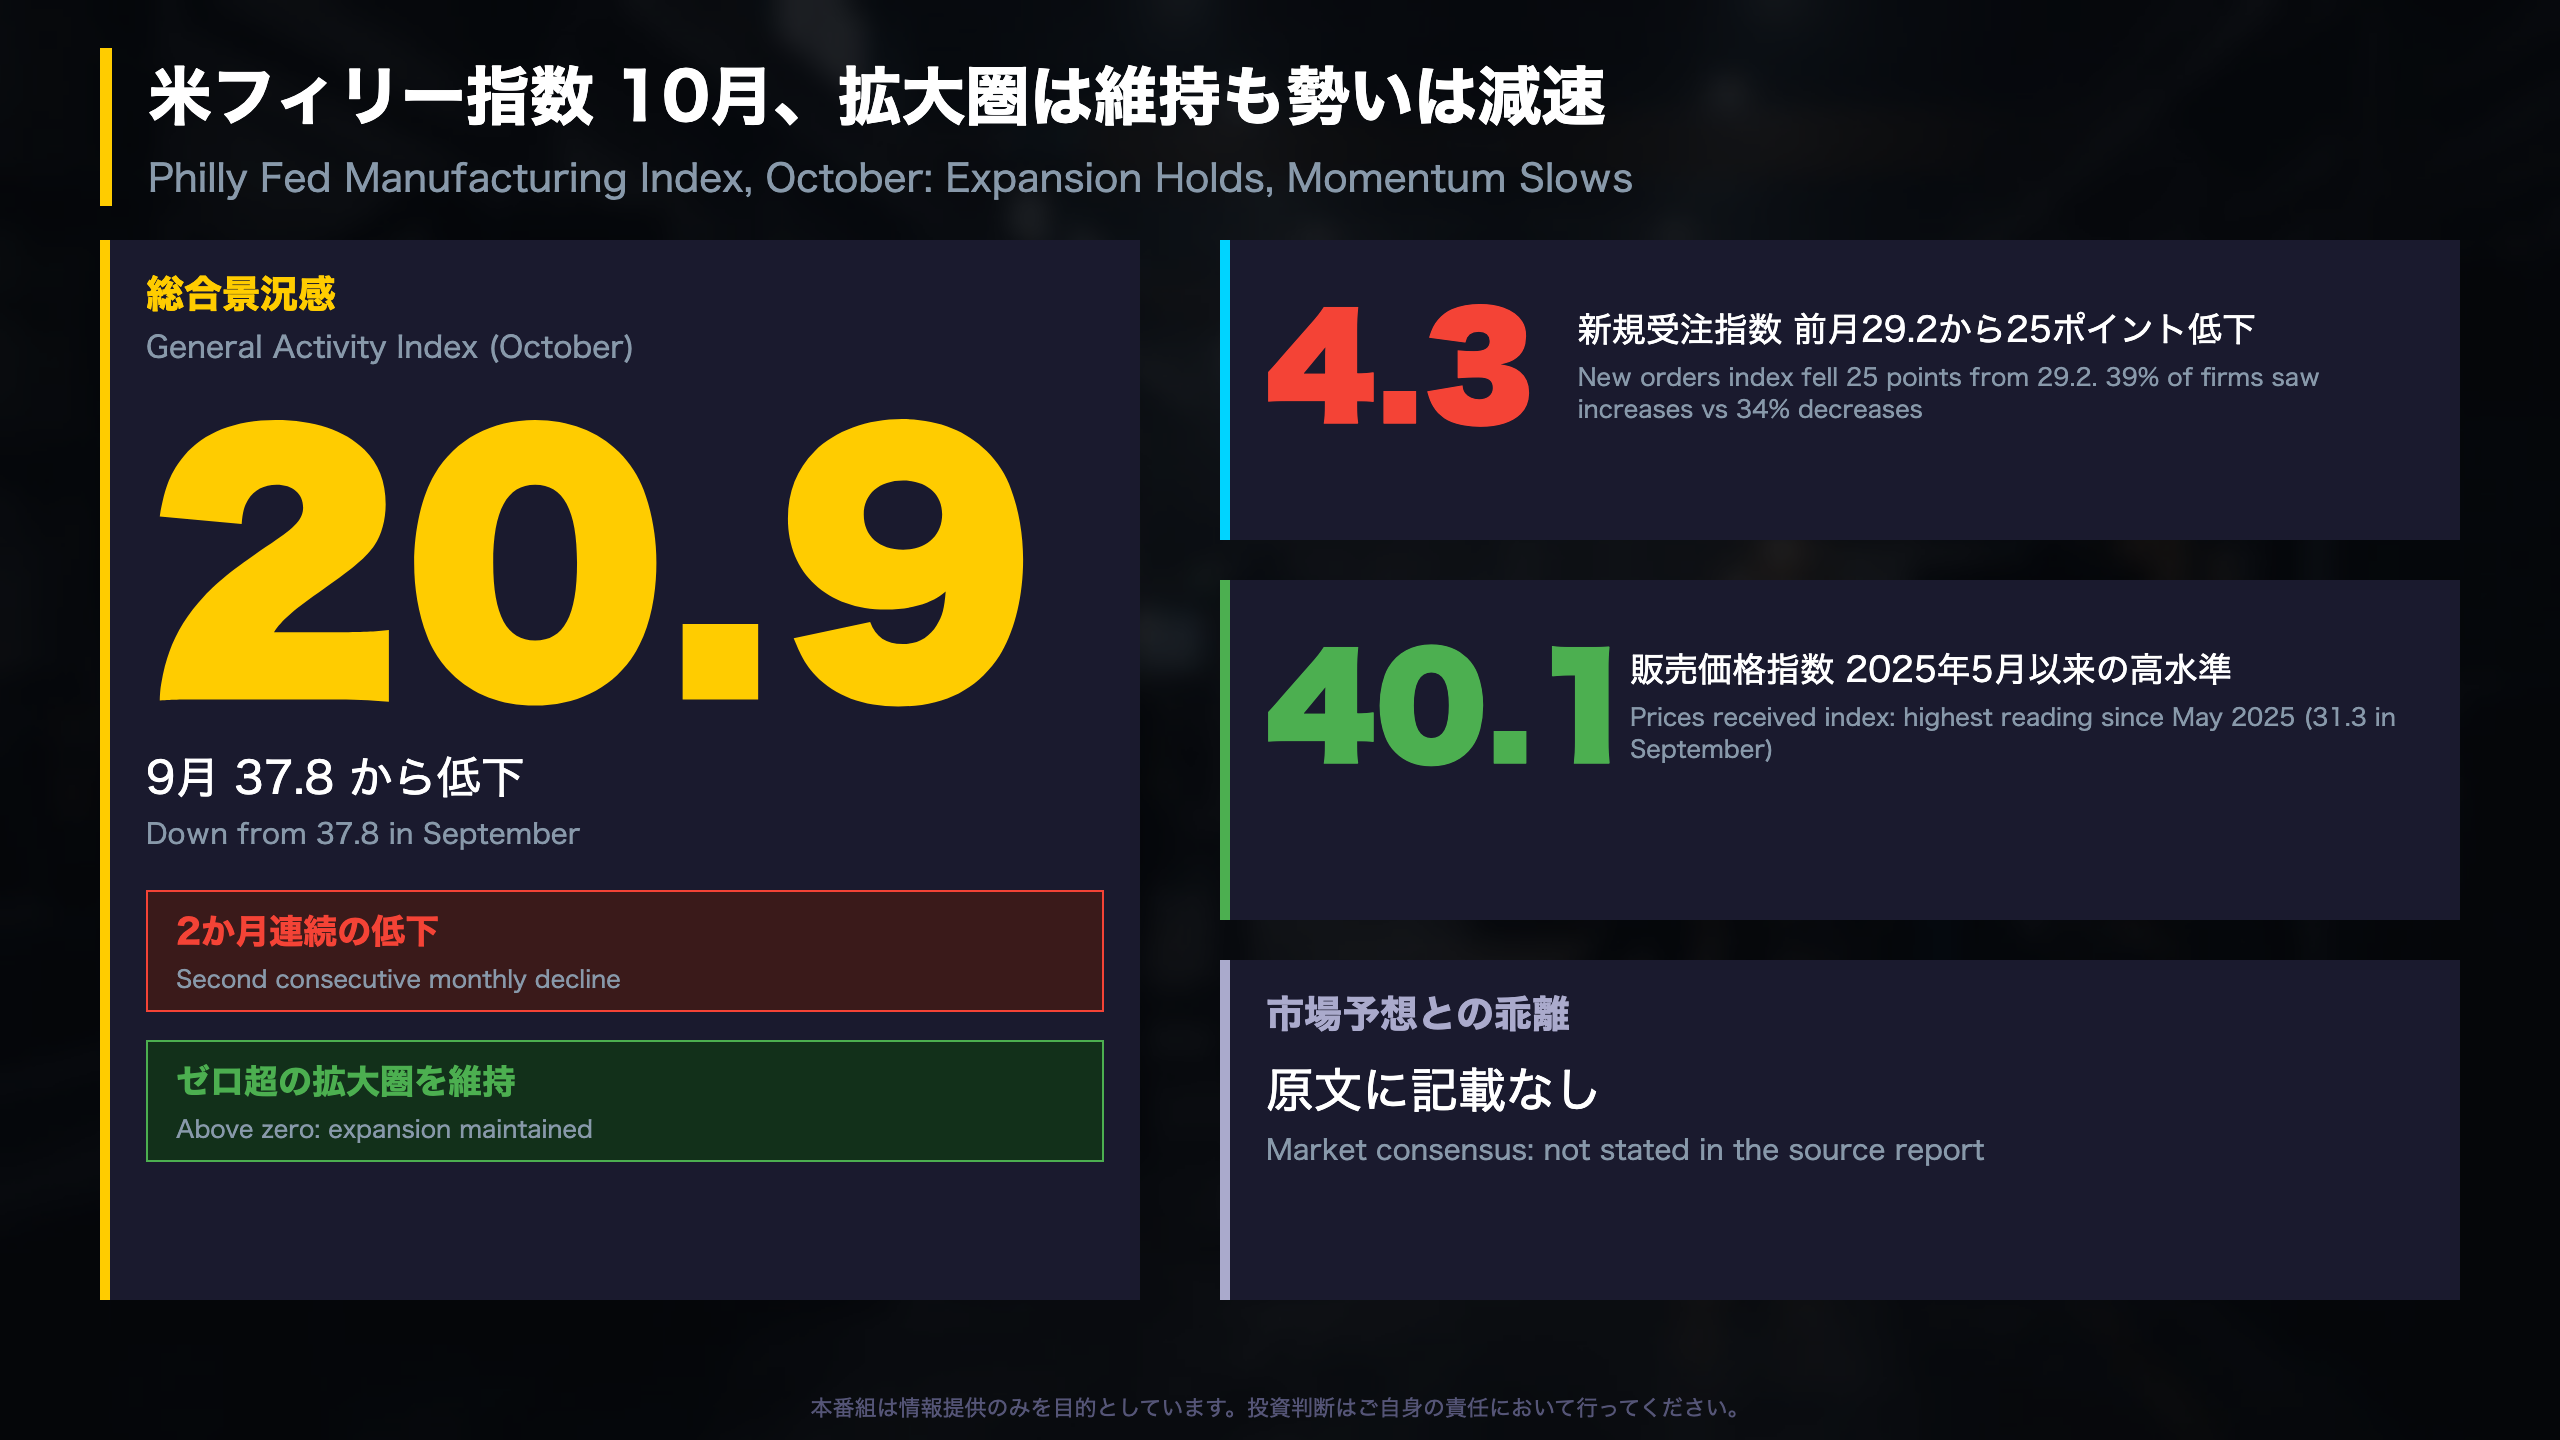
General activity fell to 20.9 from 37.8, a second straight decline, yet stayed above zero. New orders slowed to 4.3, while prices received rose to 40.1, the highest since May 2025.
💡 52% of firms plan higher capital spending next year; none plan lower.
⚠️ Future general activity fell to 33.0, its lowest since January.
📅 Next: the November survey. No market consensus is given in the report.
拡大圏は維持、勢いは減速
What the October Philly Fed Survey Says
The Manufacturing Business Outlook Survey (MBOS) is a monthly poll of manufacturers in the Third Federal Reserve District, which covers eastern Pennsylvania, southern New Jersey and Delaware. It is published by the Federal Reserve Bank of Philadelphia and is one of the earliest regional readings on US factory conditions each month. Responses for the October edition were collected from October 5 to 12, and the report was released on October 15 at 8:30 a.m. ET.
Headline numbers
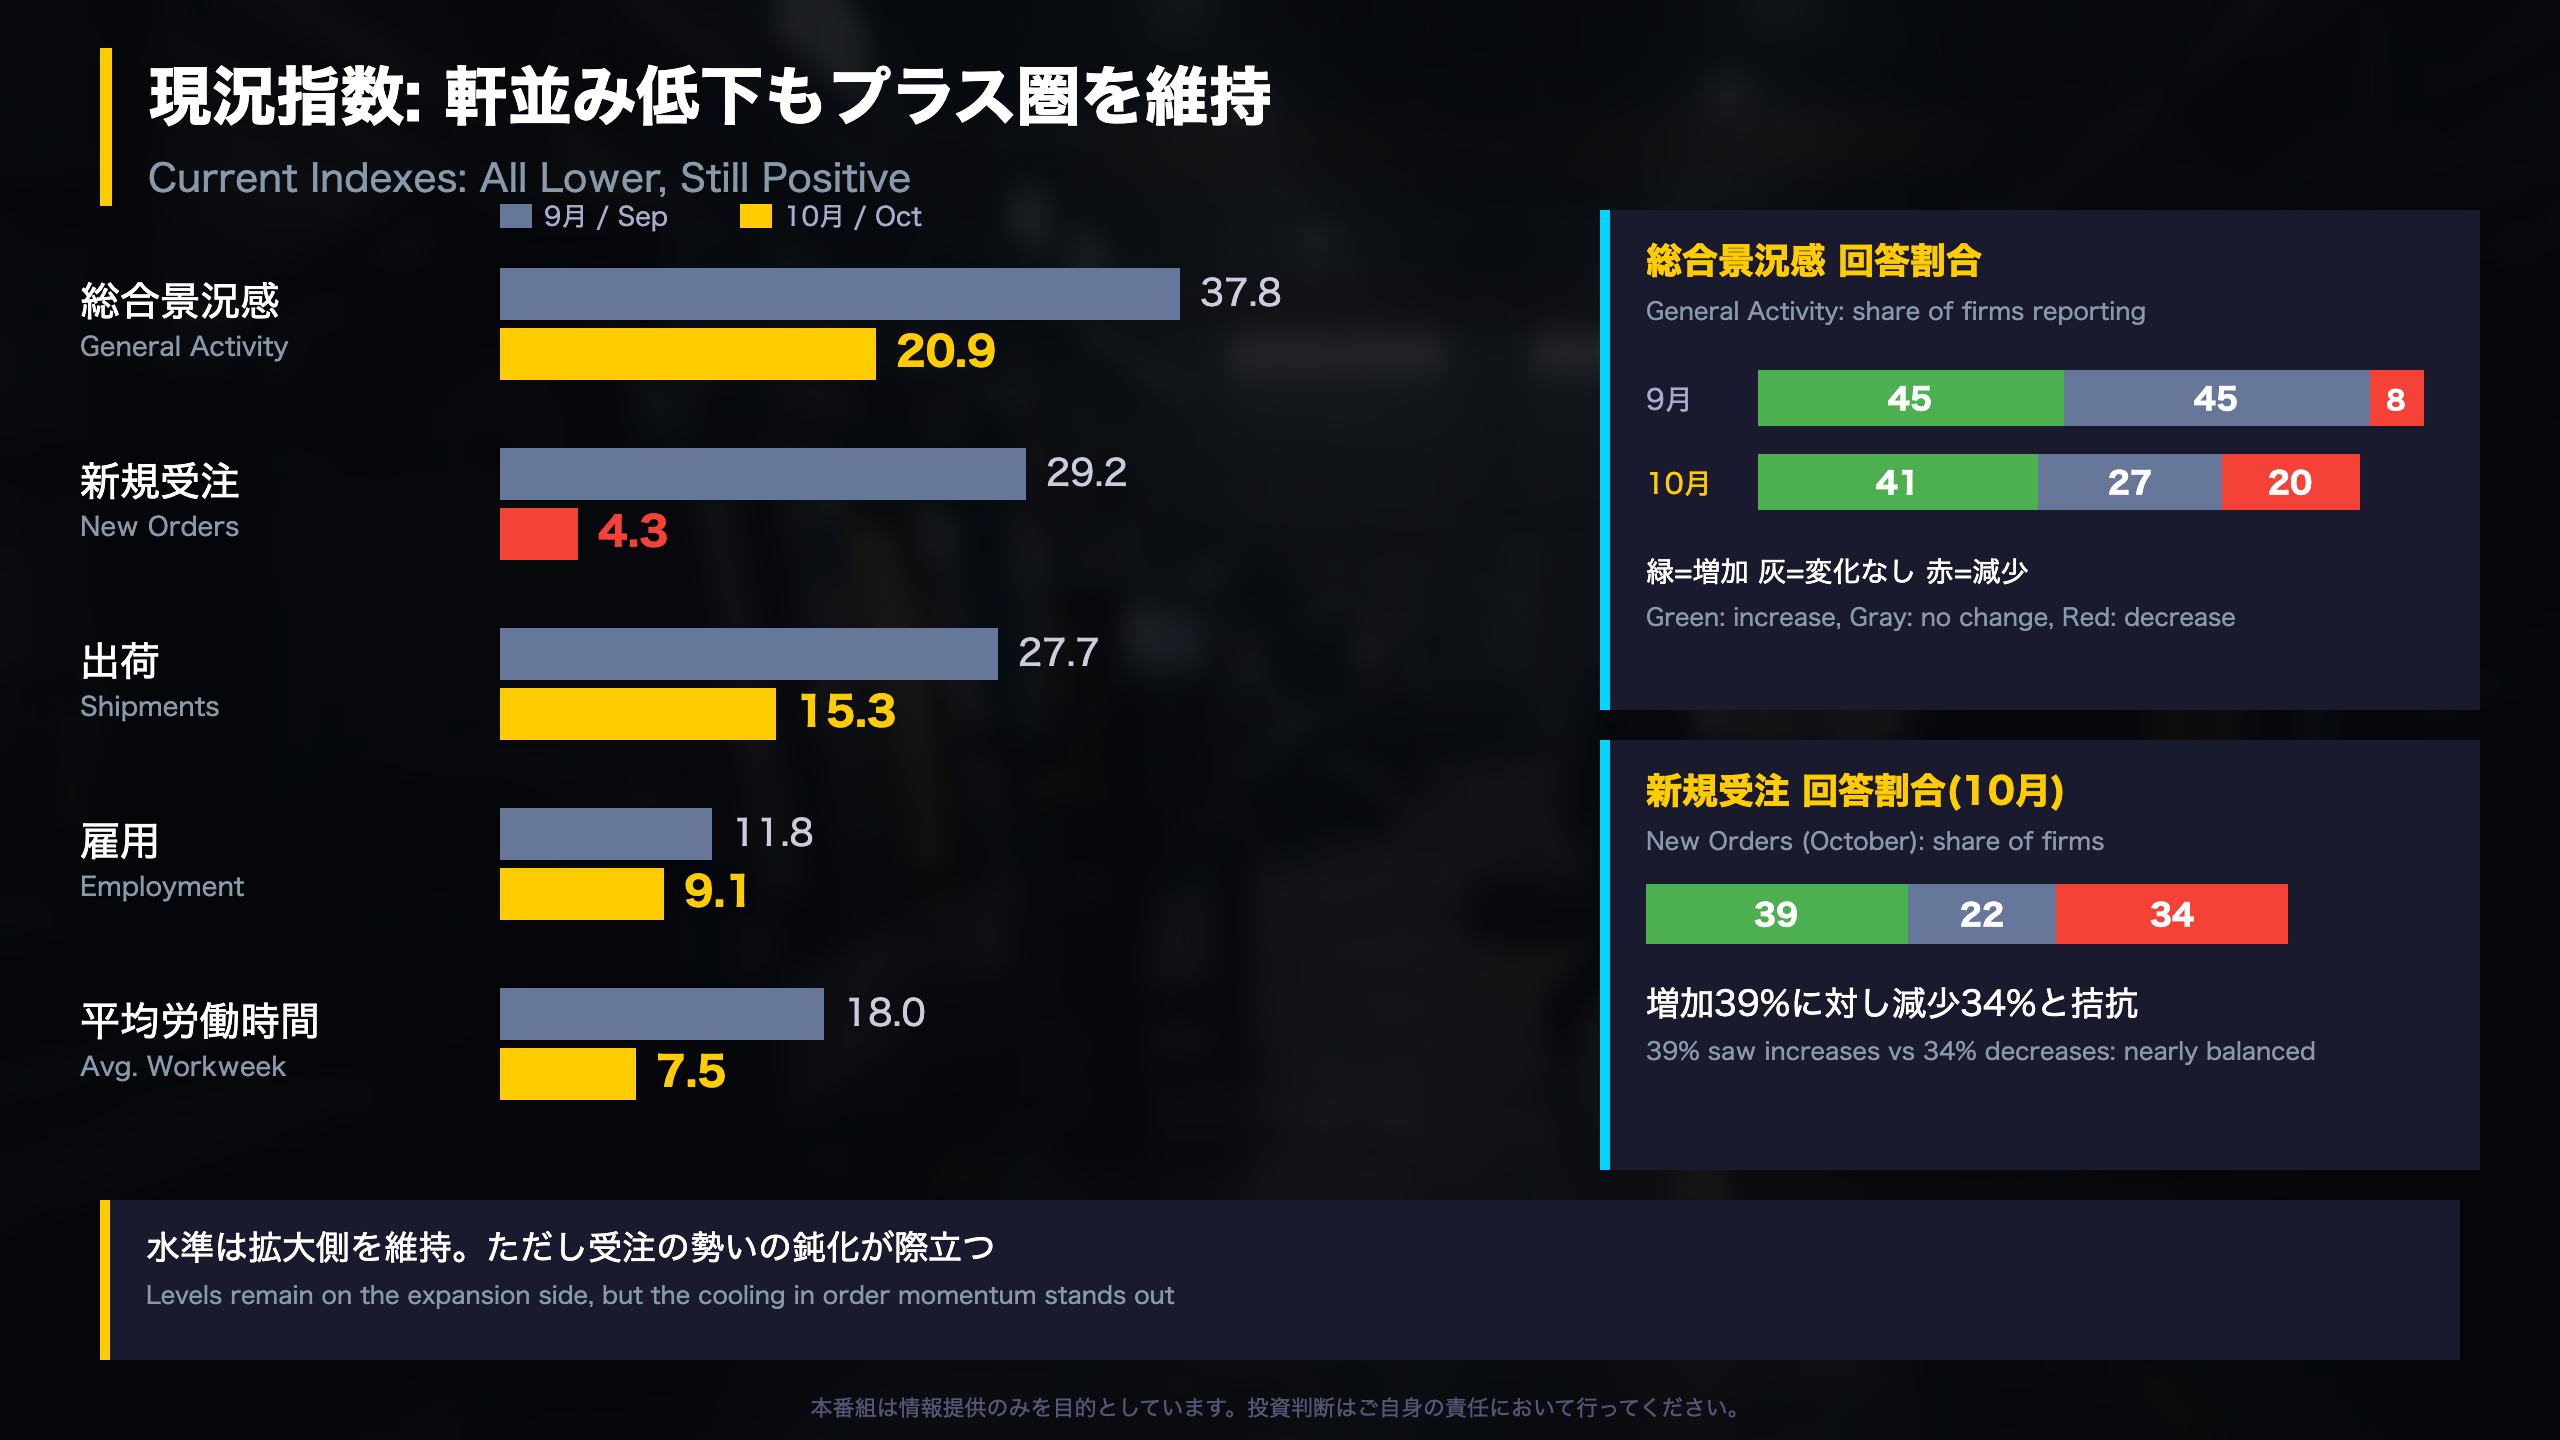
- General activity: 20.9, down from 37.8 (second straight decline)
- New orders: 4.3, down from 29.2
- Shipments: 15.3, down from 27.7
- Prices received: 40.1, up from 31.3 and the highest since May 2025
How to read a diffusion index
Each index is the share of firms reporting an increase minus the share reporting a decrease, seasonally adjusted. A reading above zero means more firms see growth than contraction. That is why a drop from 37.8 to 20.9 still describes an expanding sector, only with less breadth.
Context for global readers
The survey is a regional gauge, not a national statistic. Investors usually read it alongside the New York Fed’s Empire State survey and the national ISM manufacturing index; neither is included in the source report, so no comparison is made here. The report also provides no market consensus.
What to watch
The split on new orders (39% up, 34% down) is the item to track in the November survey. A single month does not establish a trend.
現況指数: 軒並み低下もプラス圏
Inside the Current-Conditions Indexes
The October Philadelphia Fed Manufacturing Business Outlook Survey reports a diffusion index for each current-conditions question, defined as the share of firms reporting an increase minus the share reporting a decrease. Data are seasonally adjusted. Zero is the dividing line between net expansion and net contraction.
Breadth behind the headline
- General activity: 41% up, 27% unchanged, 20% down (September: 45% / 45% / 8%). The shrinking unchanged group and the rise in decliners explain most of the drop.
- New orders: 39% up, 22% unchanged, 34% down. The split is close to even, which is why the index is only 4.3.
- Shipments: 15.3, with 36% up and 21% down.
- Employment: 9.1, with 18% adding and 9% cutting; 68% reported no change.
- Average workweek: 7.5, the lowest since June.
Other sub-indexes
Unfilled orders fell to 2.4 from 20.4, and delivery times to 8.5 from 26.5. Inventories were -12.8. Because several indexes moved in the same direction, they hint at easing supply-demand tightness, though one month cannot confirm it.
Context
Regional surveys such as this are often read next to the New York Fed’s Empire State survey and the national ISM manufacturing index. Those are not in the source report, so no figures are compared here.
Balanced reading
Positives: every headline current index remains above zero. Negatives: order momentum has nearly stalled by this measure. The November survey will show whether the new-orders drop was a one-month move.
価格指数: 販売価格が上昇
Price Indexes in Detail
The Philadelphia Fed’s survey asks manufacturers whether the prices they pay for inputs and receive for their own products are higher, lower or unchanged versus the prior month, and what they expect six months ahead. As with all MBOS indexes, the figure is the share reporting increases minus the share reporting decreases.
Current readings (October)
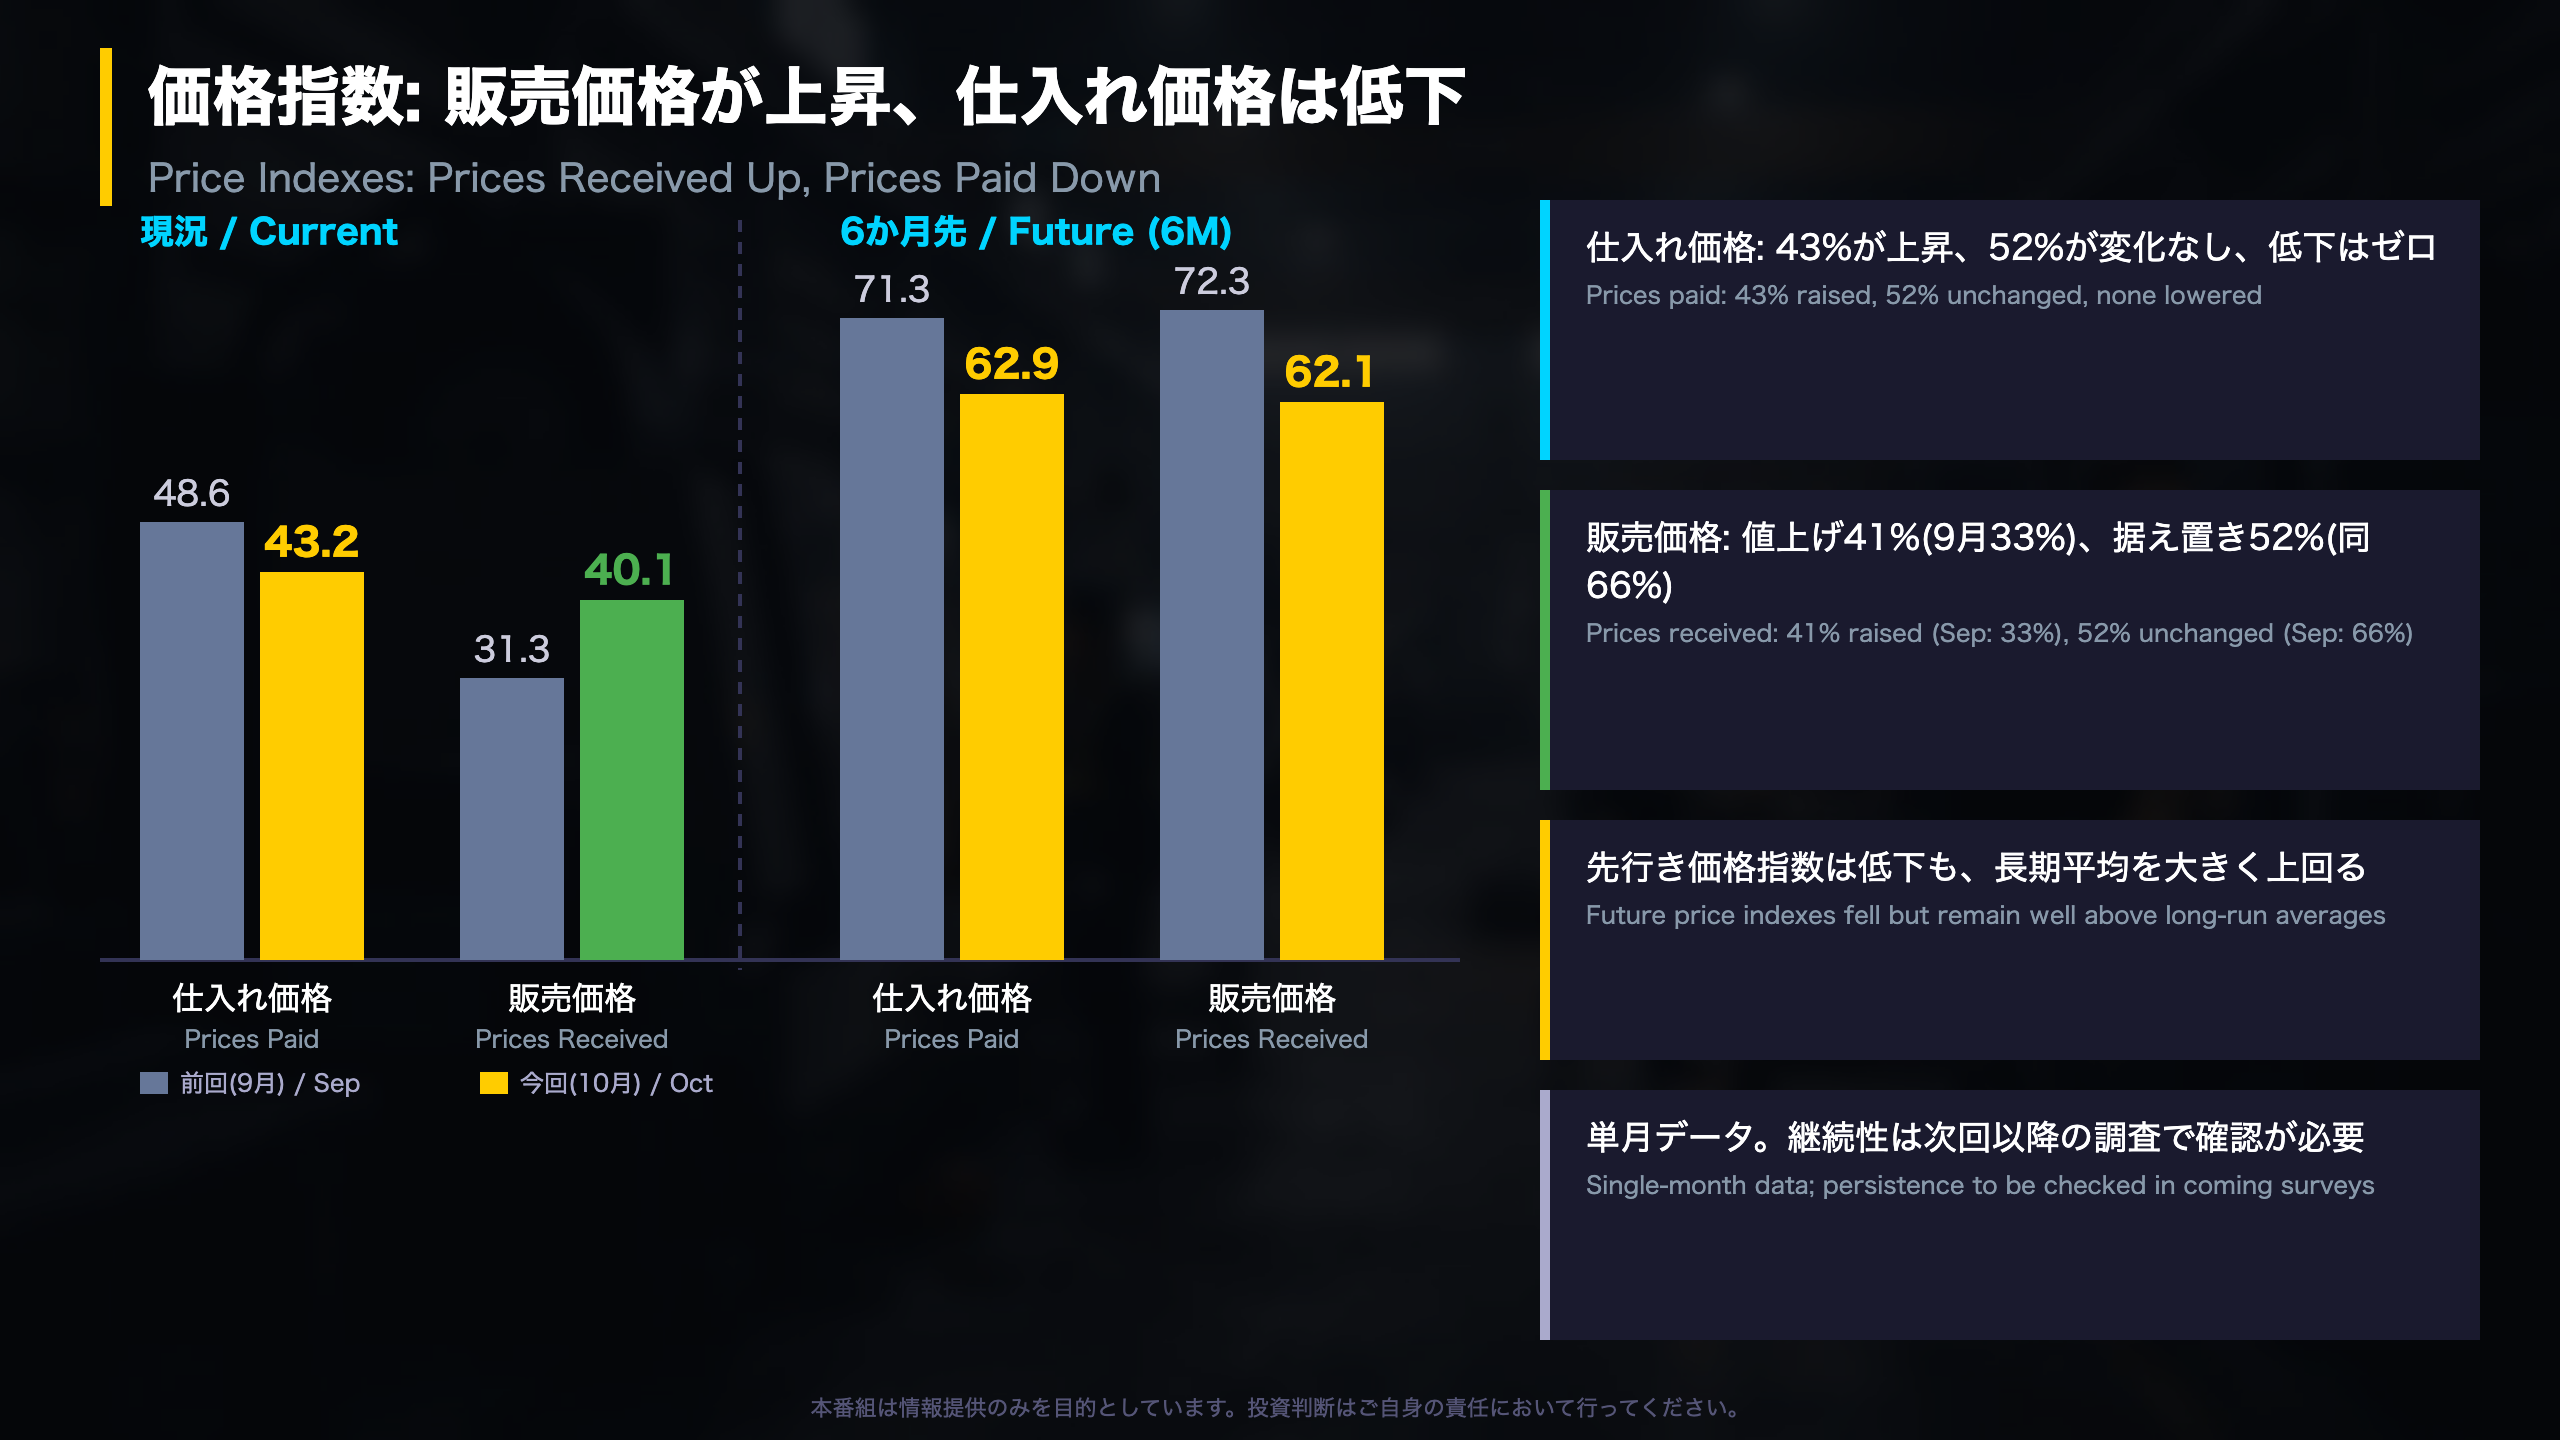
- Prices paid: 43.2 (from 48.6). 43% of firms reported higher costs, 52% no change, none reported lower.
- Prices received: 40.1 (from 31.3), the highest since May 2025. 41% raised their own prices, up from 33% in September; 52% reported no change, down from 66%.
Six-month outlook
- Future prices paid: 62.9 (from 71.3)
- Future prices received: 62.1 (from 72.3)
Both declined but, in the report’s words, remain “well above their respective long-run averages.” The long-run averages themselves are not quoted in the source.
Context
This is a regional survey of manufacturers, not a national price statistic like CPI or PPI. Investors who follow US inflation sometimes watch the prices-paid and prices-received subindexes as an early read on cost pressure and pricing power, but this report makes no link to Federal Reserve policy.
Balanced view
One reading emphasizes persistence: more firms are lifting selling prices and forward-looking indexes remain high. The other emphasizes easing: input costs and both future price indexes moved lower. A single month cannot settle the question, and the November survey is the next checkpoint.
先行き見通しと設備投資計画
Forward-Looking Indexes and the Capex Special Question
Each month the Philadelphia Fed also asks manufacturers what they expect six months ahead. These future indexes are expectations, not realized activity, so they can shift quickly with sentiment.
Six-month expectations (prior to current)
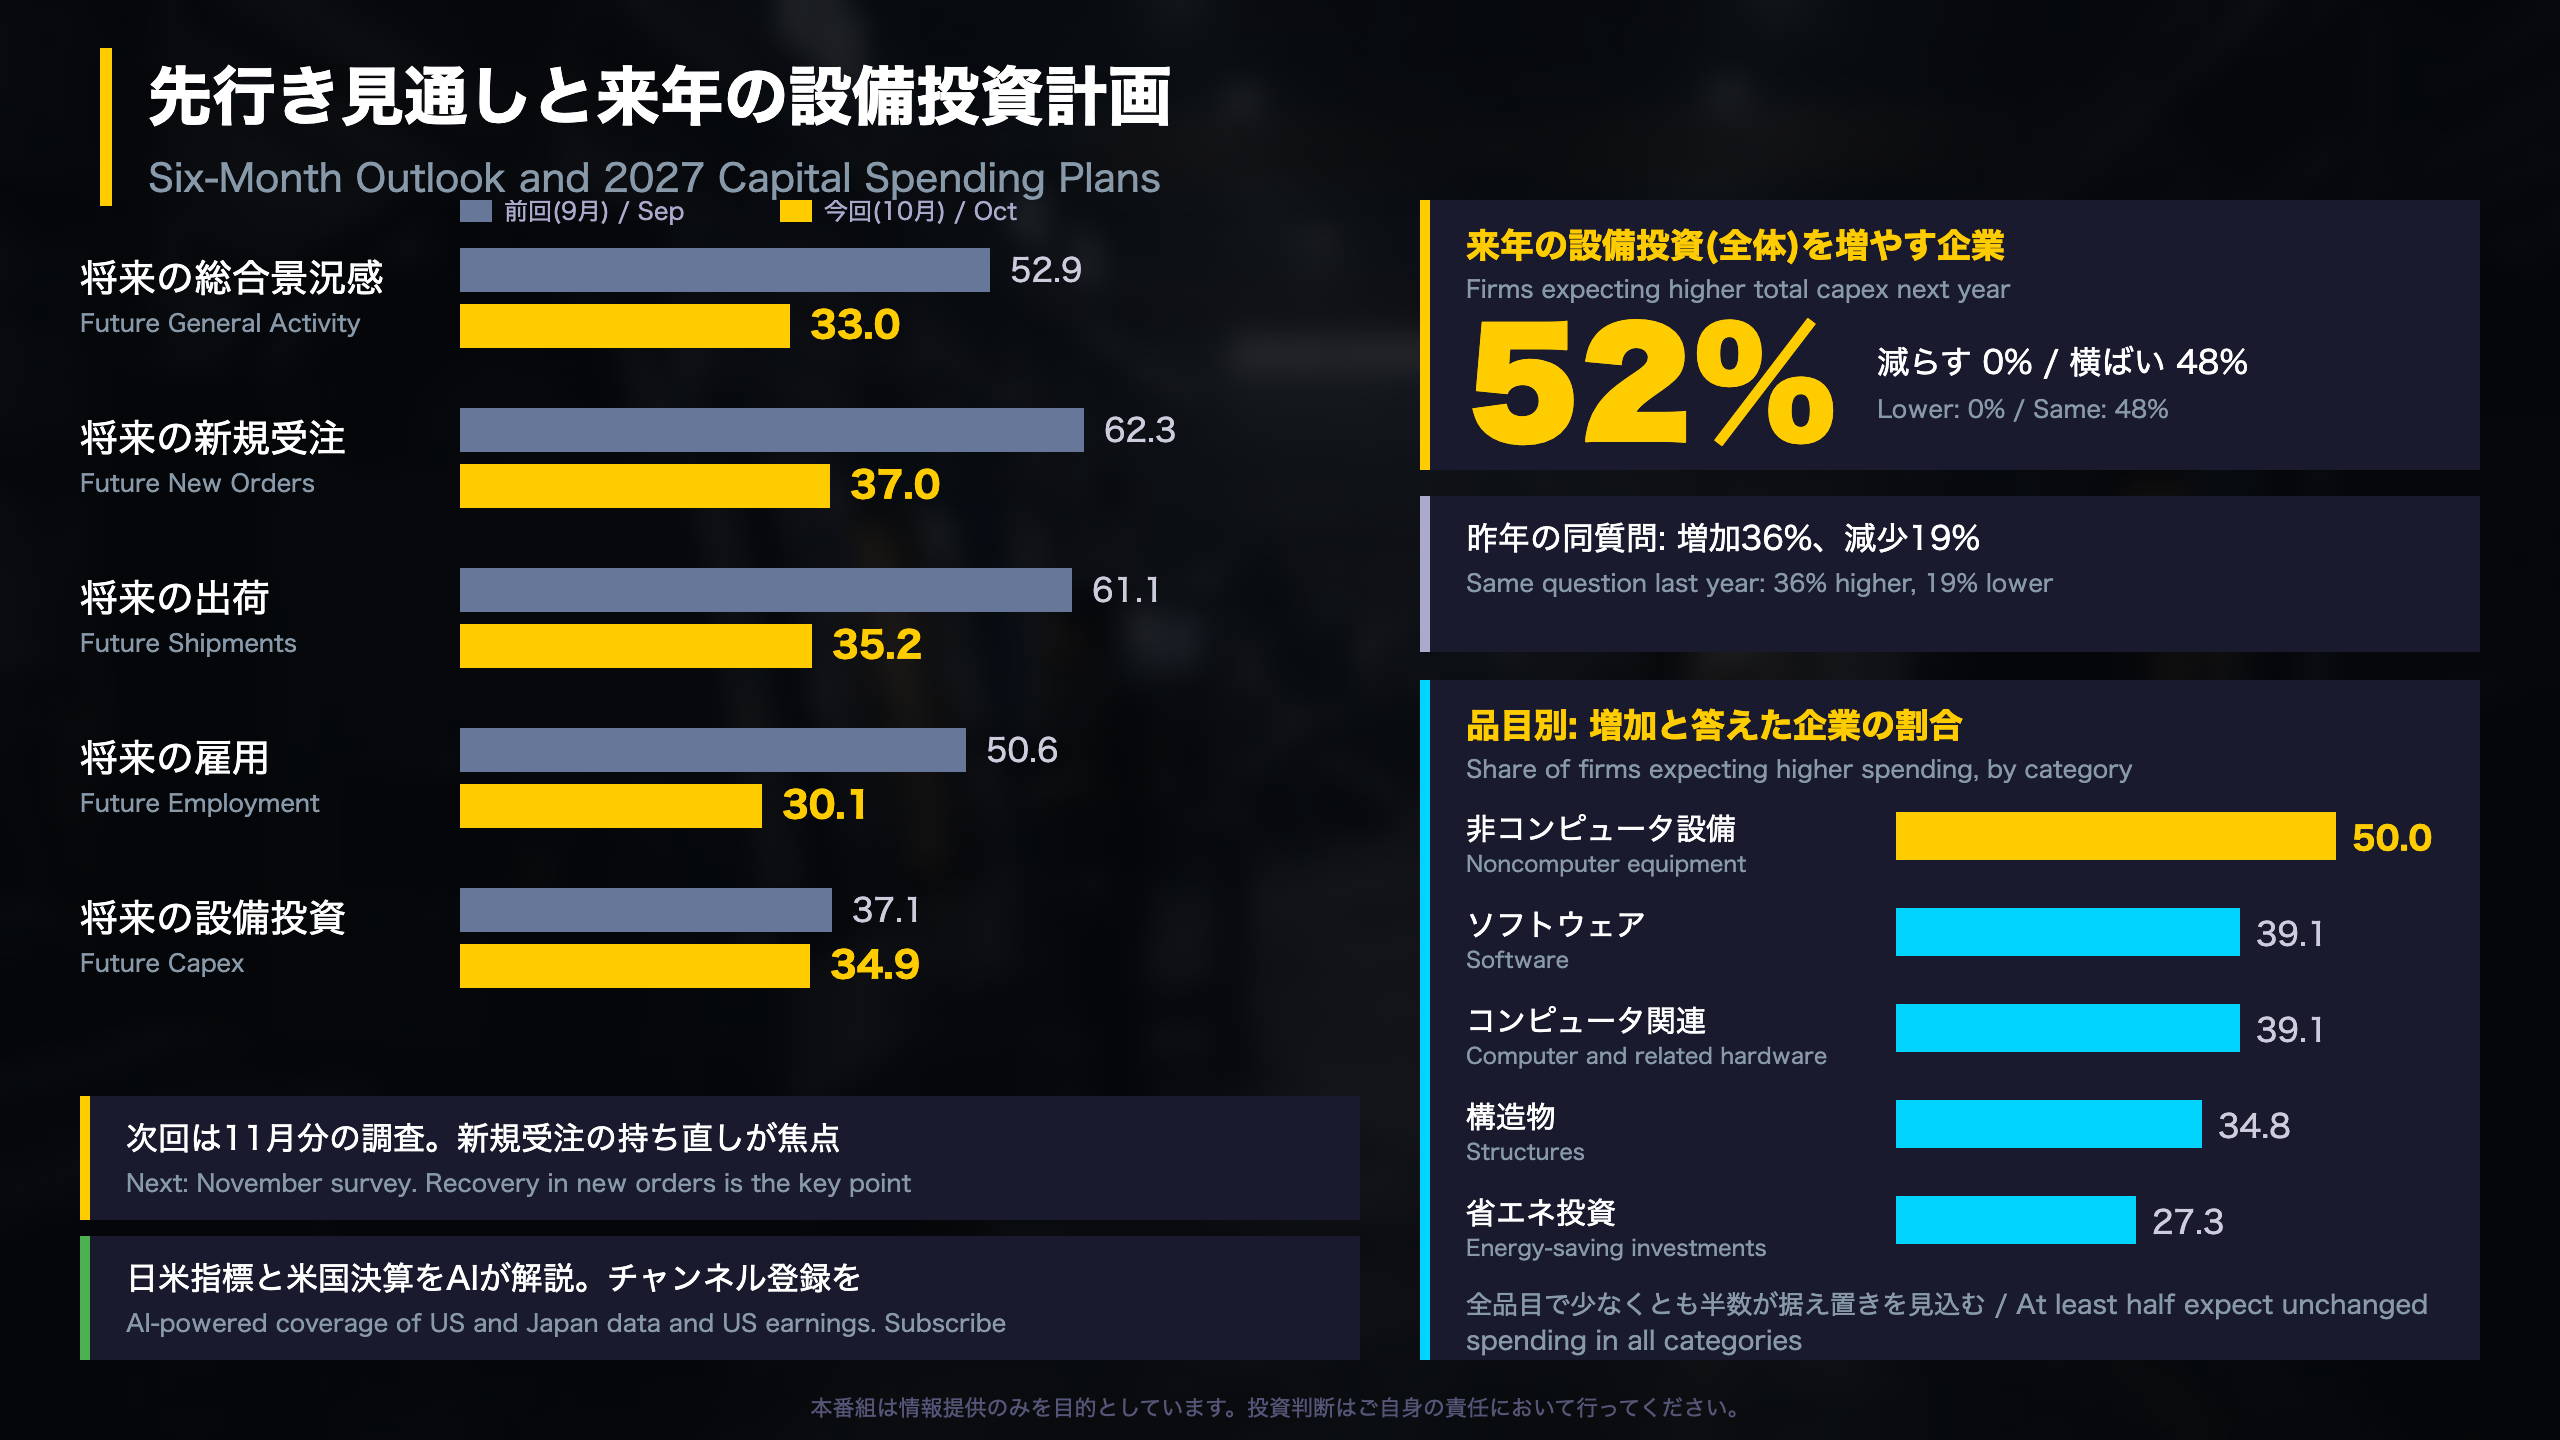
- General activity: 52.9 to 33.0, the second straight decline and lowest since January
- New orders: 62.3 to 37.0
- Shipments: 61.1 to 35.2
- Employment: 50.6 to 30.1
- Capital expenditures: 37.1 to 34.9
- Unfilled orders: 16.8 to -1.6; delivery times: 18.6 to -7.5
The report summarizes it this way: firms “continued to expect overall growth over the next six months, although those expectations were less widespread this month.”
Special question: 2027 capital spending
Of respondents, 52.2% expect higher total capital spending next year, 47.8% expect no change and none expect a decrease. A year earlier, 36% expected an increase and 19% a decrease. By category, higher spending was most widespread for noncomputer equipment (50.0%), followed by software and computer hardware (39.1% each), structures (34.8%) and energy-saving investments (27.3%). At least half of firms expect unchanged spending in every category.
Context
Capex plans are a useful gauge of business confidence, but the sample here is small, with percentages in steps of about 4.3 points, which hints at roughly 23 respondents. Treat category figures with caution.
What to watch
The November survey: whether future general activity and new orders stabilize. The report gives no policy commentary.
Disclaimer: This article is for informational purposes only. All investment decisions are made solely at your own risk.