📺 Watch the Full Video Analysis
This article was automatically generated by the NFC Market Live AI analysis system. (Updated: 2026-10-15 21:40 JST)
📄 Primary Source
Statistics Canada
https://www150.statcan.gc.ca/n1/daily-quotidien/260915/dq260915b-eng.htm
📊 A look at Statistics Canada’s July wholesale trade release, published September 15.
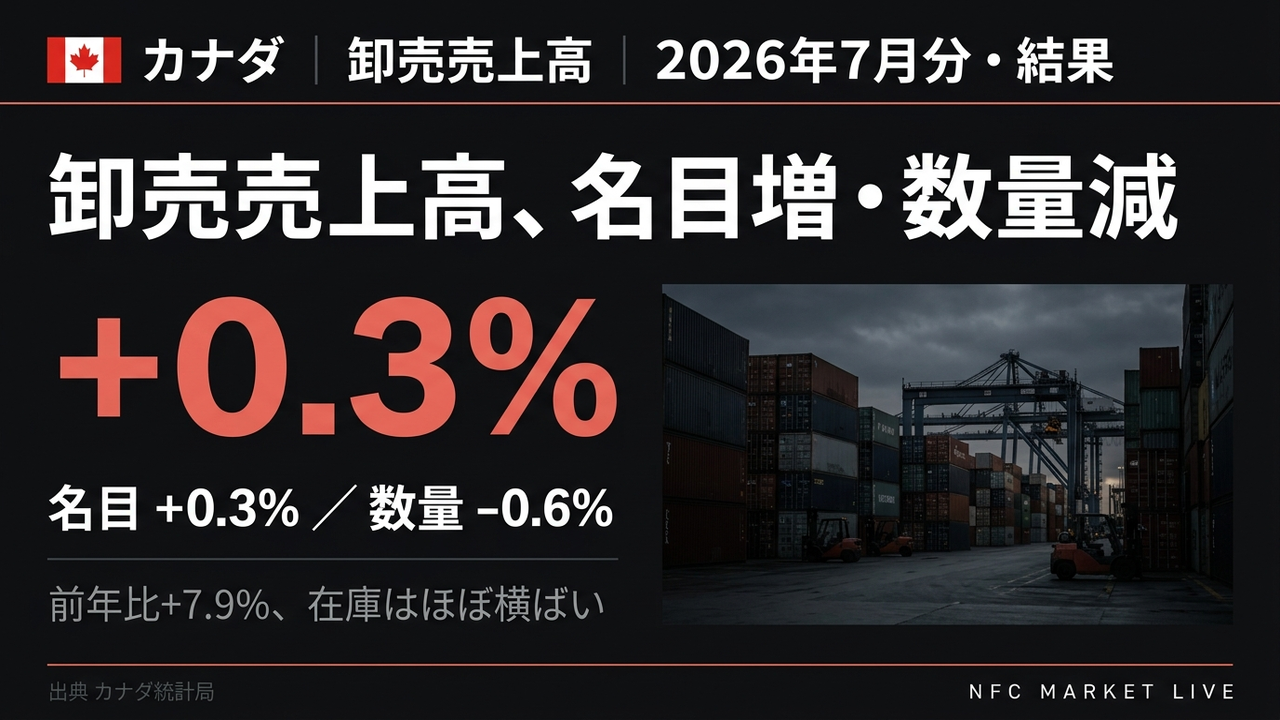
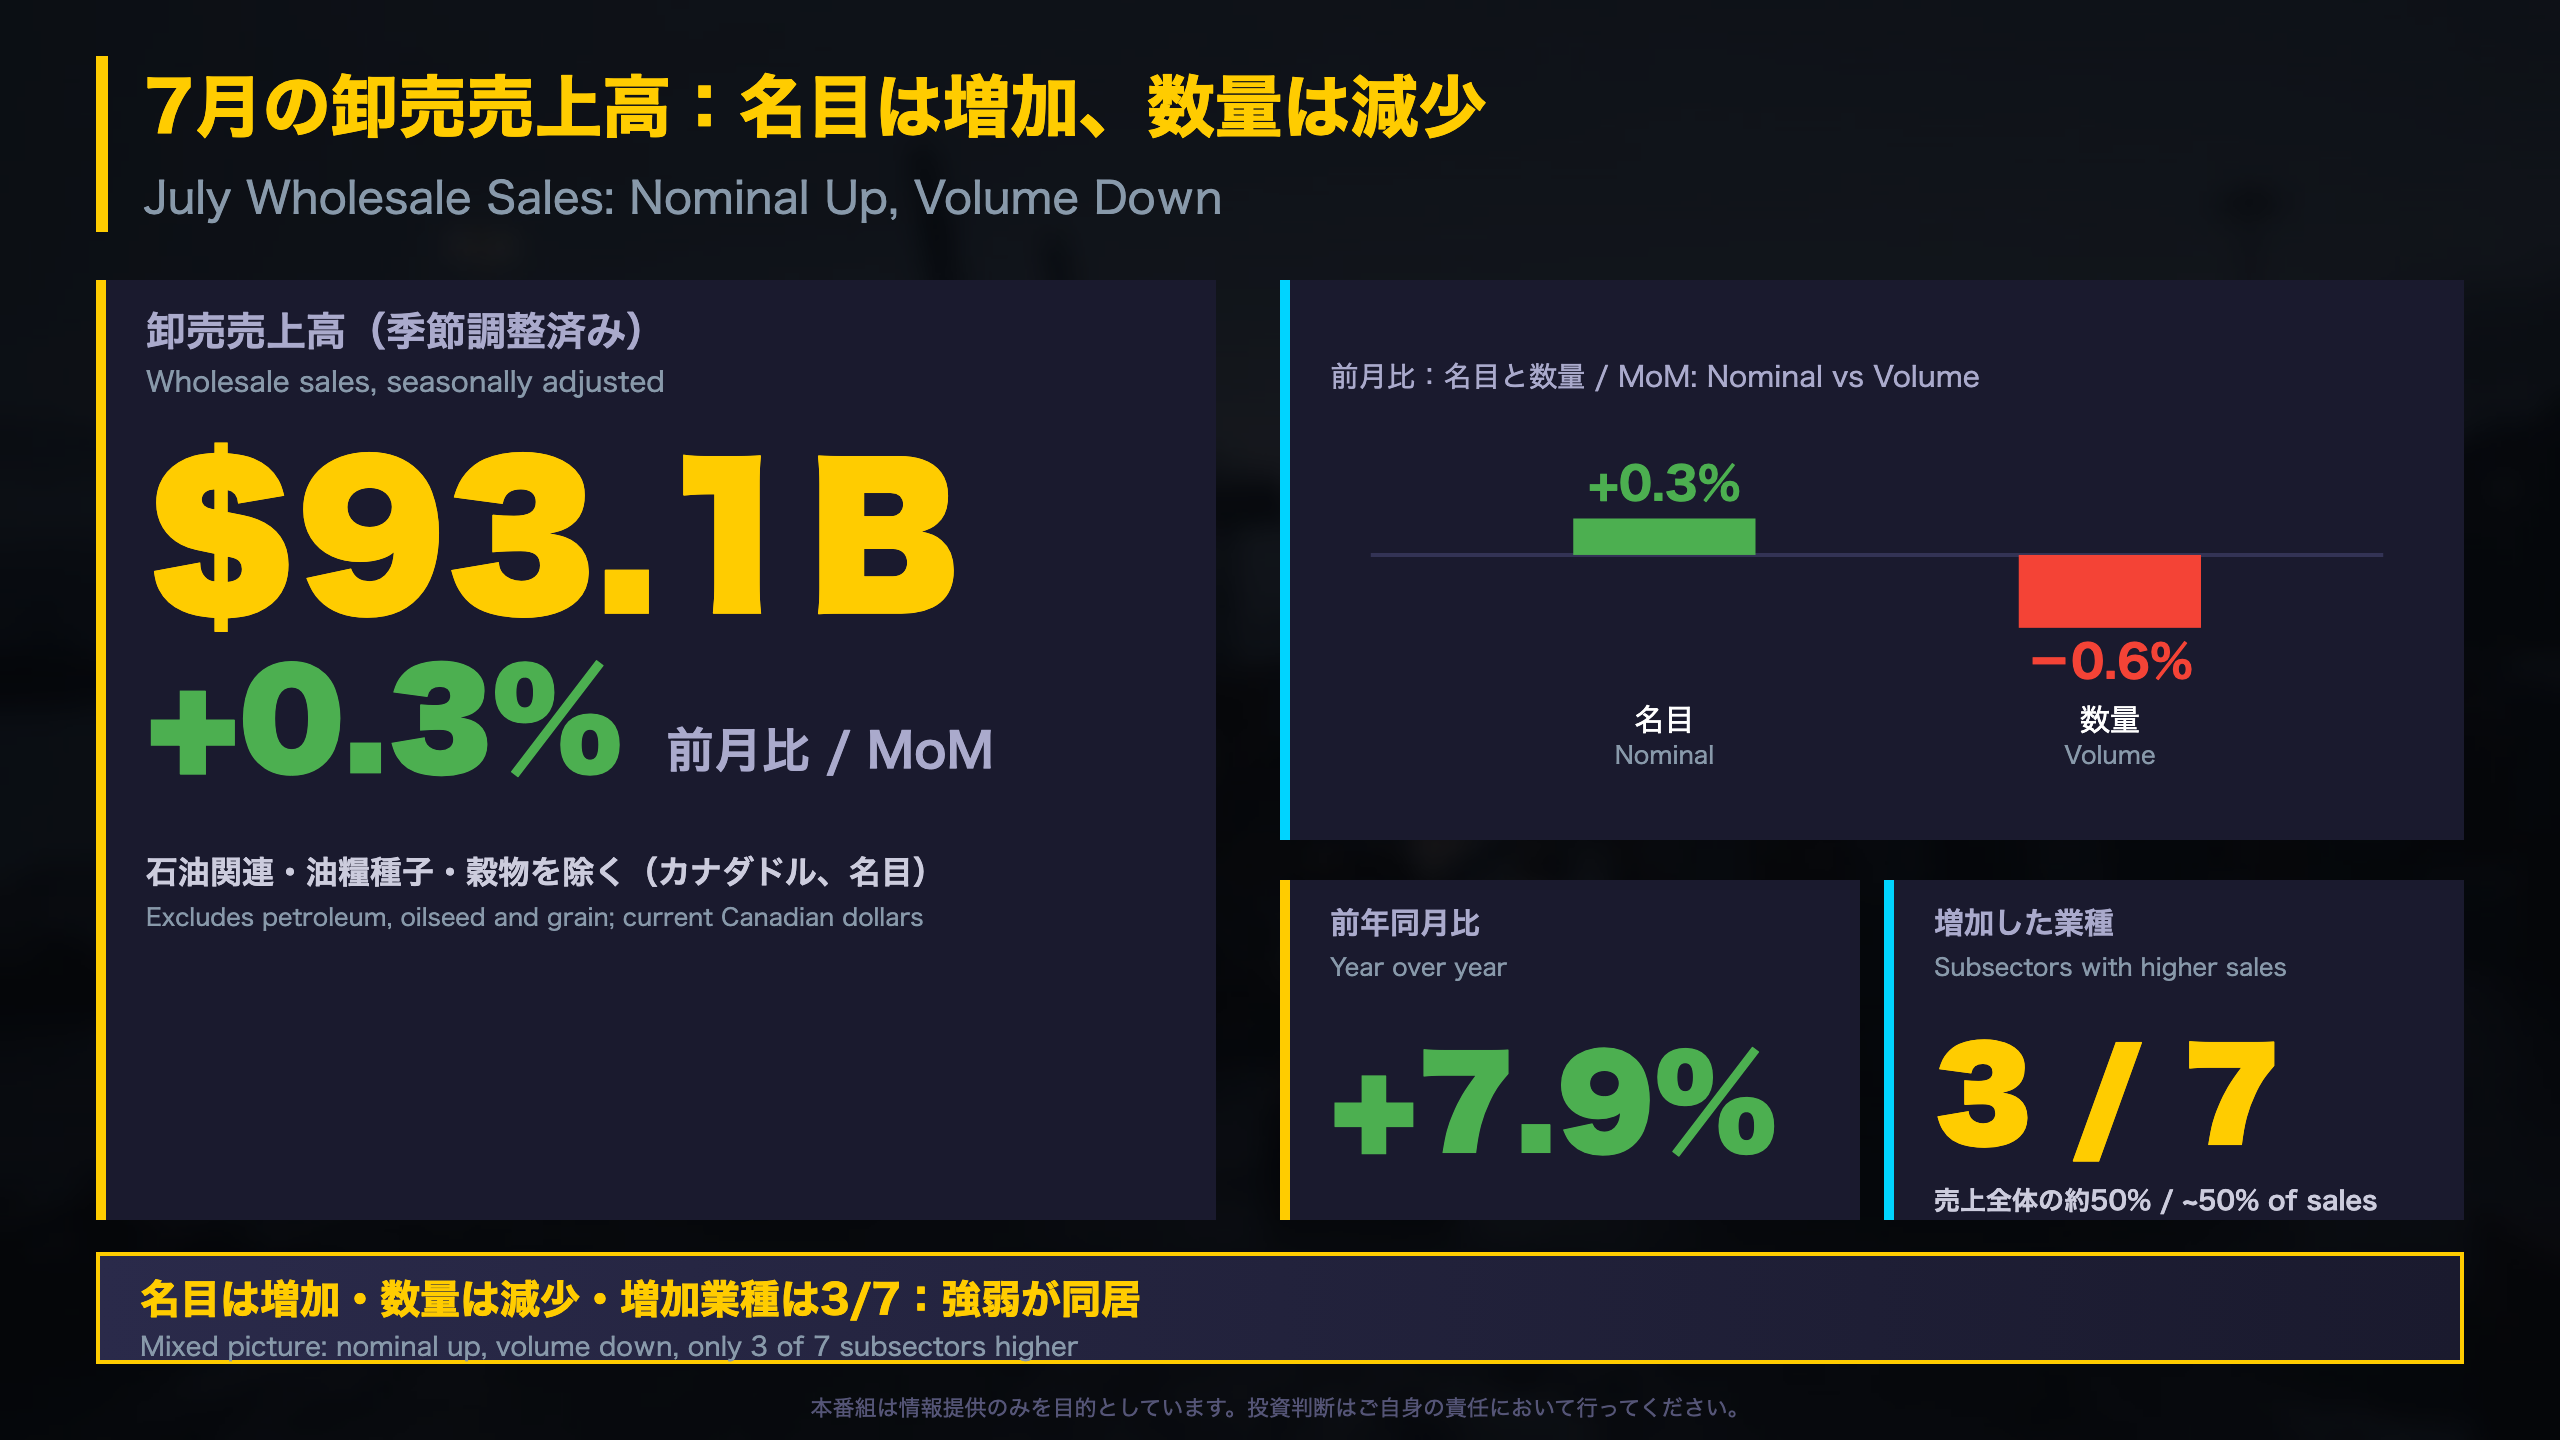
Wholesale sales (excluding petroleum and oilseed and grain) rose 0.3% to $93.1 billion, up 7.9% year over year. In volume terms, however, sales fell 0.6%.
📈 Building materials (+3.5%) and food, beverage and tobacco (+1.7%) led gains. Ontario motor vehicle parts rose for a sixth straight month.
📉 Mineral, ore and precious metals fell 31.4% and Quebec dropped 2.8%. Only 3 of 7 subsectors increased.
💡 Inventories were essentially unchanged at $140.6 billion; the inventory-to-sales ratio edged down from 1.52 to 1.51.
📅 Next: August advance estimate on Sept 25, full August release on Oct 15.
The Ultimate Summary:名目は小幅増、数量は減少
Canada’s July Wholesale Trade: Nominal Gain, Volume Decline
Who publishes this? Statistics Canada (StatCan), the national statistical agency, runs the Monthly Wholesale Trade Survey. It covers all wholesale industries under NAICS, excluding business-to-business electronic markets and agents and brokers. It is the Canadian counterpart of the US Census Bureau’s wholesale trade report and tracks goods moving from producers to retailers.
The numbers
- Sales ex-petroleum and ex-oilseed/grain: +0.3% to C$93.1 billion (seasonally adjusted, current dollars)
- Year over year: +7.9%
- Volume: -0.6%
- Subsectors higher: 3 of 7, about 50% of sales
- Inventories: C$140.6 billion, essentially unchanged
Why nominal and volume differ
StatCan derives volume by deflating current-dollar sales with relevant price indexes. With nominal sales up and volume down, price effects may have contributed to the nominal gain, although the release does not quantify this.
Context for global readers
Wholesale sits between manufacturers and retailers, so it is read as an upstream demand signal alongside manufacturing and retail trade. It is not a direct policy input for the Bank of Canada, and the release contains no policy commentary. Compared with a US-style monthly wholesale report, the key Canadian caveat is the exclusion of petroleum and oilseed and grain from the headline analysis.
StatCan warns that revisions “could be large and could even lead to a reversal of movement.”
What to watch
The August advance estimate arrives on September 25, followed by the full August release on October 15.
サブセクター別:建材・食品が増加、鉱物・貴金属が重し
Subsector Breakdown: What Lifted July and What Held It Back
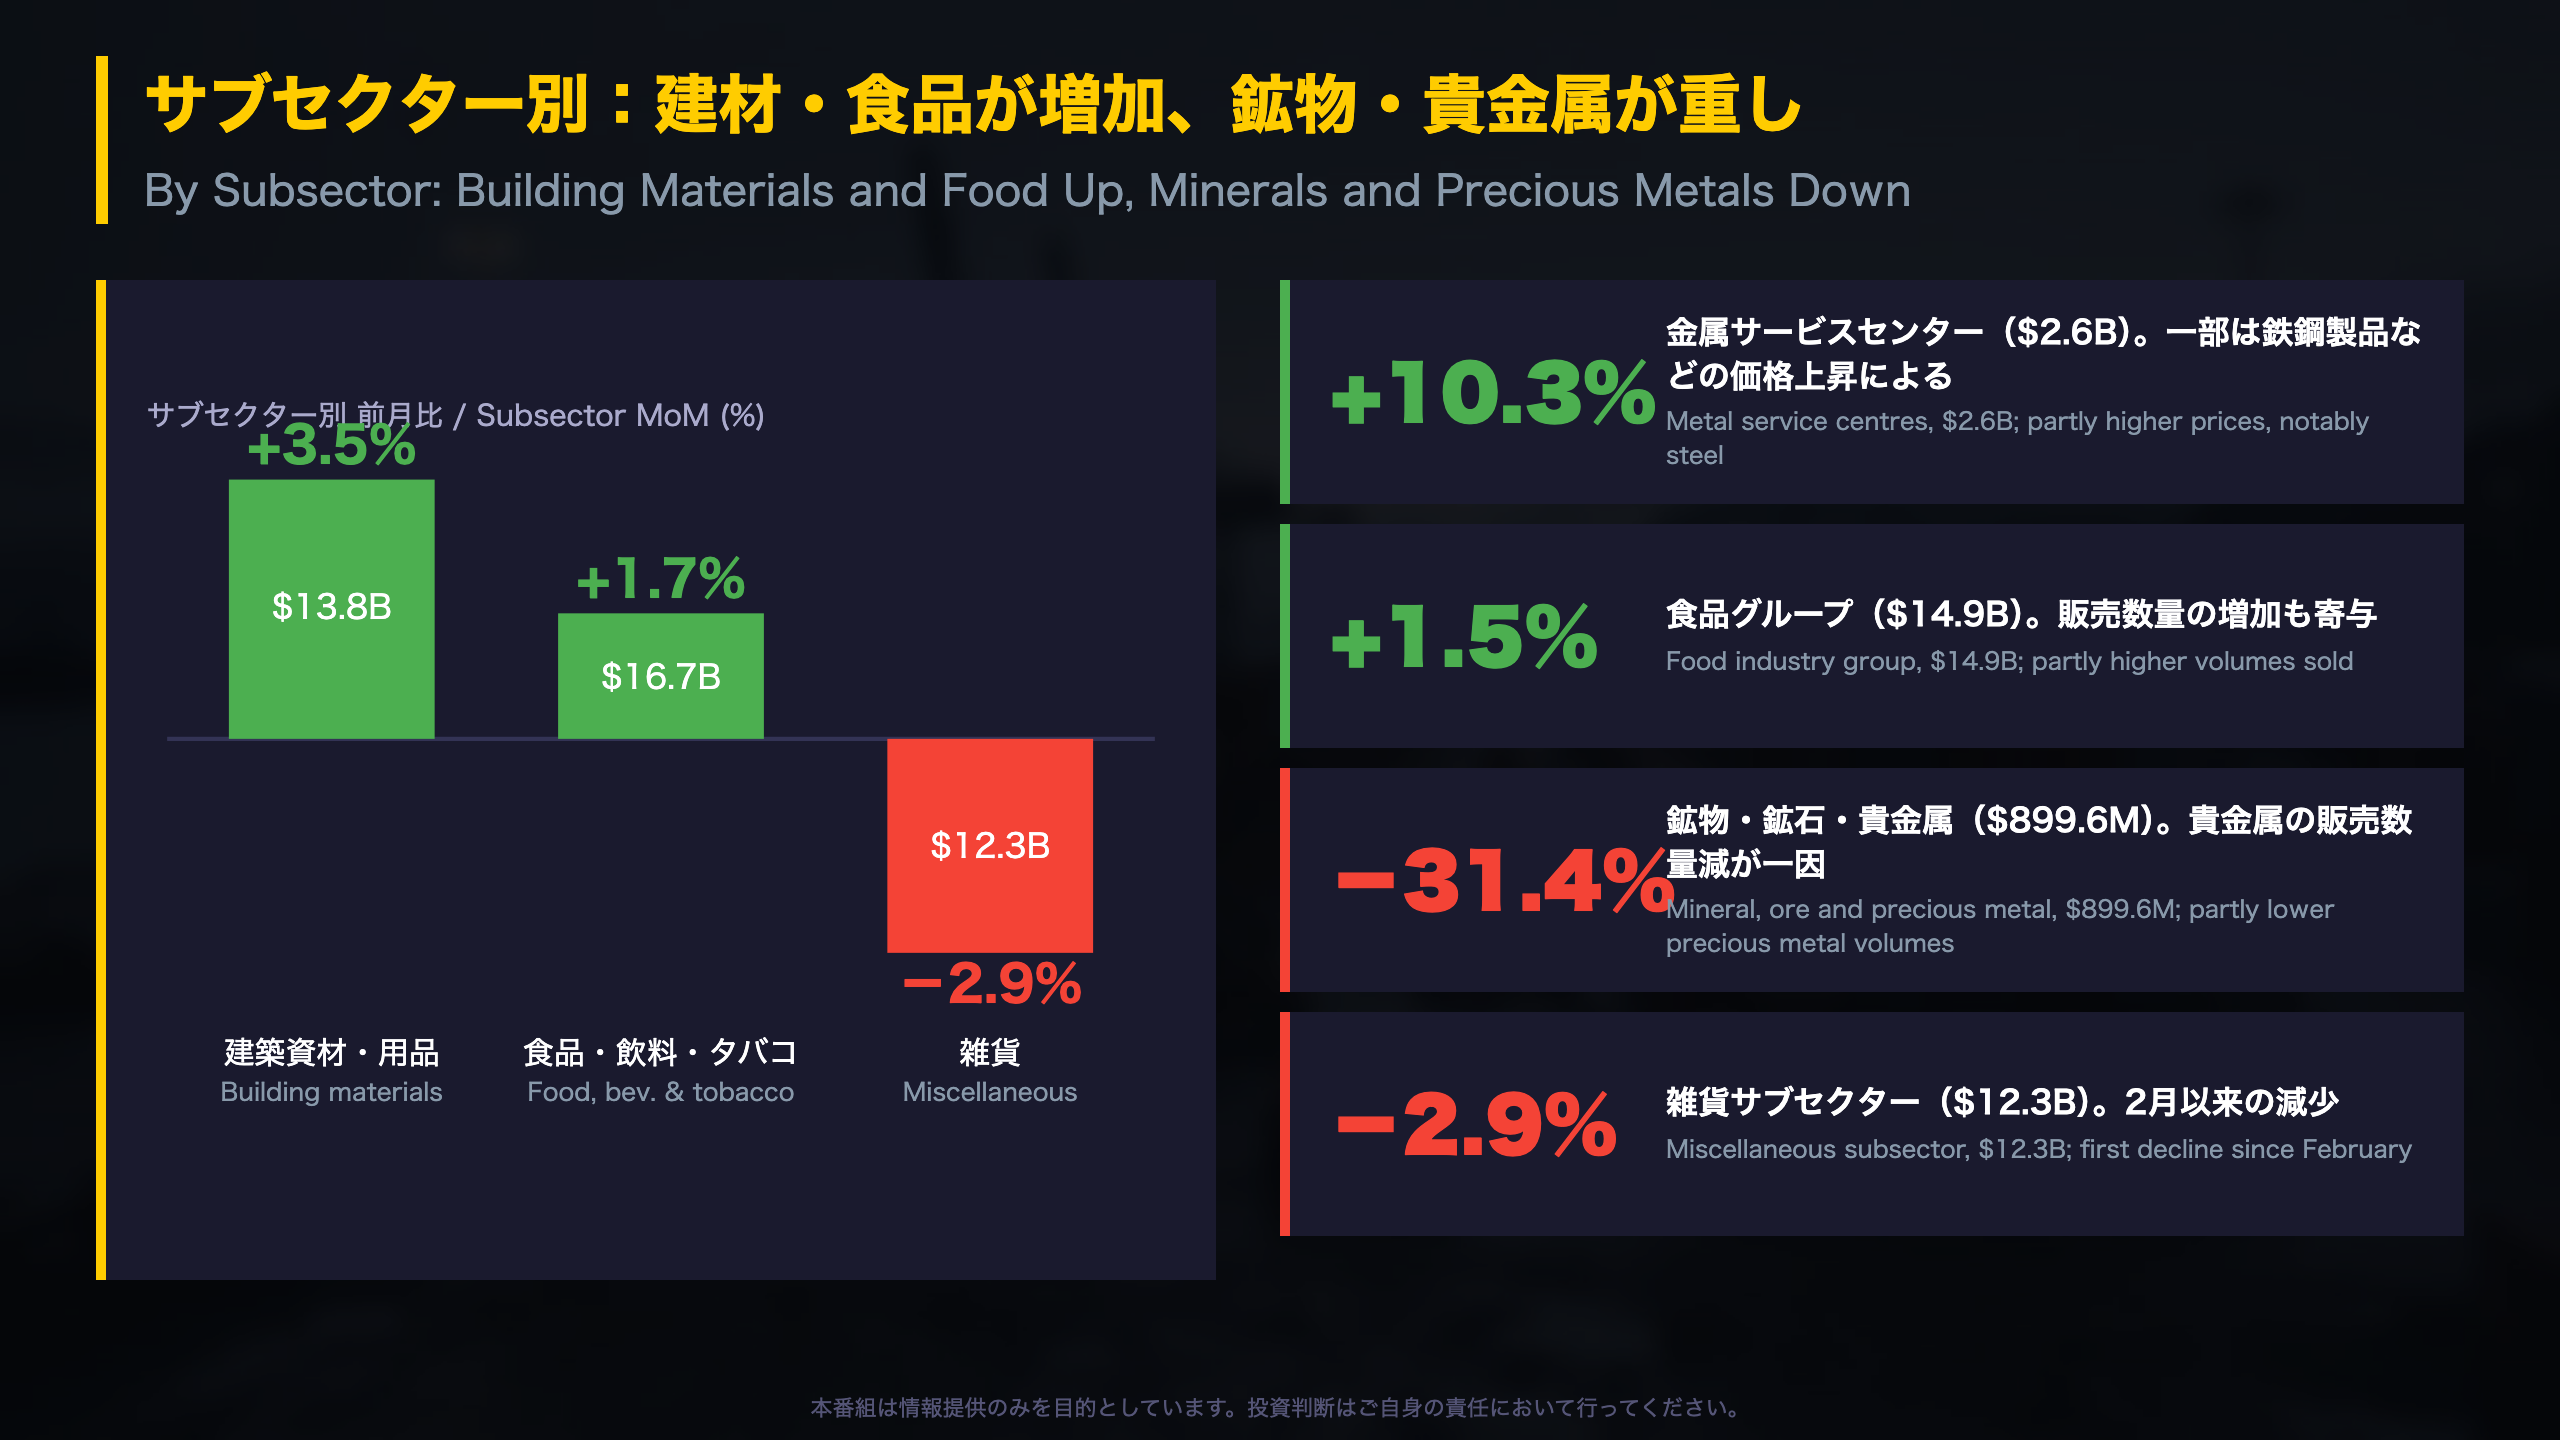
Statistics Canada classifies wholesale trade into seven subsectors under NAICS. Only three rose in July, together representing roughly half of total sales. The release names four moves in detail.
| Category | MoM | Level |
|---|---|---|
| Building material and supplies | +3.5% | C$13.8B |
| Metal service centres (within) | +10.3% | C$2.6B |
| Food, beverage and tobacco | +1.7% | C$16.7B |
| Food group (within) | +1.5% | C$14.9B |
| Miscellaneous | -2.9% | C$12.3B |
| Mineral, ore, precious metal (within) | -31.4% | C$899.6M |
Prices versus volumes
StatCan says the metal service centres gain was “partly attributable to higher prices, notably for steel products.” By contrast, the food gain was partly driven by higher volumes sold. That split matters: price-led gains inflate current-dollar sales without necessarily signalling stronger physical demand, while volume-led gains do.
A small base behind a big drop
The 31.4% fall in mineral, ore and precious metals looks dramatic, yet the level is under C$1 billion. It was partly due to lower precious metal volumes and dragged the miscellaneous subsector lower, ending a streak of gains that began after February.
Balanced reading
- Constructive: Building materials and food, both tied to real-economy activity, advanced.
- Cautious: Breadth was narrow at 3 of 7, and the release gives no detail on the third gaining subsector.
A single month cannot establish a trend, and StatCan notes seasonally adjusted figures are revisable. The August advance estimate on September 25 will show whether the pattern holds.
地域別:6州が増加、オンタリオとBCが先導、ケベックが減少
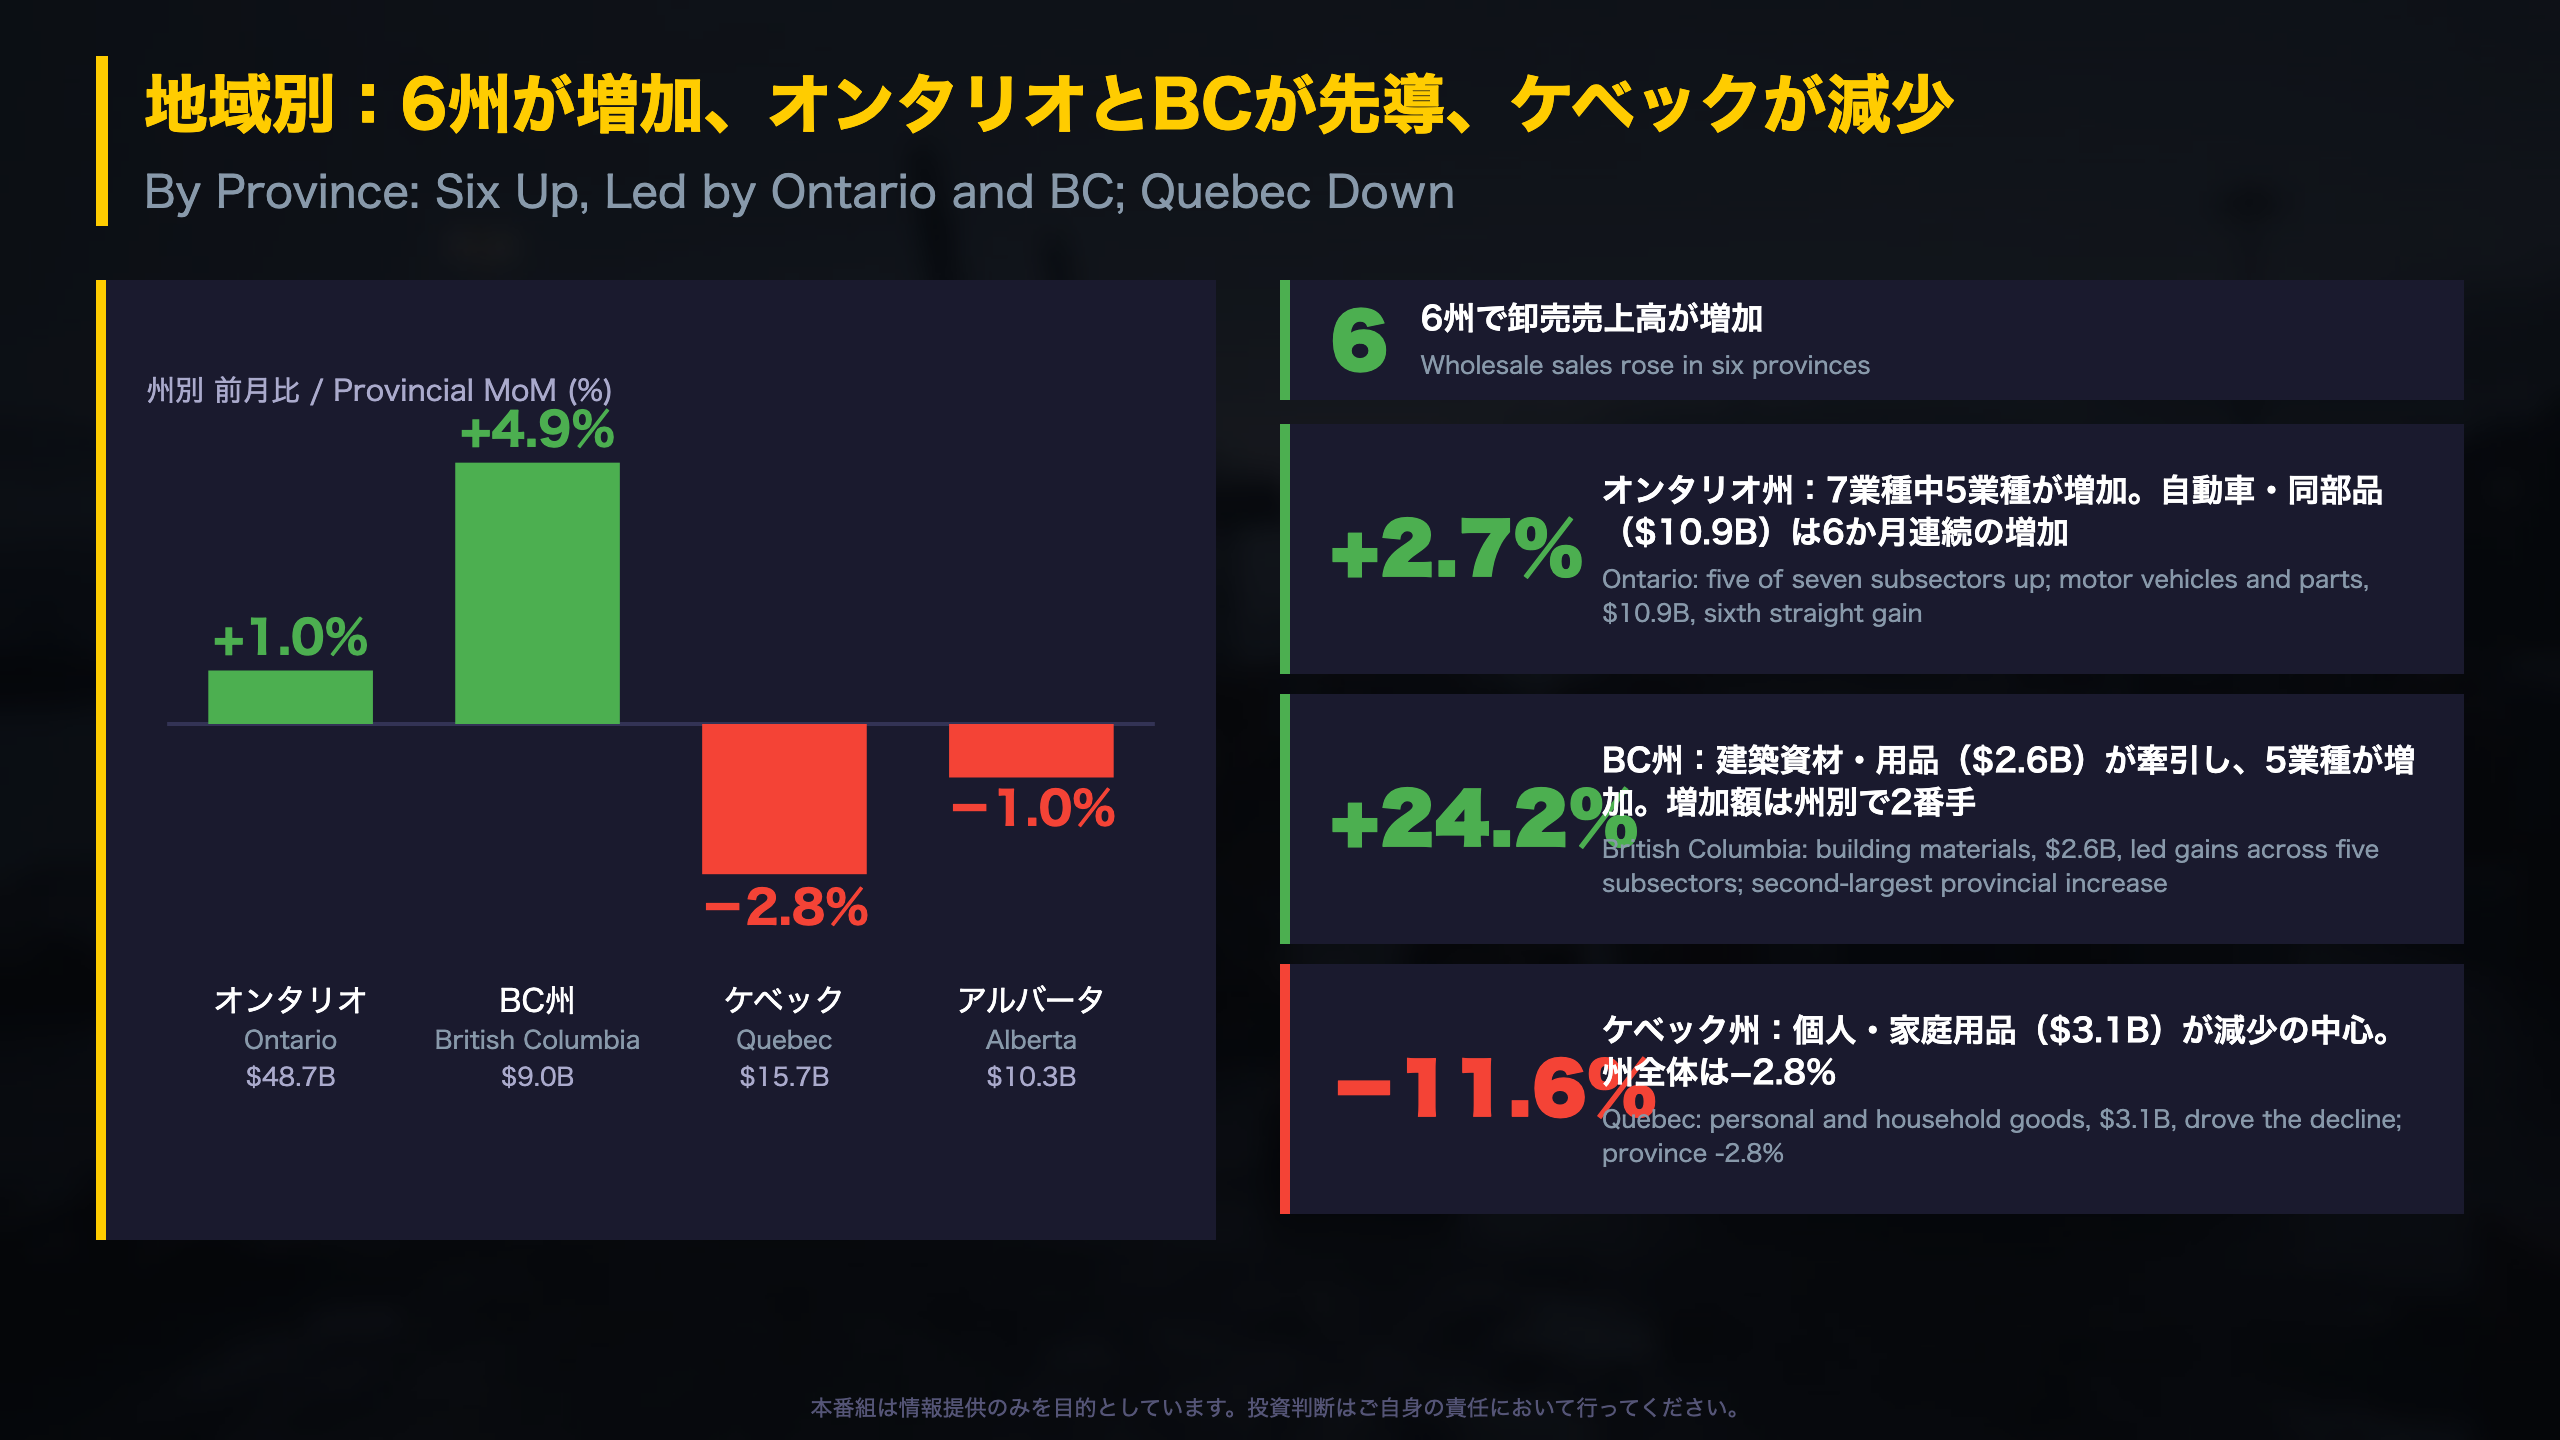
Provincial Picture: Six Provinces Up, Quebec the Drag
Statistics Canada reports wholesale trade by province, and because Ontario and Quebec are the two largest wholesale hubs, their moves dominate the national number. The US analogue would be state-level data, which the US Census Bureau publishes far less frequently, making Canada’s monthly provincial detail unusually timely.
July leaders and laggards
| Province | Level | MoM |
|---|---|---|
| Ontario | C$48.7B | +1.0% |
| British Columbia | C$9.0B | +4.9% |
| Quebec | C$15.7B | -2.8% |
| Alberta | C$10.3B | -1.0% |
| Nova Scotia | C$1.37B | -2.8% |
| Newfoundland and Labrador | C$533M | -8.2% |
Key drivers
- Ontario: Five of seven subsectors rose, led by motor vehicles and parts (+2.7% to C$10.9B), a sixth consecutive gain. This ties into the province’s auto-manufacturing supply chain.
- British Columbia: Building materials and supplies surged 24.2% to C$2.6B, far outpacing the national +3.5% for that subsector.
- Quebec: Personal and household goods fell 11.6% to C$3.1B and drove the decline.
Caveats
Territorial figures swing widely on tiny bases: Nunavut fell 30.6% on a level of just C$9.4 million. Treat those as noise rather than signal.
Balanced view
Breadth was decent, with six provinces higher, yet BC’s jump rested on one subsector, and Ontario’s overall gain was a modest 1.0%. The release does not offer regional price detail, so it is unclear how much of each gain reflects volumes versus prices.
在庫は横ばい、在庫売上比率は1.51へ小幅低下
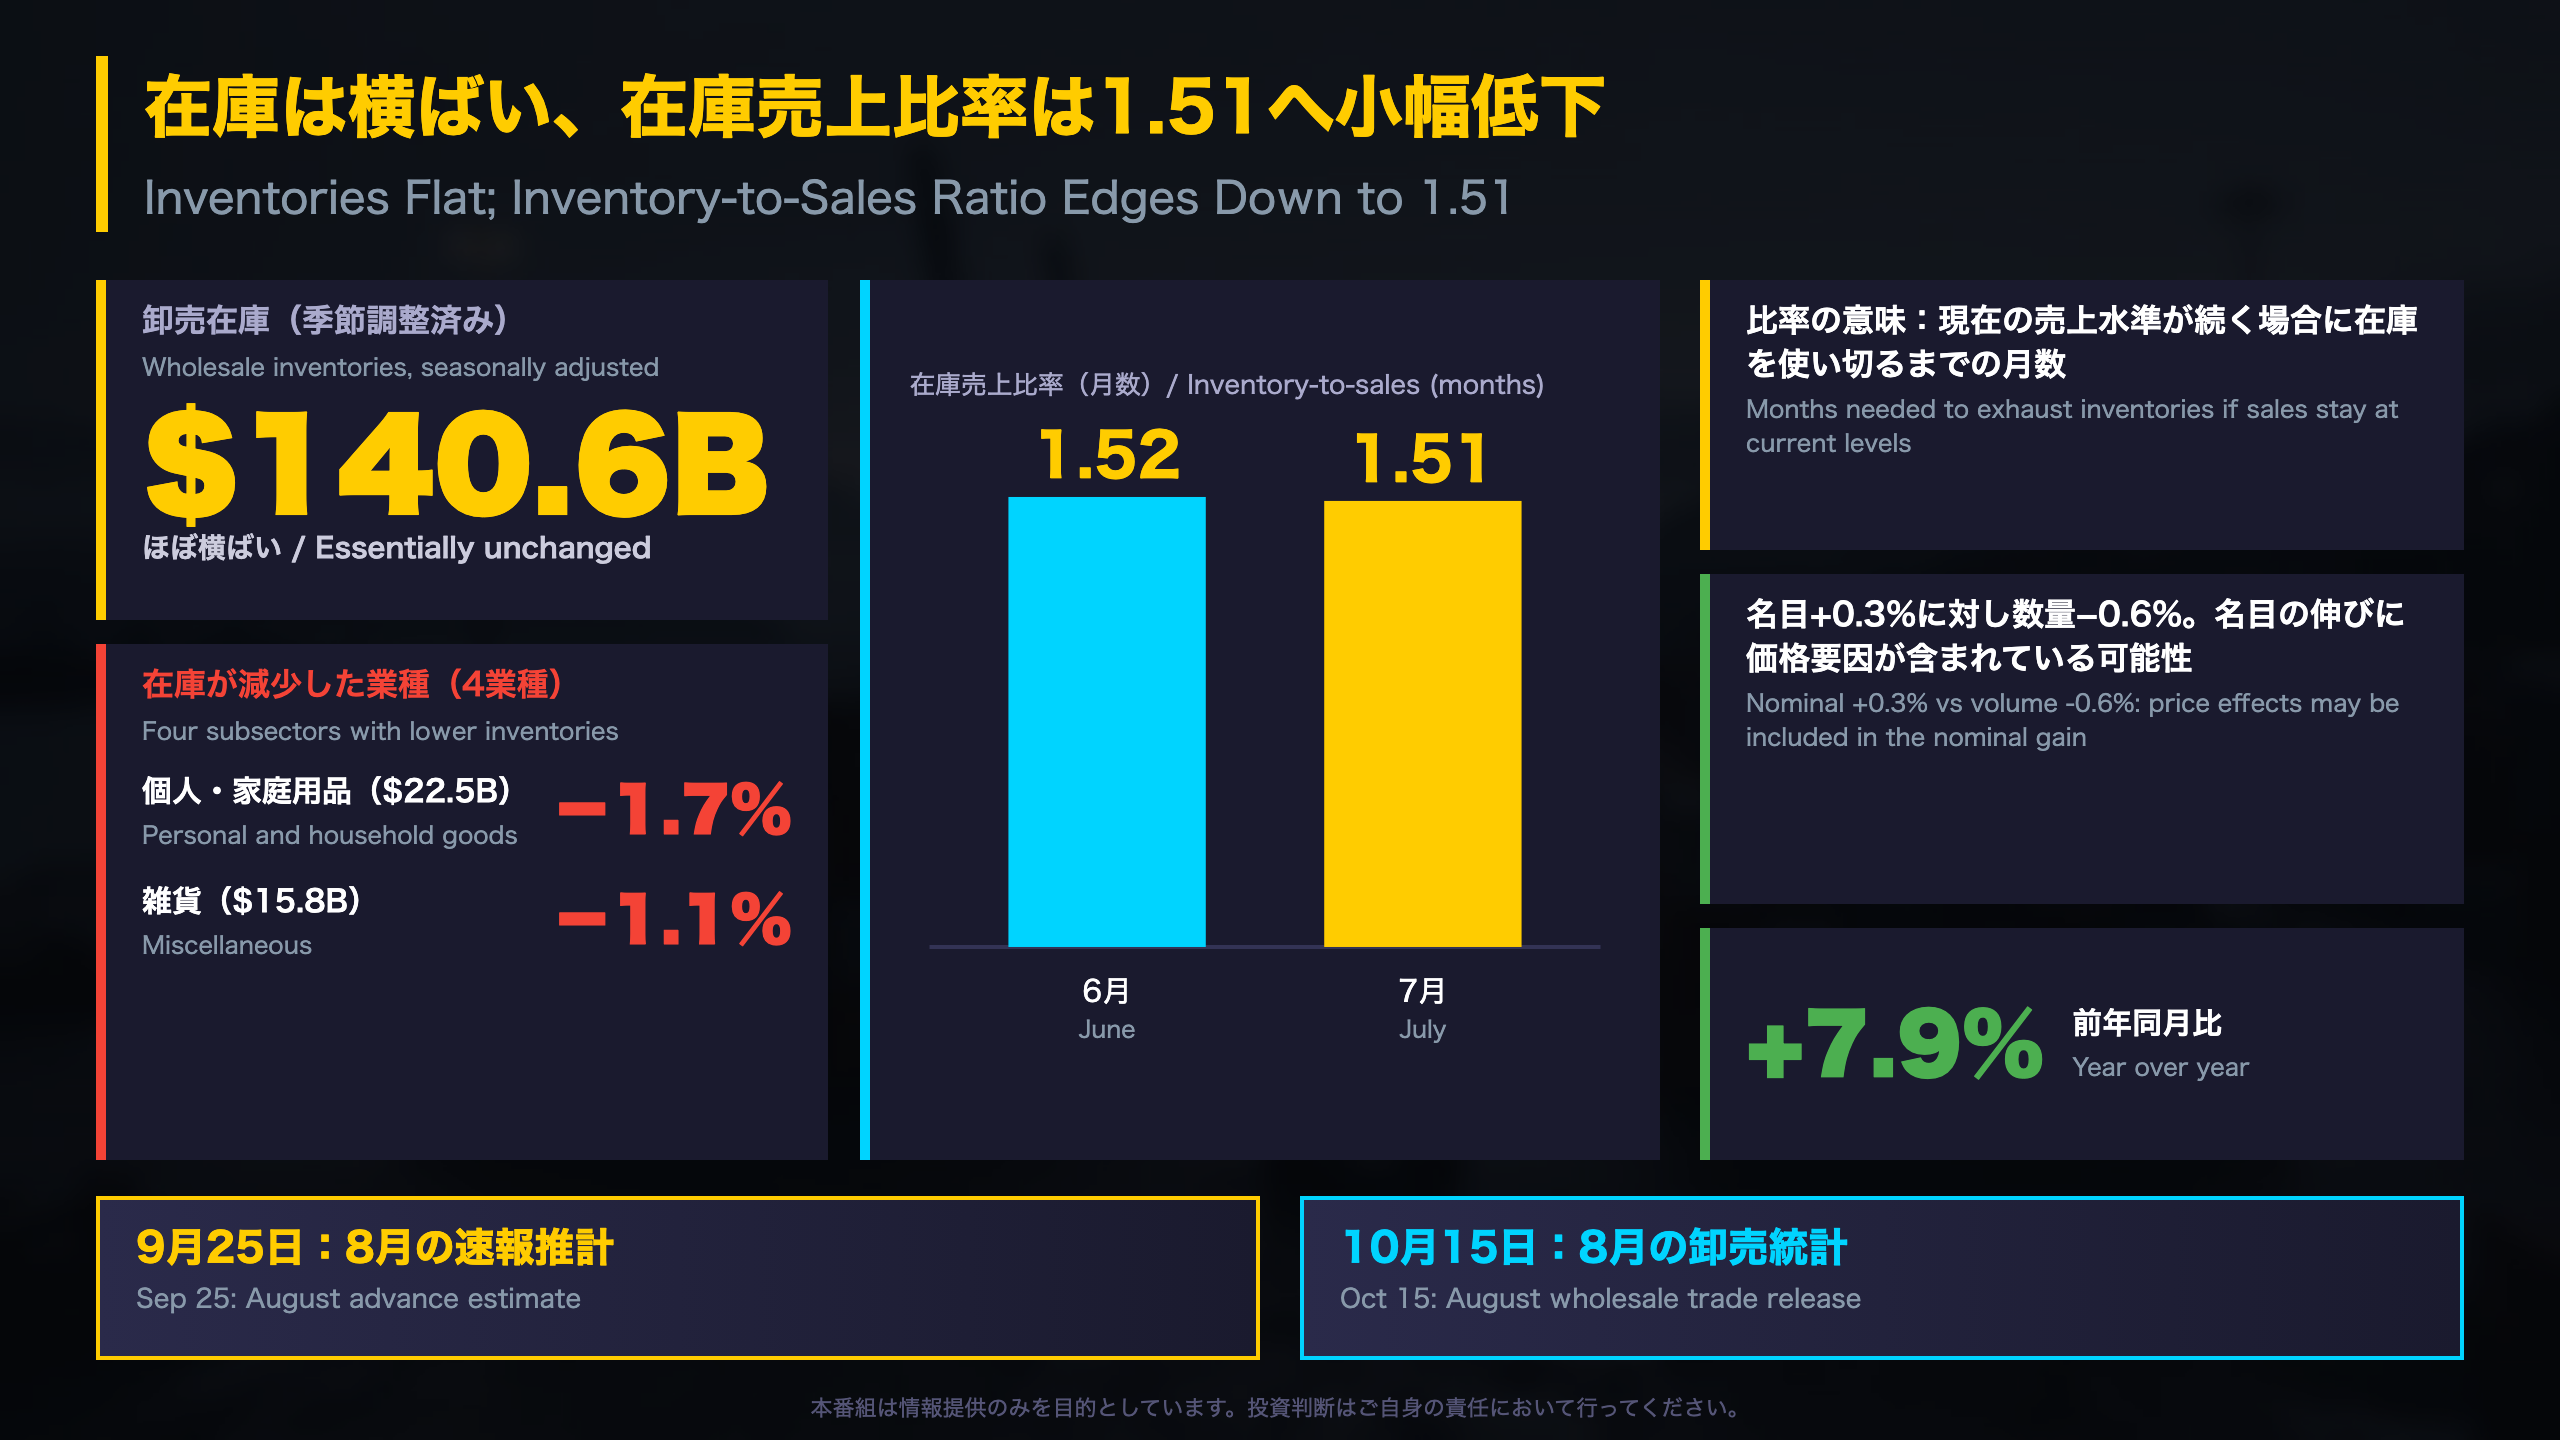
Inventories, the Ratio, and What Comes Next
“The inventory-to-sales ratio edged down from 1.52 in June to 1.51 in July.”
Inventory detail
| Item | July | Change |
|---|---|---|
| Total wholesale inventories | C$140.6B | Essentially unchanged |
| Personal and household goods | C$22.5B | -1.7% |
| Miscellaneous | C$15.8B | -1.1% |
Four subsectors cut inventories. Because inventories were flat while nominal sales edged up, the ratio slipped by 0.01.
Why the ratio matters
StatCan defines the inventory-to-sales ratio as the number of months required to exhaust inventories at current sales levels. At 1.51, that is roughly one and a half months of stock. It is closely watched by economists as a gauge of whether businesses are accumulating unsold goods or running lean, much like the US Census Bureau’s inventory-to-sales series. A move of 0.01 is too small to read as a trend.
Nominal versus volume
Nominal sales rose 0.3% while volume fell 0.6%. Since StatCan deflates nominal values with price indexes to get volume, price effects may be embedded in the nominal gain. The release only quantifies this for some categories, such as steel.
Balanced view
- Supportive: year-over-year growth of 7.9% and no sign of inventory build.
- Cautious: volumes slipped, breadth was narrow, and seasonally adjusted data can be revised, with StatCan noting revisions could even reverse a movement.
Market relevance
For Bank of Canada watchers, wholesale trade is one input among many on supply-chain demand; the release itself offers no policy guidance.
Calendar
August advance estimate: September 25. Full August release: October 15. Key checkpoints are the sign of volume growth and the number of subsectors rising.
Disclaimer: This article is for informational purposes only. All investment decisions are made solely at your own risk.