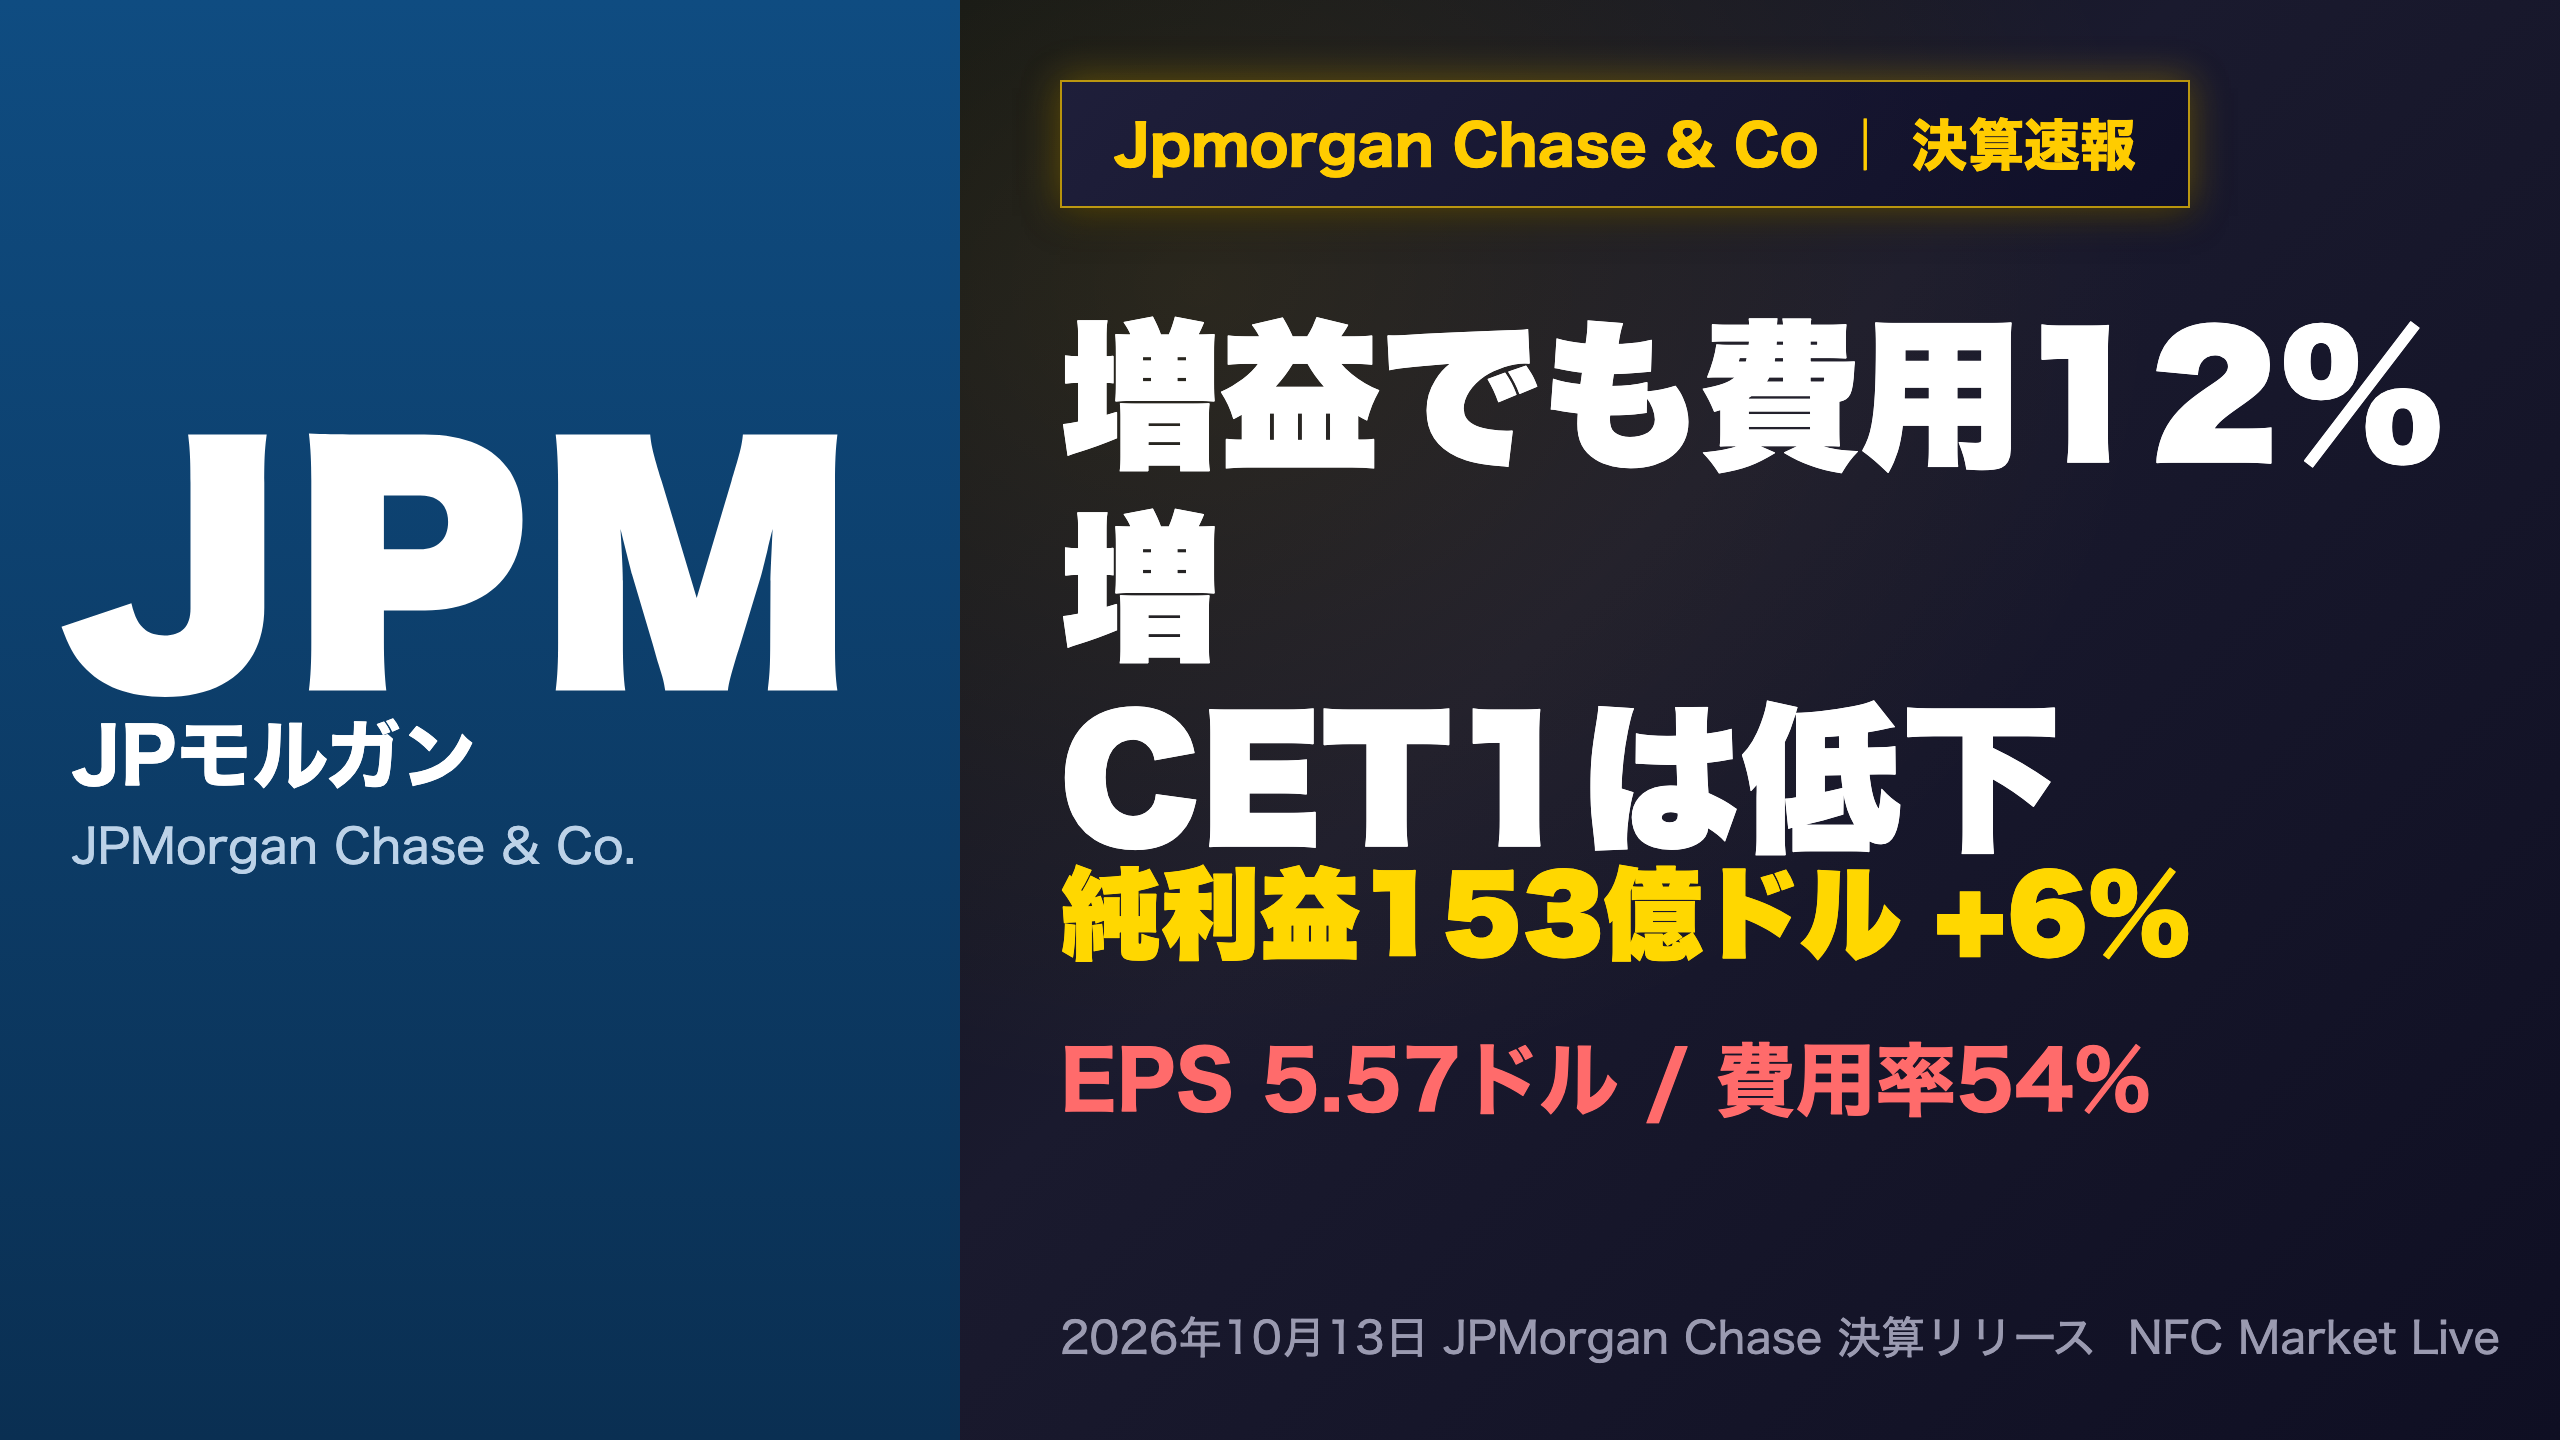
📺 Watch the Full Video Analysis
This article was automatically generated by the NFC Market Live AI analysis system. (Updated: 2026-10-13 21:08 JST)
📊 A deep dive into JPMorgan Chase’s Q3 2026 results.
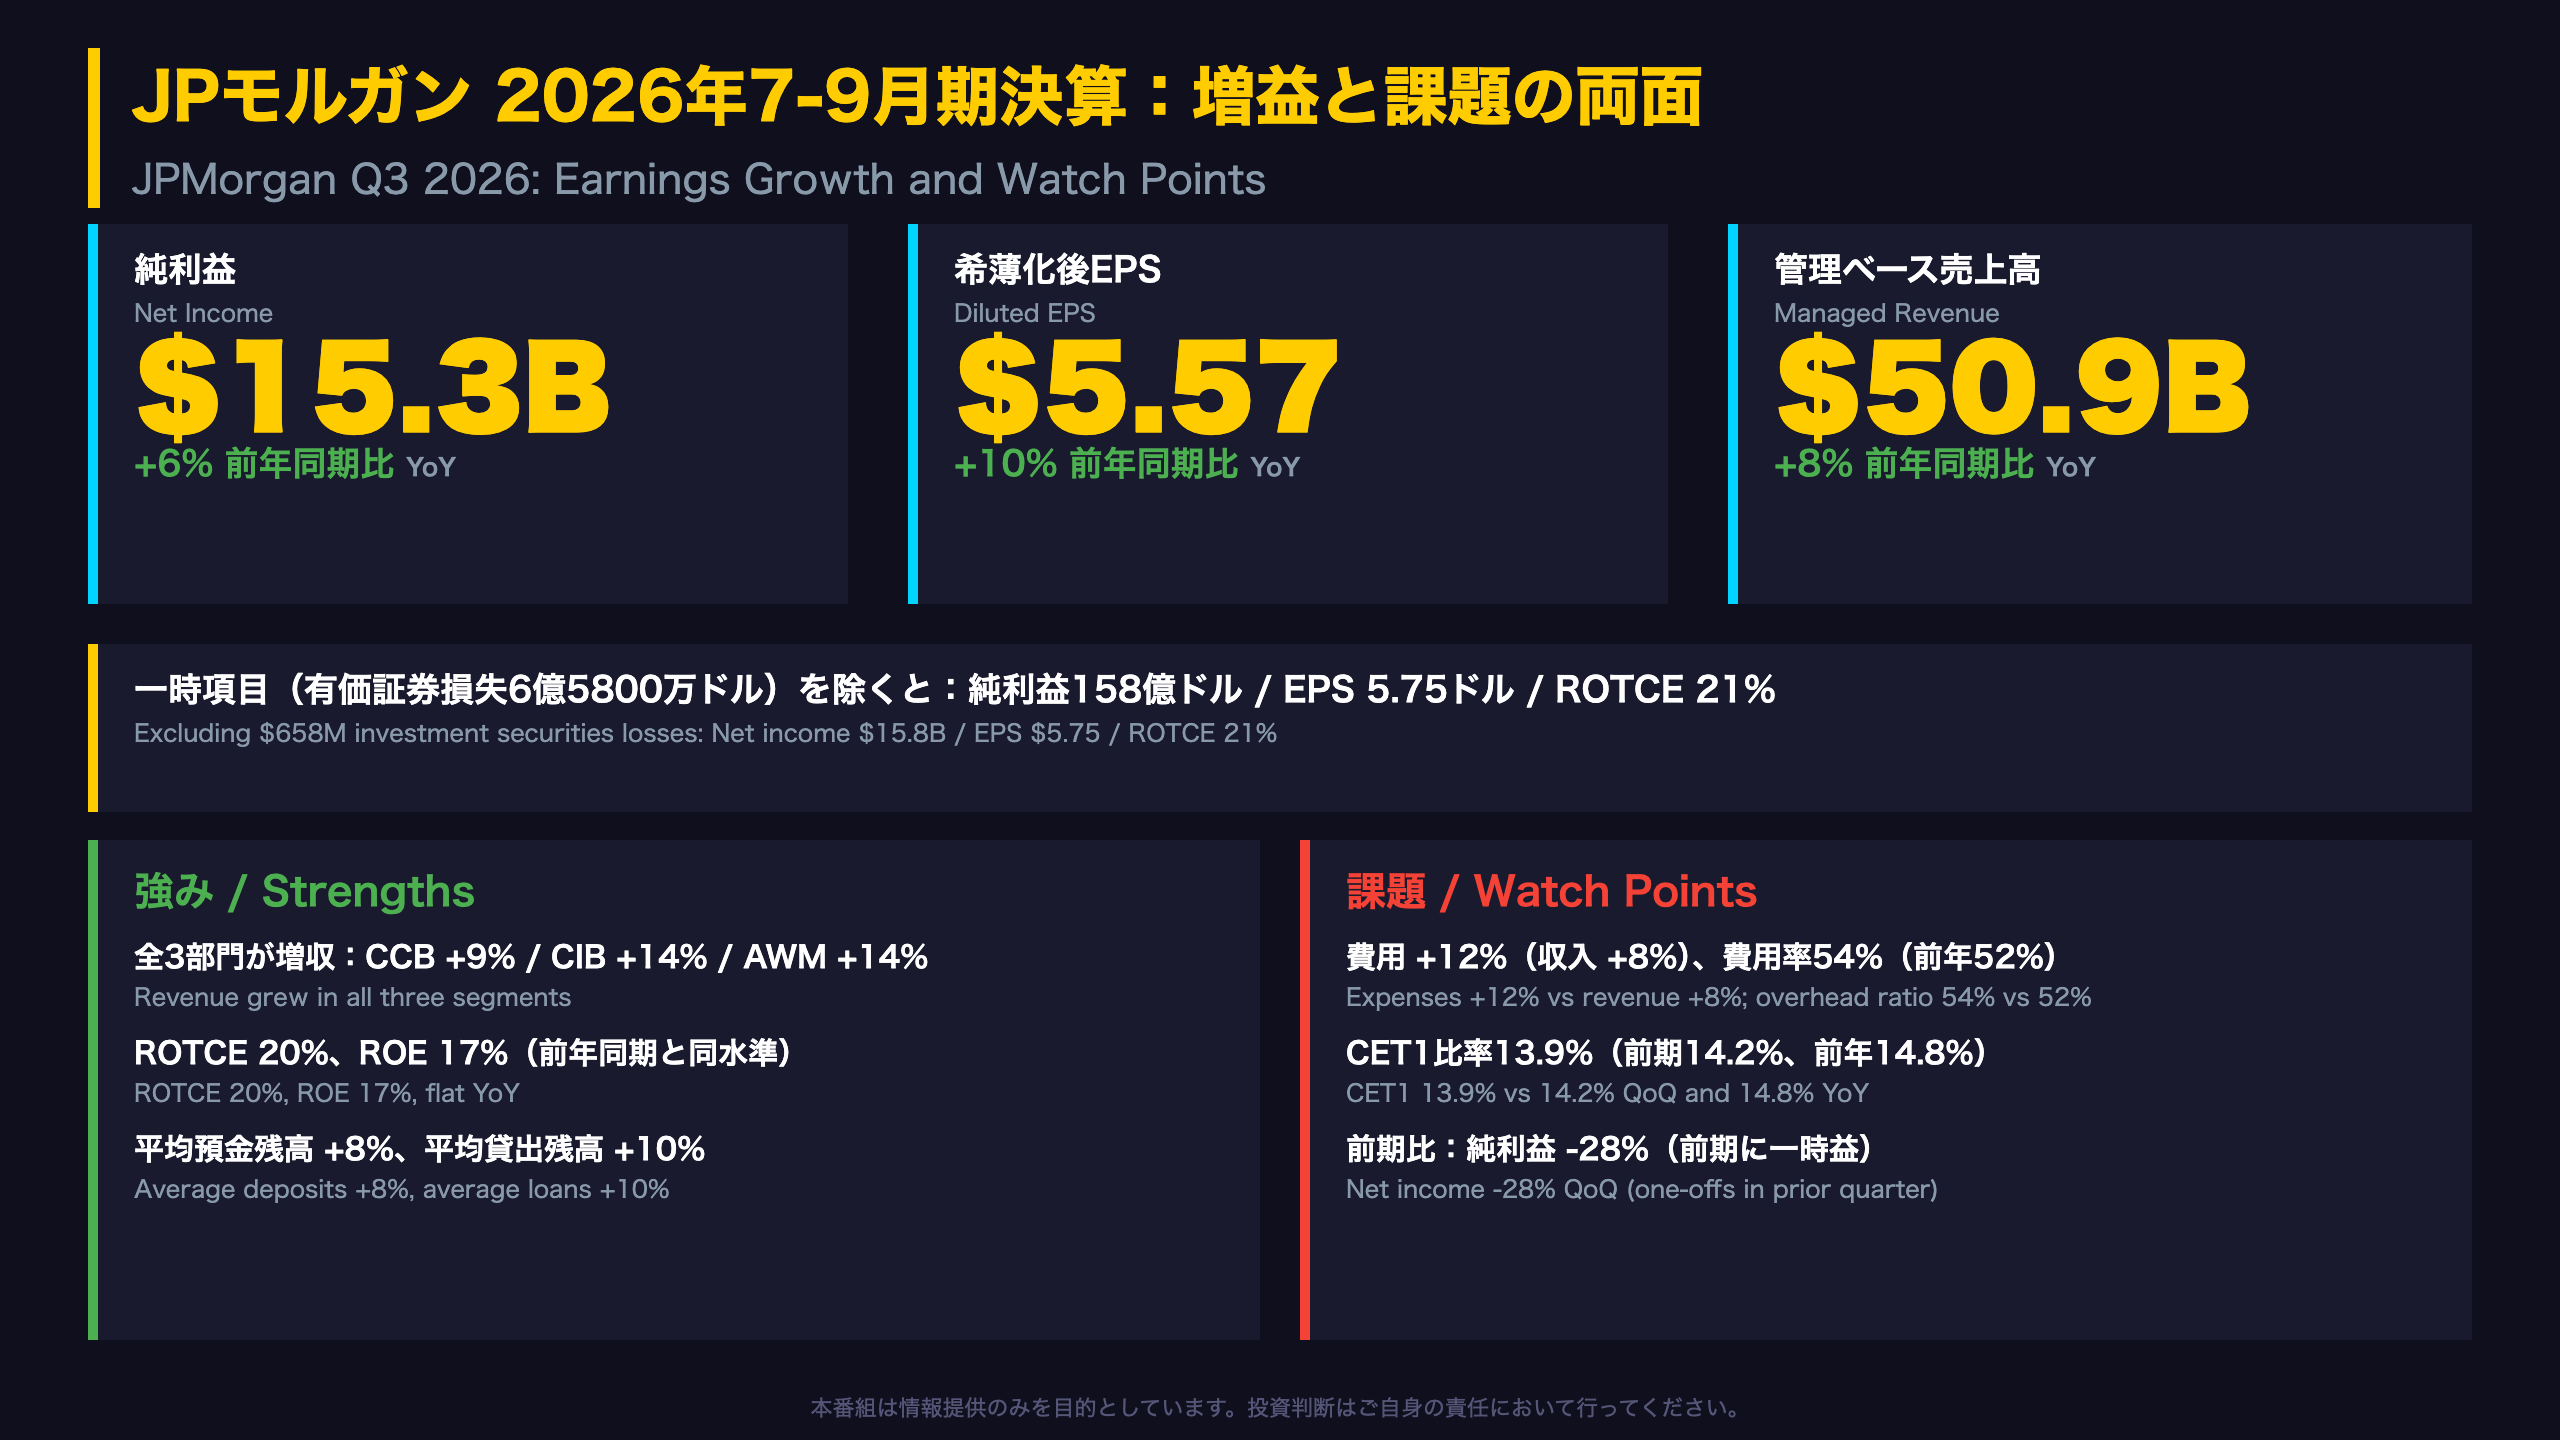
Net income was $15.3B (+6% YoY), diluted EPS $5.57 (+10%), managed revenue $50.9B (+8%).
📈 Revenue grew in all three segments: CIB +14%, CCB +9%, AWM +14%.
⚠️ But expenses rose 12%, the overhead ratio hit 54%, and the CET1 ratio fell to 13.9% from 14.2%.
💡 The 28% QoQ drop in net income reflects one-off gains in 2Q26.
Next earnings date, guidance and consensus are not stated in the release.
Ultimate Summary:増益と課題の両面
Why this quarter looks weaker than it is
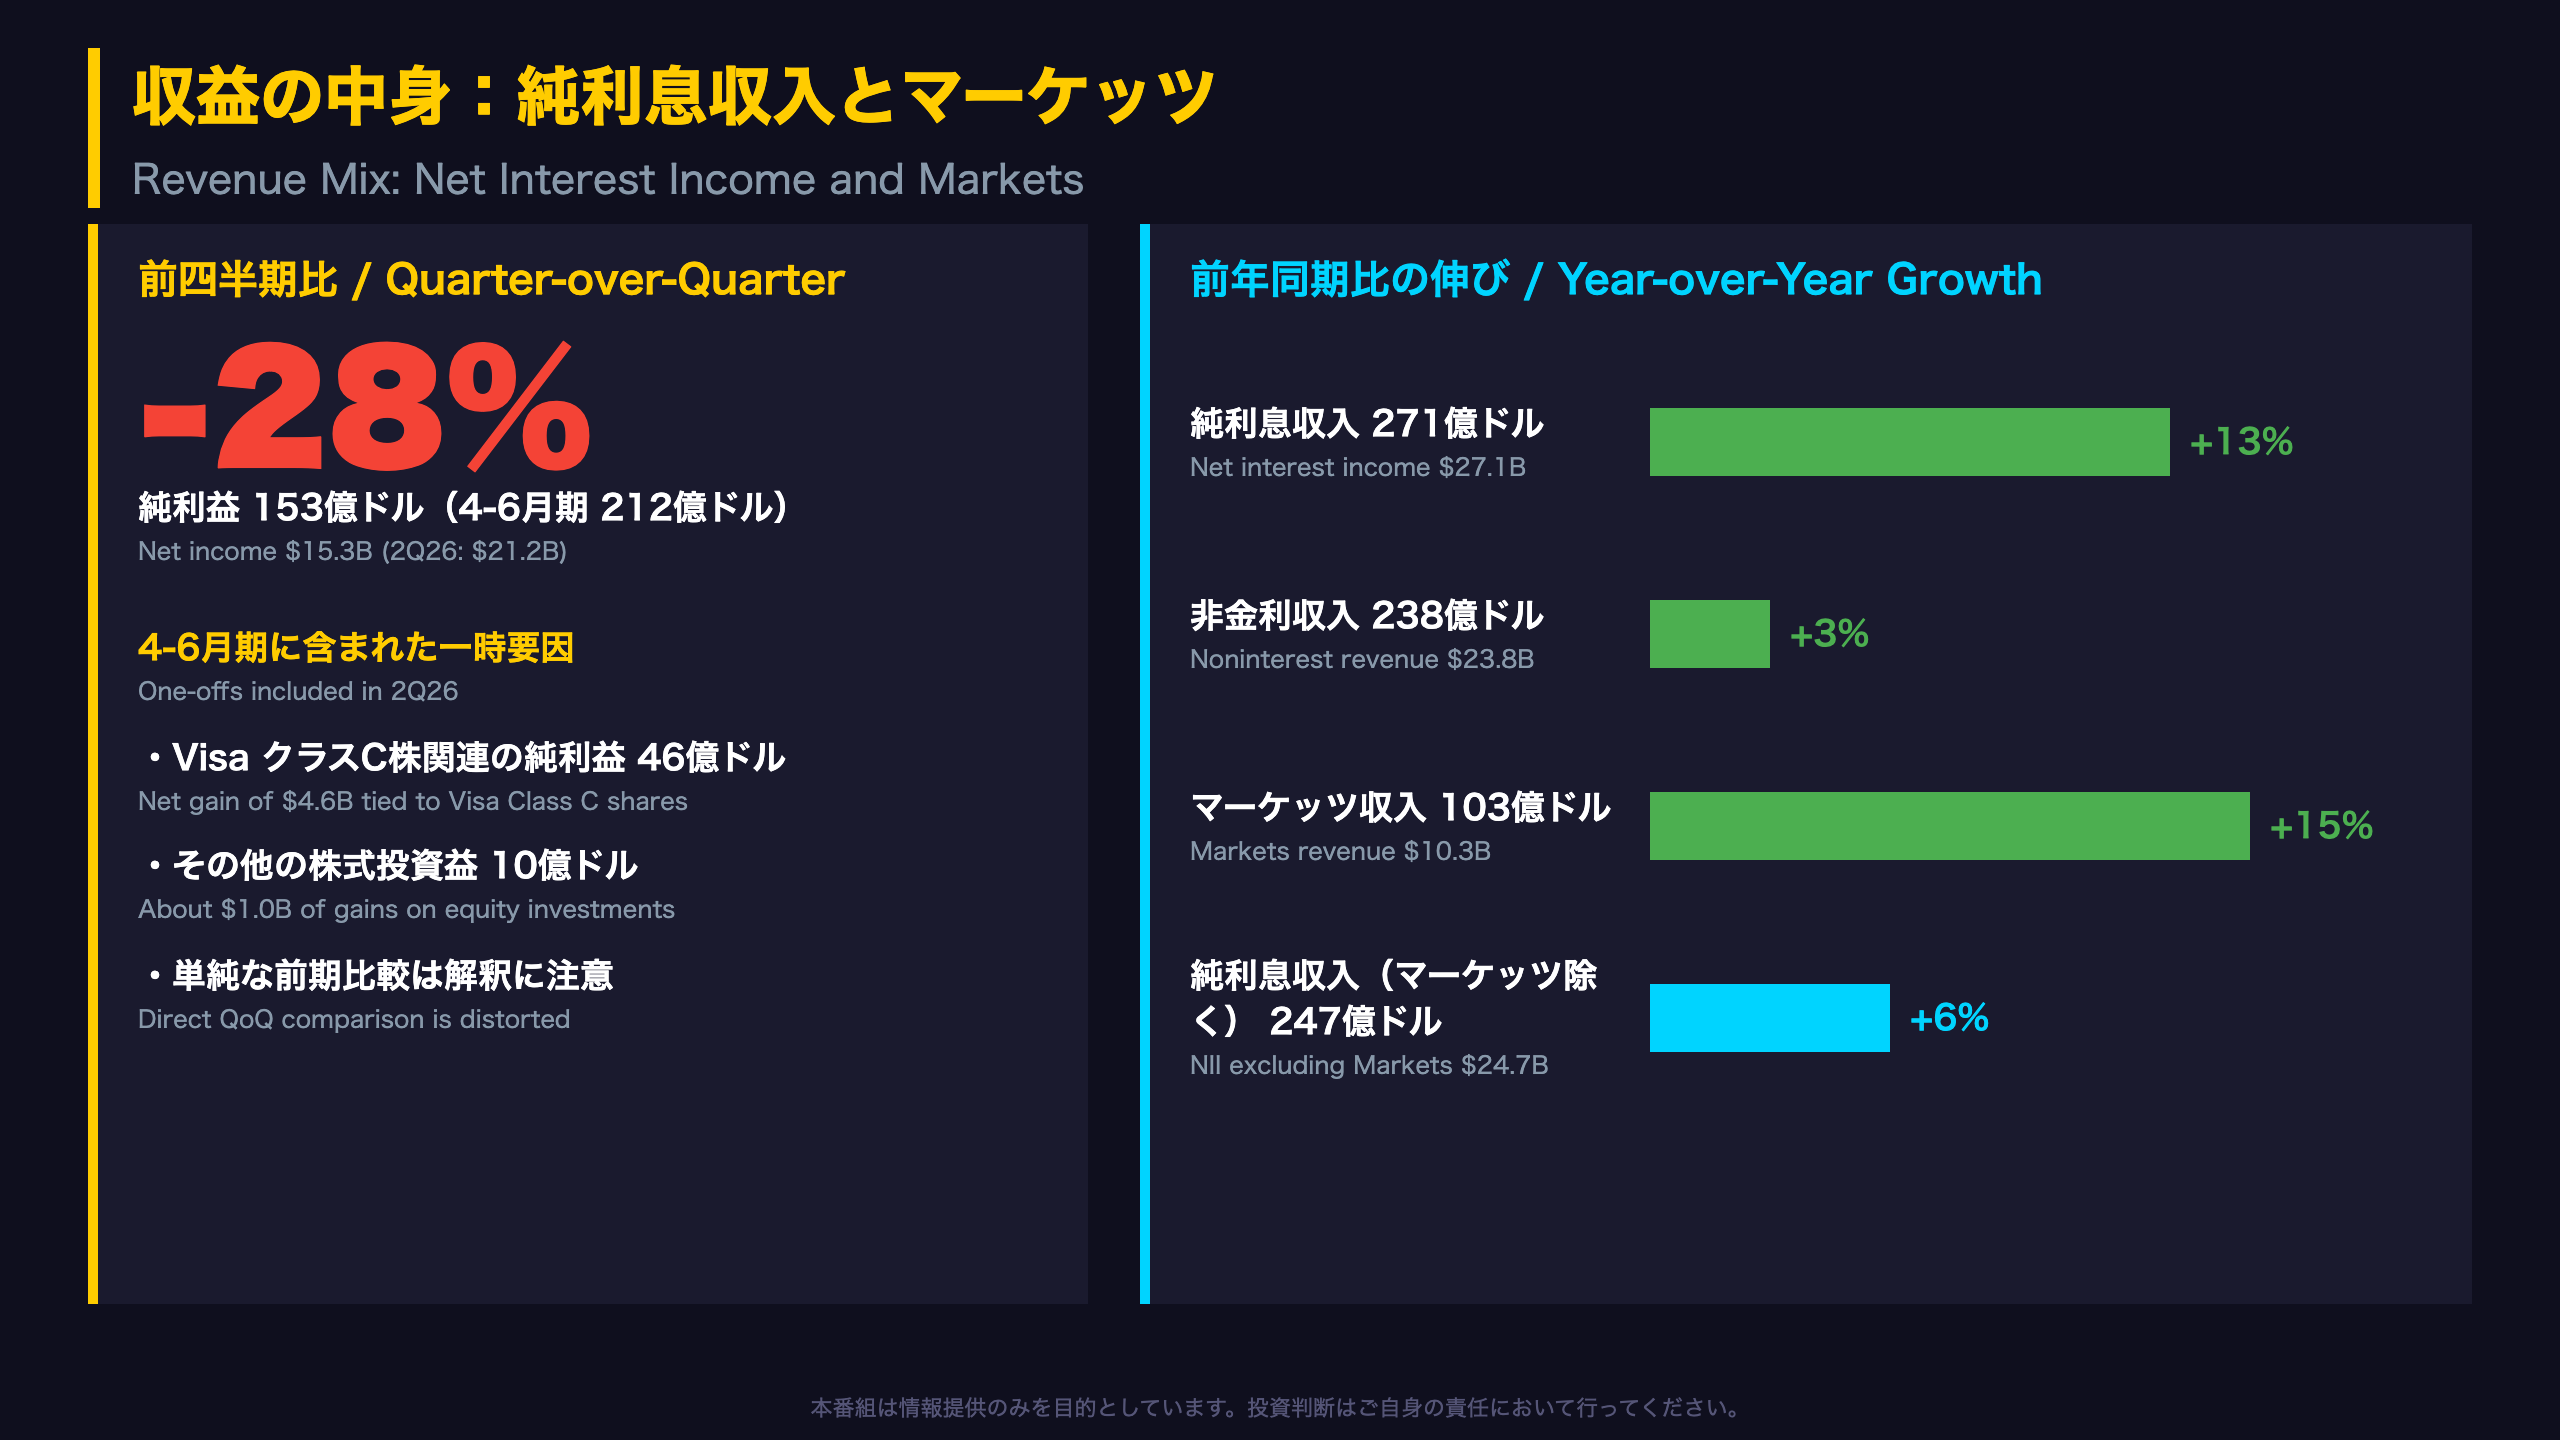
Quarter-on-quarter net income fell 28%, but 2Q26 contained a 4.6 billion dollar gain tied to Visa Class C shares and roughly 1.0 billion dollars of equity investment gains. Against 3Q25, net income rose 6%.
Terms for global readers
- Managed basis: a non-GAAP view that grosses up tax-exempt income to a taxable-equivalent level (735 million dollars this quarter). Reported revenue was 50.2 billion dollars.
- ROTCE: return on tangible common equity, 20% this quarter (21% excluding the securities loss).
- CET1: the core regulatory capital ratio; JPMorgan reports 13.9% on the Standardized approach.
Five-quarter trend
| 3Q26 | 2Q26 | 1Q26 | 4Q25 | 3Q25 | |
|---|---|---|---|---|---|
| Net income ($M) | 15,305 | 21,155 | 16,494 | 13,025 | 14,393 |
| Diluted EPS ($) | 5.57 | 7.70 | 5.94 | 4.63 | 5.07 |
Nine-month net income was 52.95 billion dollars, up 20%. Diluted shares fell 3% year over year, which may have supported EPS growth.
Two readings
- Constructive: all three operating segments grew revenue, and ROTCE held at 20% year over year.
- Cautious: expenses outgrew revenue, and CET1 slipped from 14.8% a year ago.
The release contains no consensus comparison or formal guidance.
収益の中身:純利息収入とマーケッツ
Taking apart net interest income
Managed net interest income (NII) rose 13% to 27.1 billion dollars, but Markets NII jumped to 2.42 billion dollars from 0.68 billion a year earlier. Excluding Markets, NII grew a more modest 6% to 24.7 billion dollars.
Why “ex-Markets” matters
JPMorgan’s trading desks earn interest on financing and inventory, and hedge some of it through derivatives booked in principal transactions. Management therefore reviews lending, deposit and investing income separately from Markets.
Fee lines
- Asset management fees: 5.9 billion dollars, +15%
- Card income: 1.43 billion, +25%
- Investment banking fees: 2.96 billion, +13%
- Principal transactions: 6.5 billion, -8%
Margins and rates
The managed net yield on interest-earning assets was 2.48% versus 2.45% a year ago and 2.40% last quarter. The ex-Markets yield was 3.70%, slightly below 3.73% a year ago. Corporate NII fell 737 million dollars on lower rates.
Two readings
- Constructive: deposit, card and wholesale loan growth plus double-digit fee growth diversify earnings.
- Cautious: a large share of NII growth comes from Markets, which can fluctuate with client activity.
The +100bp earnings-at-risk estimate narrowed to 1.4 billion dollars from 1.8 billion last quarter.
CIB:投資銀行とマーケッツ
CIB in context
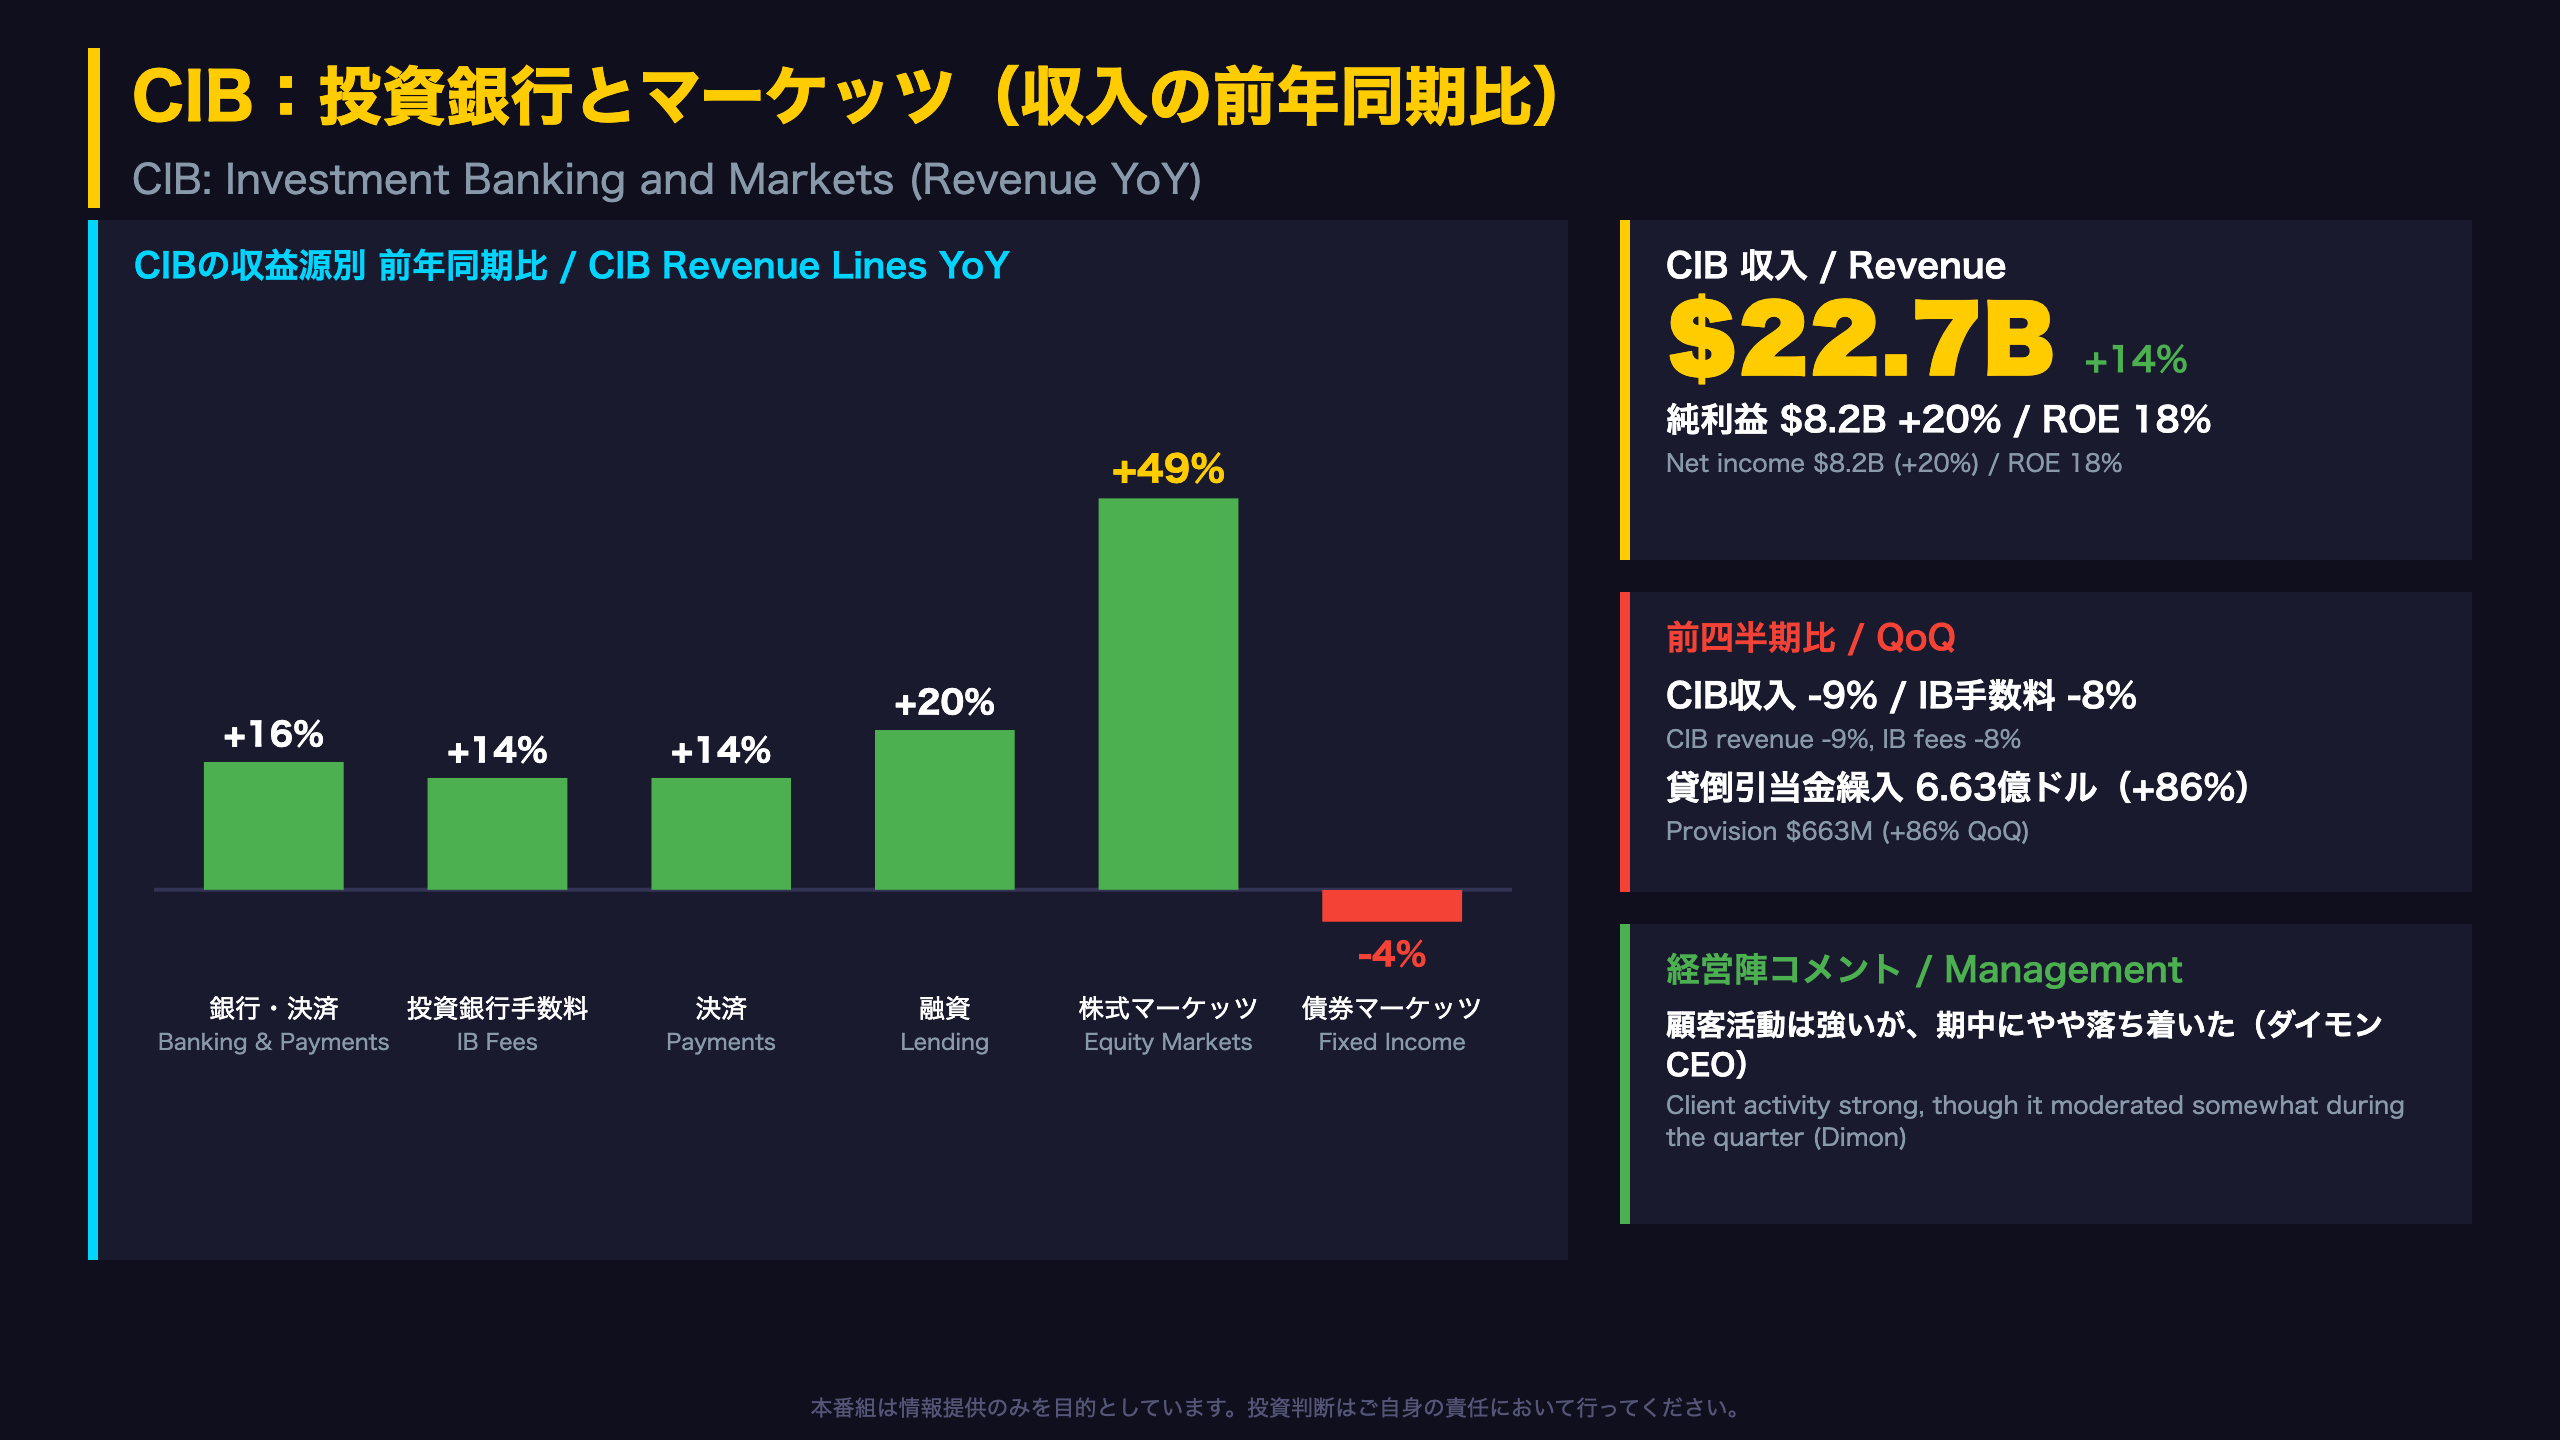
The Commercial and Investment Bank (CIB) is JPMorgan’s wholesale franchise covering investment banking, lending, payments and trading. Nine-month revenue was 70.97 billion dollars (+20%) and net income 26.97 billion (+32%). Nine-month Equity Markets revenue was 15.46 billion (+49%) and Fixed Income 18.50 billion (+8%).
Investment banking fee mix
| 3Q26 | QoQ | YoY | |
|---|---|---|---|
| Advisory | $1.22B | +21% | +32% |
| Equity underwriting | $0.56B | -32% | +7% |
| Debt underwriting | $1.22B | -15% | +4% |
- Commercial Banking revenue was 3.41 billion dollars (+16%); Commercial Real Estate Banking was 0.95 billion (+6%).
- CIB trading value-at-risk averaged 39 million dollars versus 25 million a year ago, indicating a larger risk footprint.
- The net charge-off rate was 0.14% versus 0.43% a year ago; nonaccrual loans fell 8%.
Management’s view
CEO Jamie Dimon: “Markets revenue and IB fees each rose at a mid-teens rate, helped by strong levels of client activity, although activity did moderate somewhat during the quarter.”
Two readings
- Constructive: growth is broad, spanning advisory, payments, lending and equities.
- Cautious: the equity result is concentrated in Prime and Derivatives, and sequential revenue declined.
Watch whether IB fees hold near 3 billion dollars next quarter.
CCBとAWM:消費者・資産運用部門
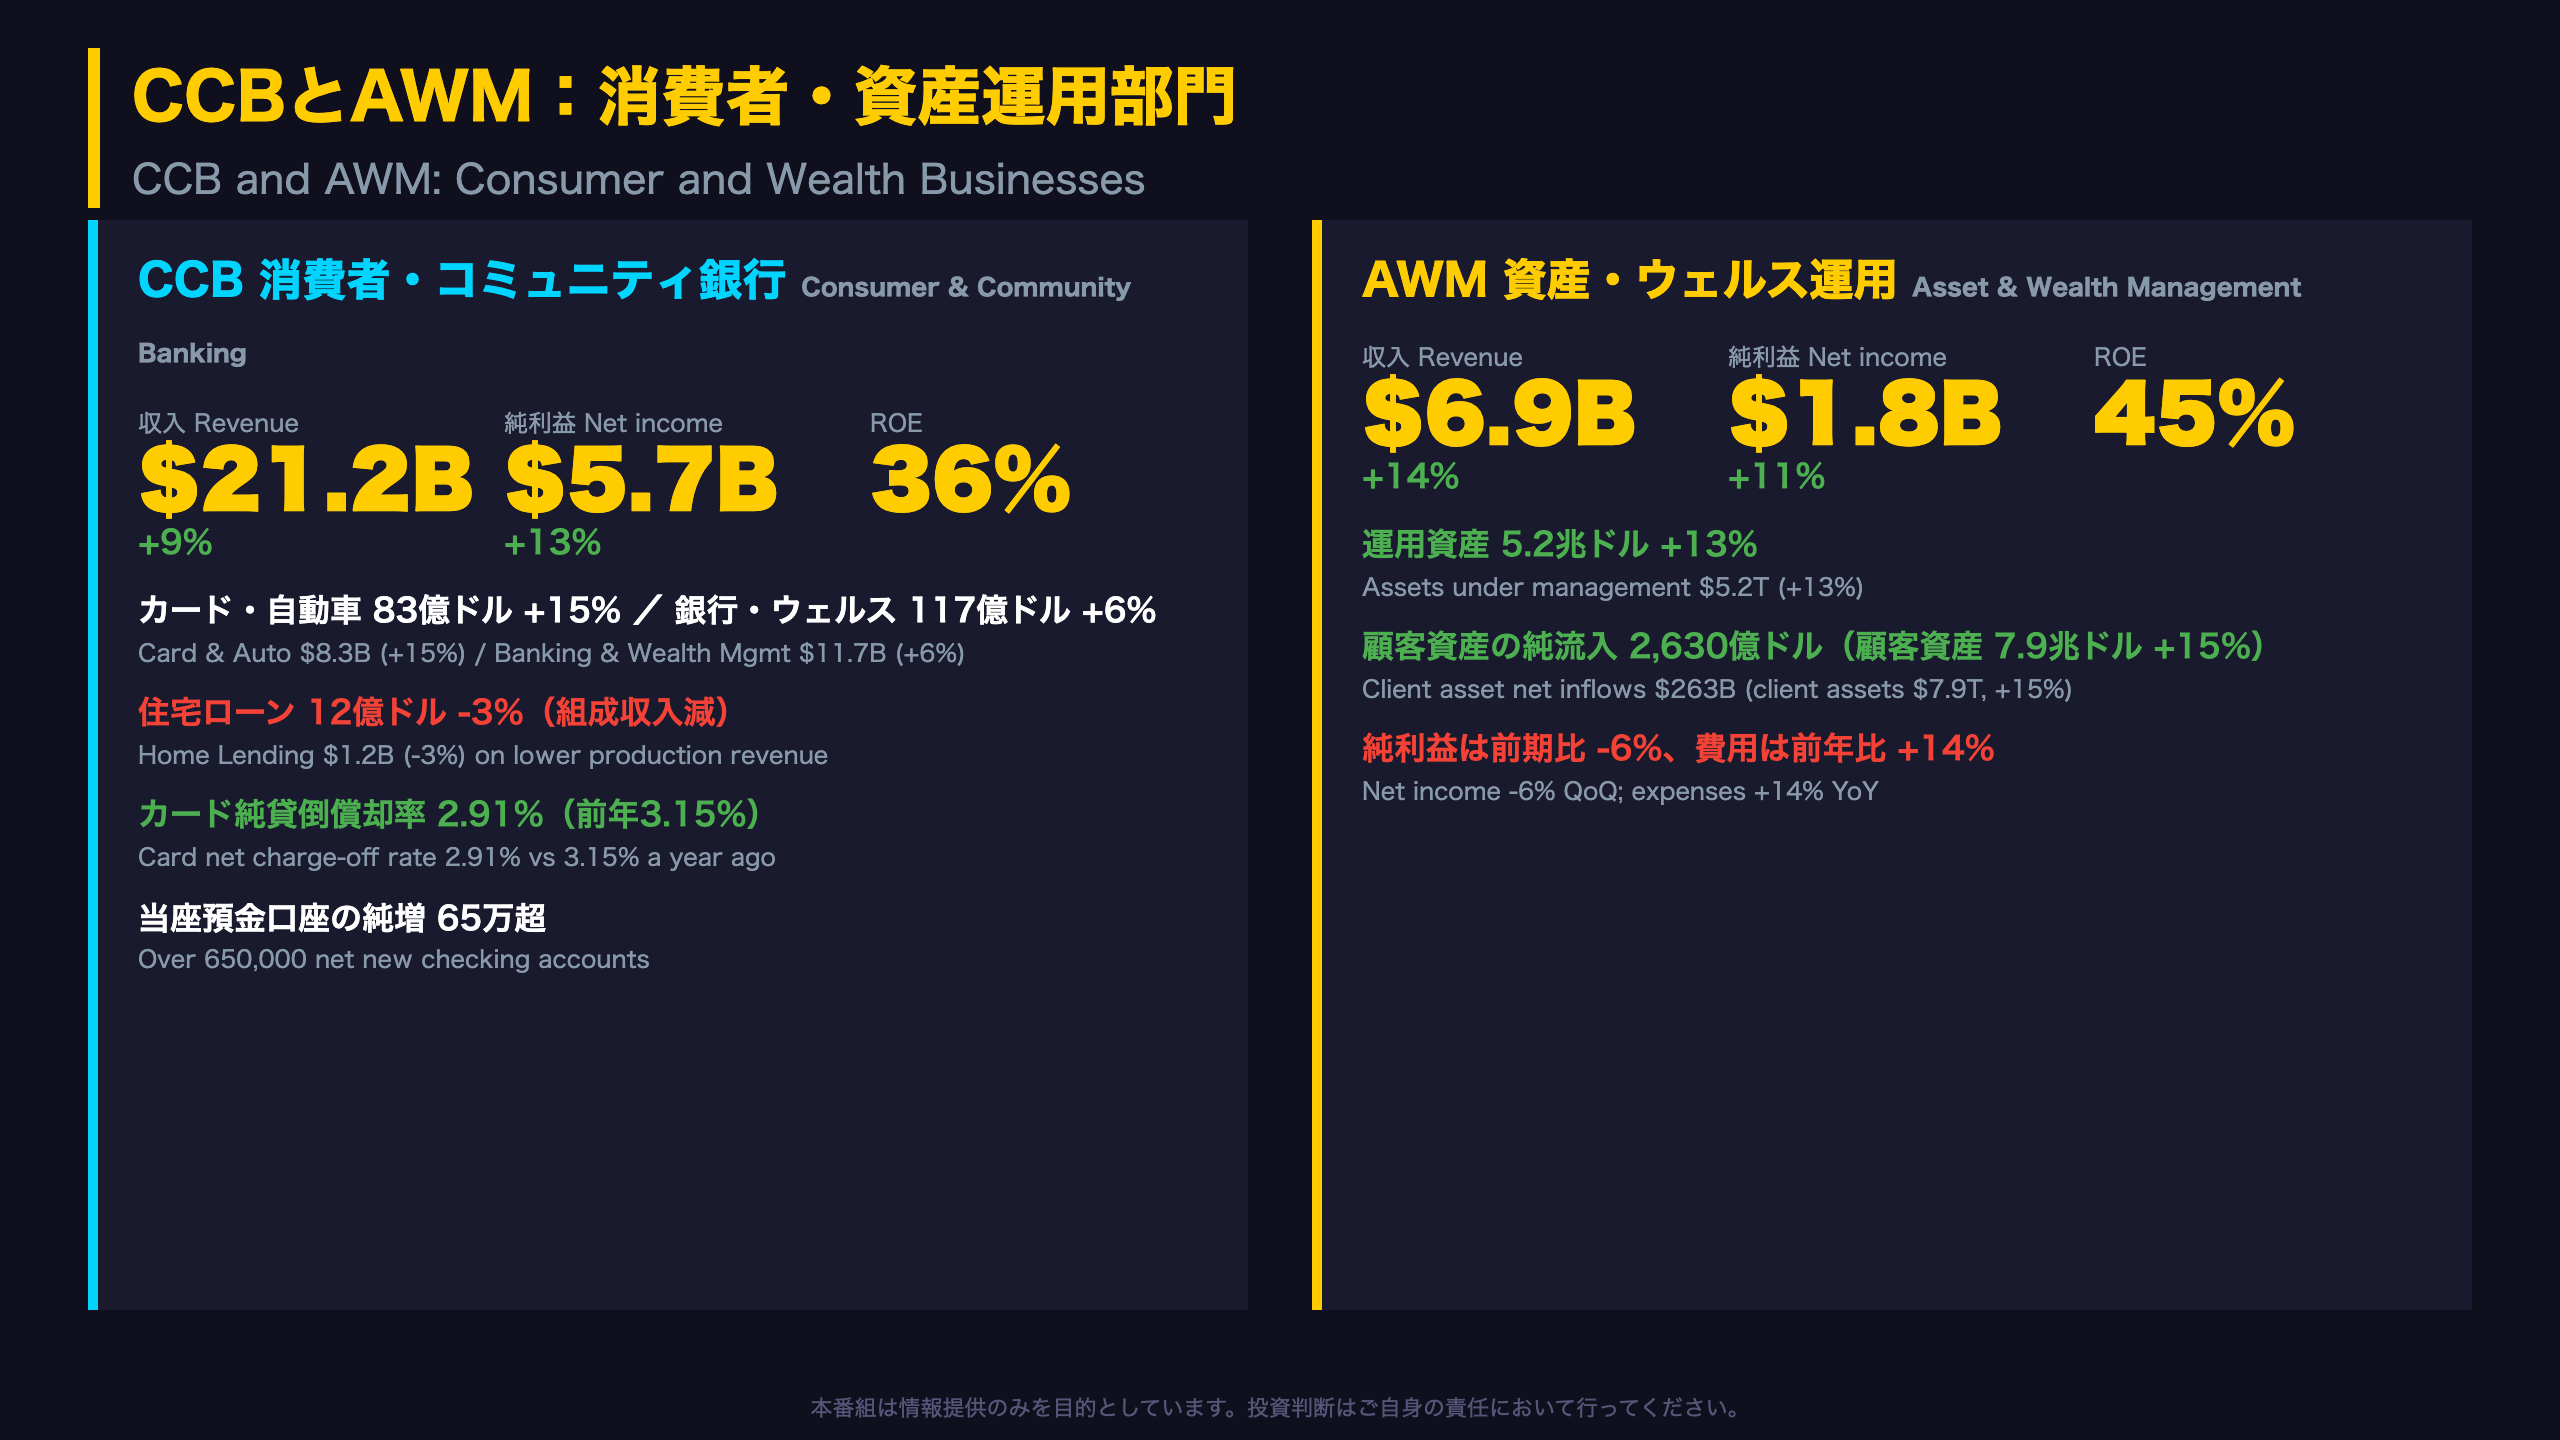
CCB: customer base and credit quality
Chase’s active digital customers reached 77.96 million (+5%) and mobile customers 64.9 million (+7%). Debit and credit card sales volume was 539.5 billion dollars (+10%). The deposit margin was 2.78%, versus 2.70% last quarter and 2.79% a year ago.
Credit indicators improved: the card 30+ day delinquency rate fell to 1.97% from 2.14% a year ago, and the 90+ day rate to 0.96% from 1.07%. Card loans ended the quarter at 252.7 billion dollars (+7%).
Softer spots
| Item | 3Q26 | YoY |
|---|---|---|
| Home Lending revenue | $1.22B | -3% |
| Mortgage production revenue | $46M | -73% |
| Business Banking avg. loans | $17.8B | -6% |
| Business Banking originations | $0.70B | -15% |
CCB expenses rose 12% to 11.58 billion dollars on marketing, technology and auto lease depreciation.
CEO Jamie Dimon: “We ranked #1 in U.S. retail deposits for the sixth consecutive year.”
AWM: Asset and Wealth Management
Global Private Bank revenue was 3.66 billion dollars (+16%) and Asset Management 3.25 billion (+11%). The pretax margin was 36% and the overhead ratio 63%. Private bank client advisors rose 10% to 4,460, which helps explain higher compensation expense.
Two readings
- Constructive: strong net inflows and double-digit growth in assets under management and client assets.
- Cautious: AWM profit fell 6% sequentially, and expense growth matched revenue growth at 14%.
費用・信用・資本と次の注目点
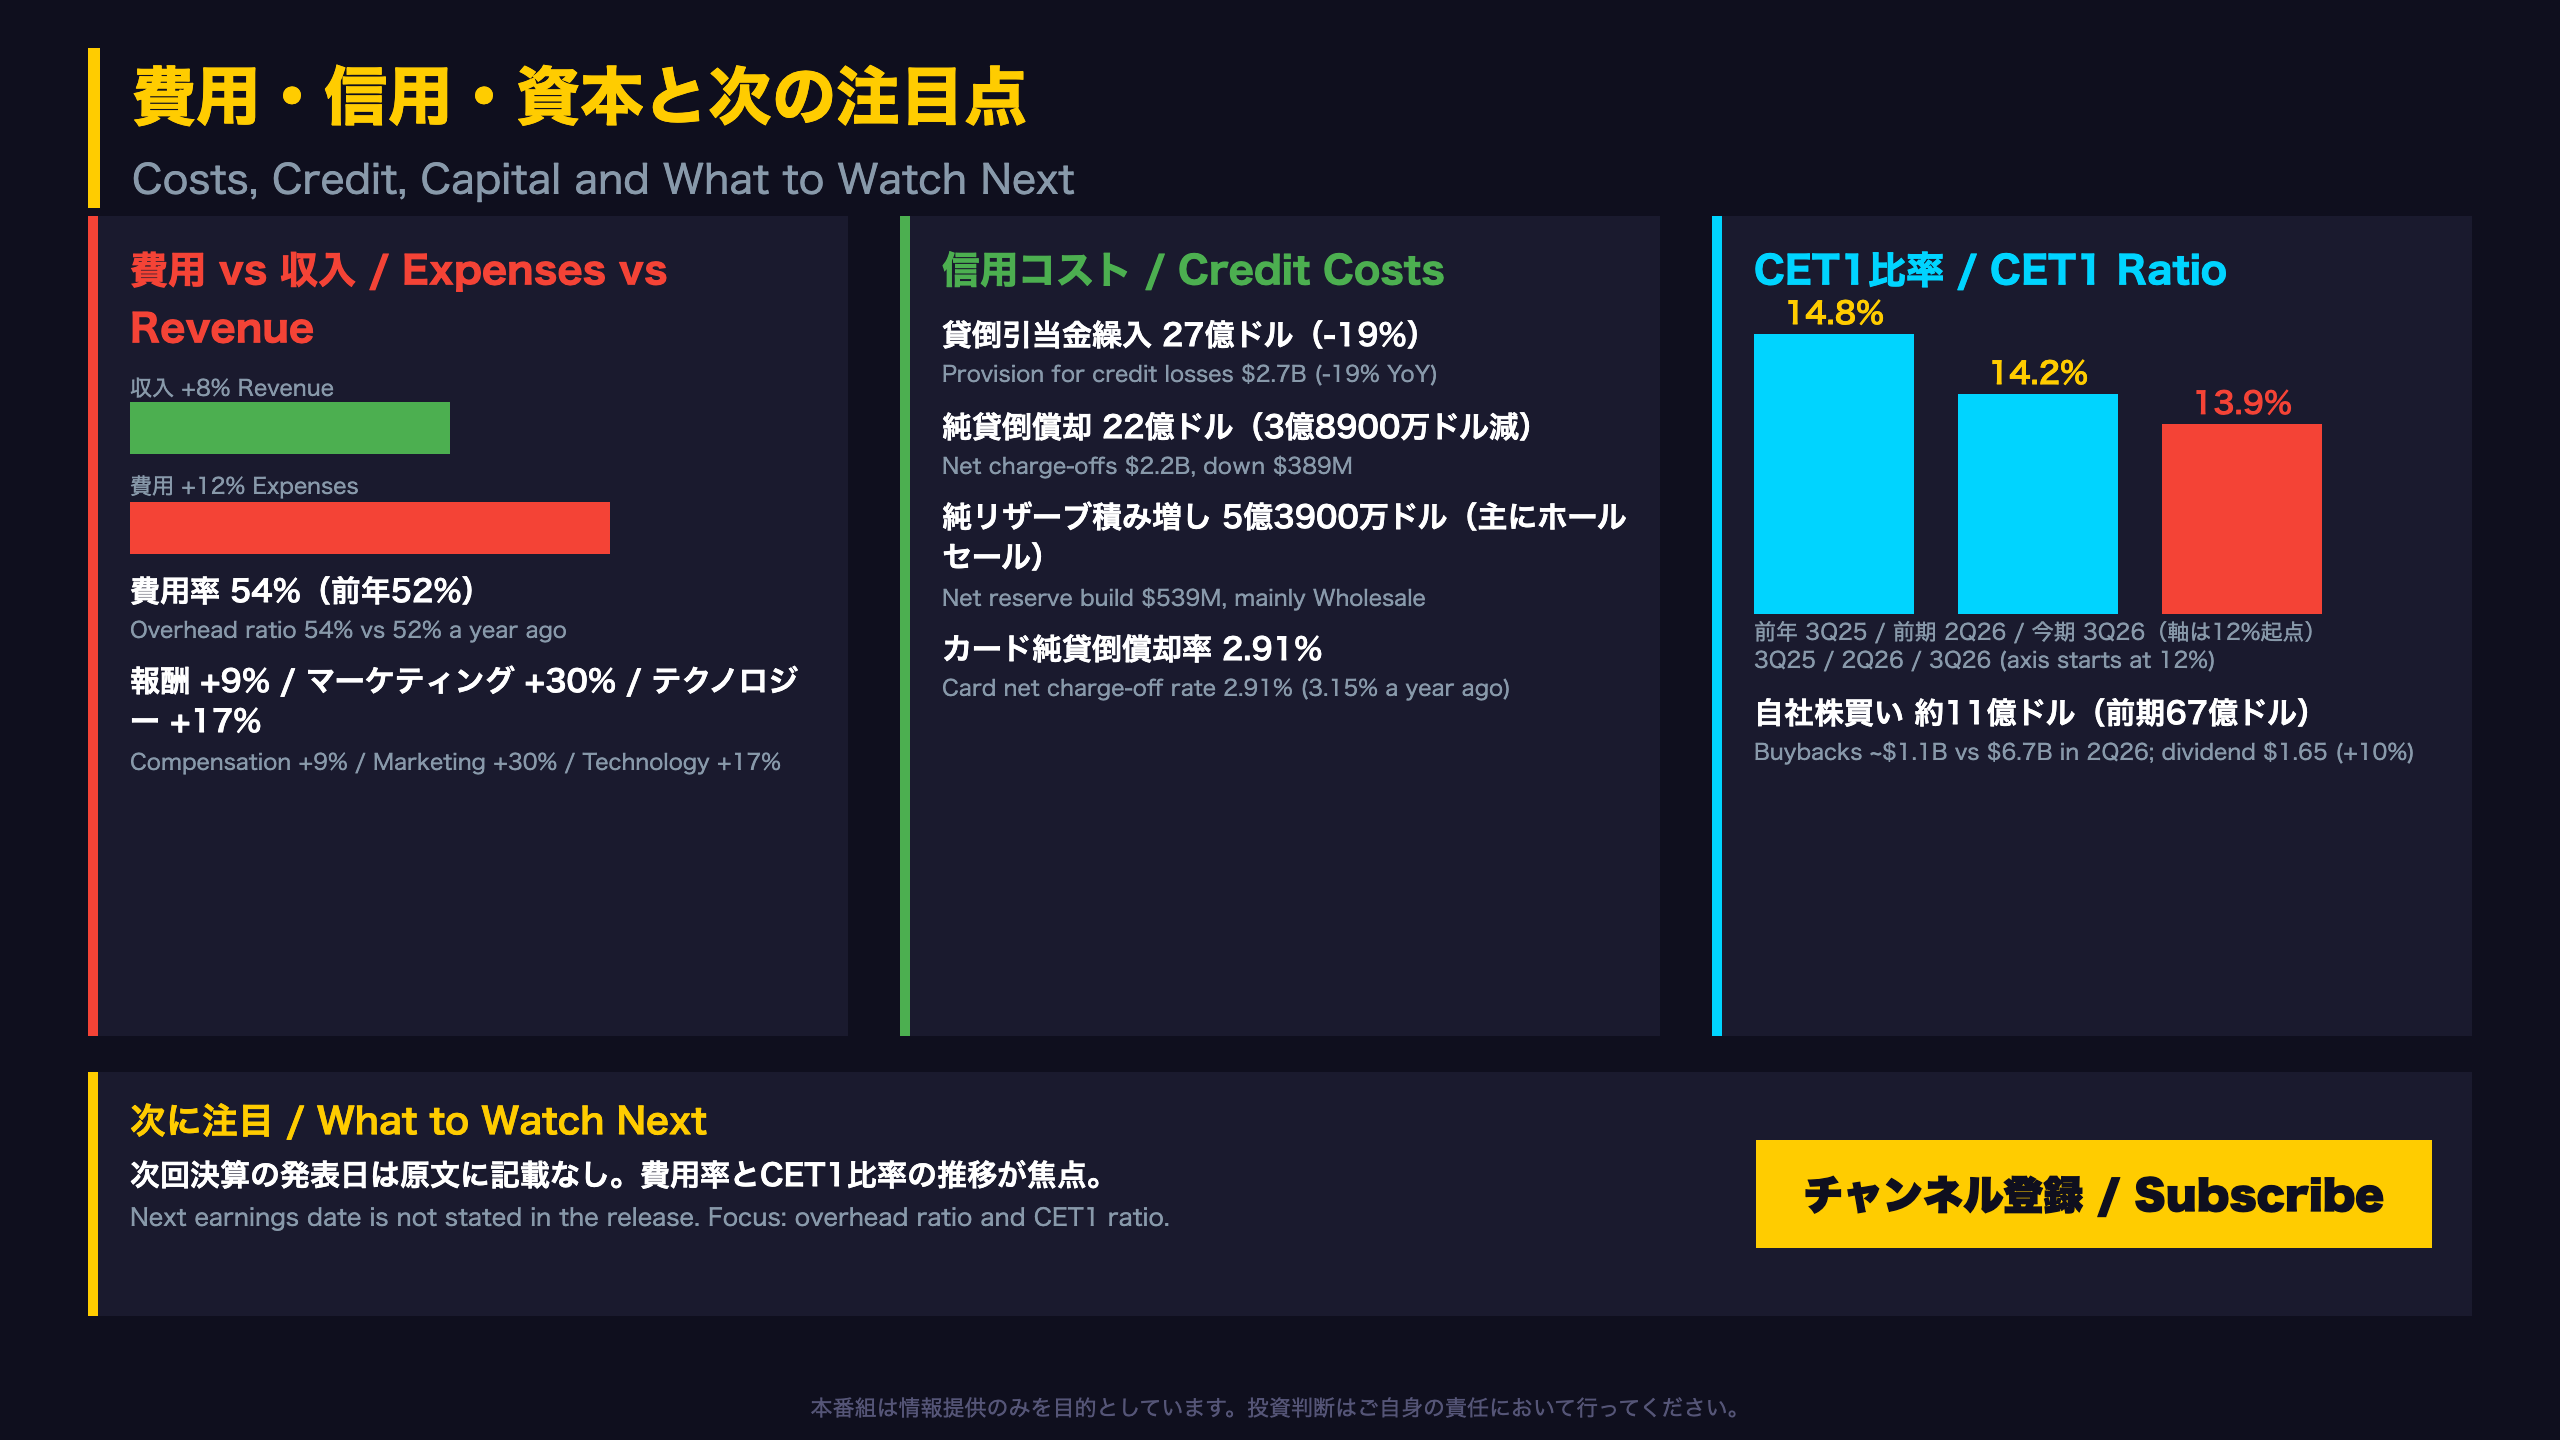
Credit quality: improving trends alongside reserve building
- The total allowance for credit losses was 31.93 billion dollars, up 11% year over year. The card allowance ratio fell to 6.16% from 6.61%, and the wholesale ratio to 1.02% from 1.08%.
- Total nonaccrual loans were 9.37 billion dollars, down 7%; the wholesale portion fell 13%.
- The net reserve build was 539 million dollars, mainly in Wholesale, versus 810 million a year ago.
Why CET1 slipped (quarterly roll-forward)
| Item | $M |
|---|---|
| Net income to common | +15,000 |
| Dividends | -4,433 |
| Net buybacks | -1,004 |
| AOCI: unrealized securities losses | -7,893 |
CET1 capital rose 1% to 304.1 billion dollars, but standardized risk-weighted assets grew 2%, so the ratio fell 0.3 points. Unrealized losses on investment securities weighed heavily, which suggests capital growth is not keeping pace with balance sheet growth. The supplementary leverage ratio was 5.5% and eligible external TLAC was 598.7 billion dollars.
Shareholder returns
JPMorgan repurchased 3.1 million shares (21.7 million last quarter) at an average 342.33 dollars. A new program of up to 50 billion dollars took effect July 1. The last-twelve-month net payout ratio was 61%.
CEO Jamie Dimon: “In line with our hierarchy, we reduced share repurchases this quarter.” He also cited large fiscal deficits, sticky inflation, elevated asset prices, rising interest rates and geopolitical conditions as forces shifting under the surface.
What to watch
The release does not give the next earnings date. Track whether the overhead ratio eases from 54% and whether CET1 recovers from 13.9%.
Disclaimer: This article is for informational purposes only. All investment decisions are made solely at your own risk.