📺 Watch the Full Video Analysis
This article was automatically generated by the NFC Market Live AI analysis system. (Updated: 2026-10-09 16:01 JST)
📄 Primary Source
Statistics Norway
https://www.ssb.no/en/priser-og-prisindekser/konsumpriser/statistikk/konsumprisindeksen
📊 Statistics Norway (SSB) released September 2026 CPI data on October 9.\n\n📈 Headline CPI accelerated to +3.4% YoY, up sharply from +3.0% in July.\nThe core measure CPI-ATE (adjusted for tax changes, excl. energy) rose to +3.0%, breaching the key threshold and well above Norges Bank’s 2.0% target.\n\n🔍 Key findings:\n• Services inflation sticky at +3.8% YoY\n• Insurance & financial services at +7.9% — the highest category\n• Restaurants & accommodation at +6.0%\n• Furnishings the sole deflationary category at -1.1%\n\n⚠️ CPI-AT (tax-adjusted) hit +5.2%, signaling broad price pressure beyond tax effects.\n\nNext release: November 10. Focus on whether services inflation persistence continues in October data.
The Ultimate Summary: コアCPI 3.0%突破、利下げシナリオに暗雲
What Is Norway’s CPI and Why Does It Matter?
Norway’s Consumer Price Index (CPI) is published monthly by Statistics Norway (SSB, Statistisk sentralbyrå), the country’s national statistics office. It measures the price development of goods and services purchased by private households. The CPI-ATE — adjusted for tax changes and excluding energy products — is the core inflation gauge that Norges Bank (Norway’s central bank) uses as its primary reference for monetary policy decisions.
September 2026 in Context
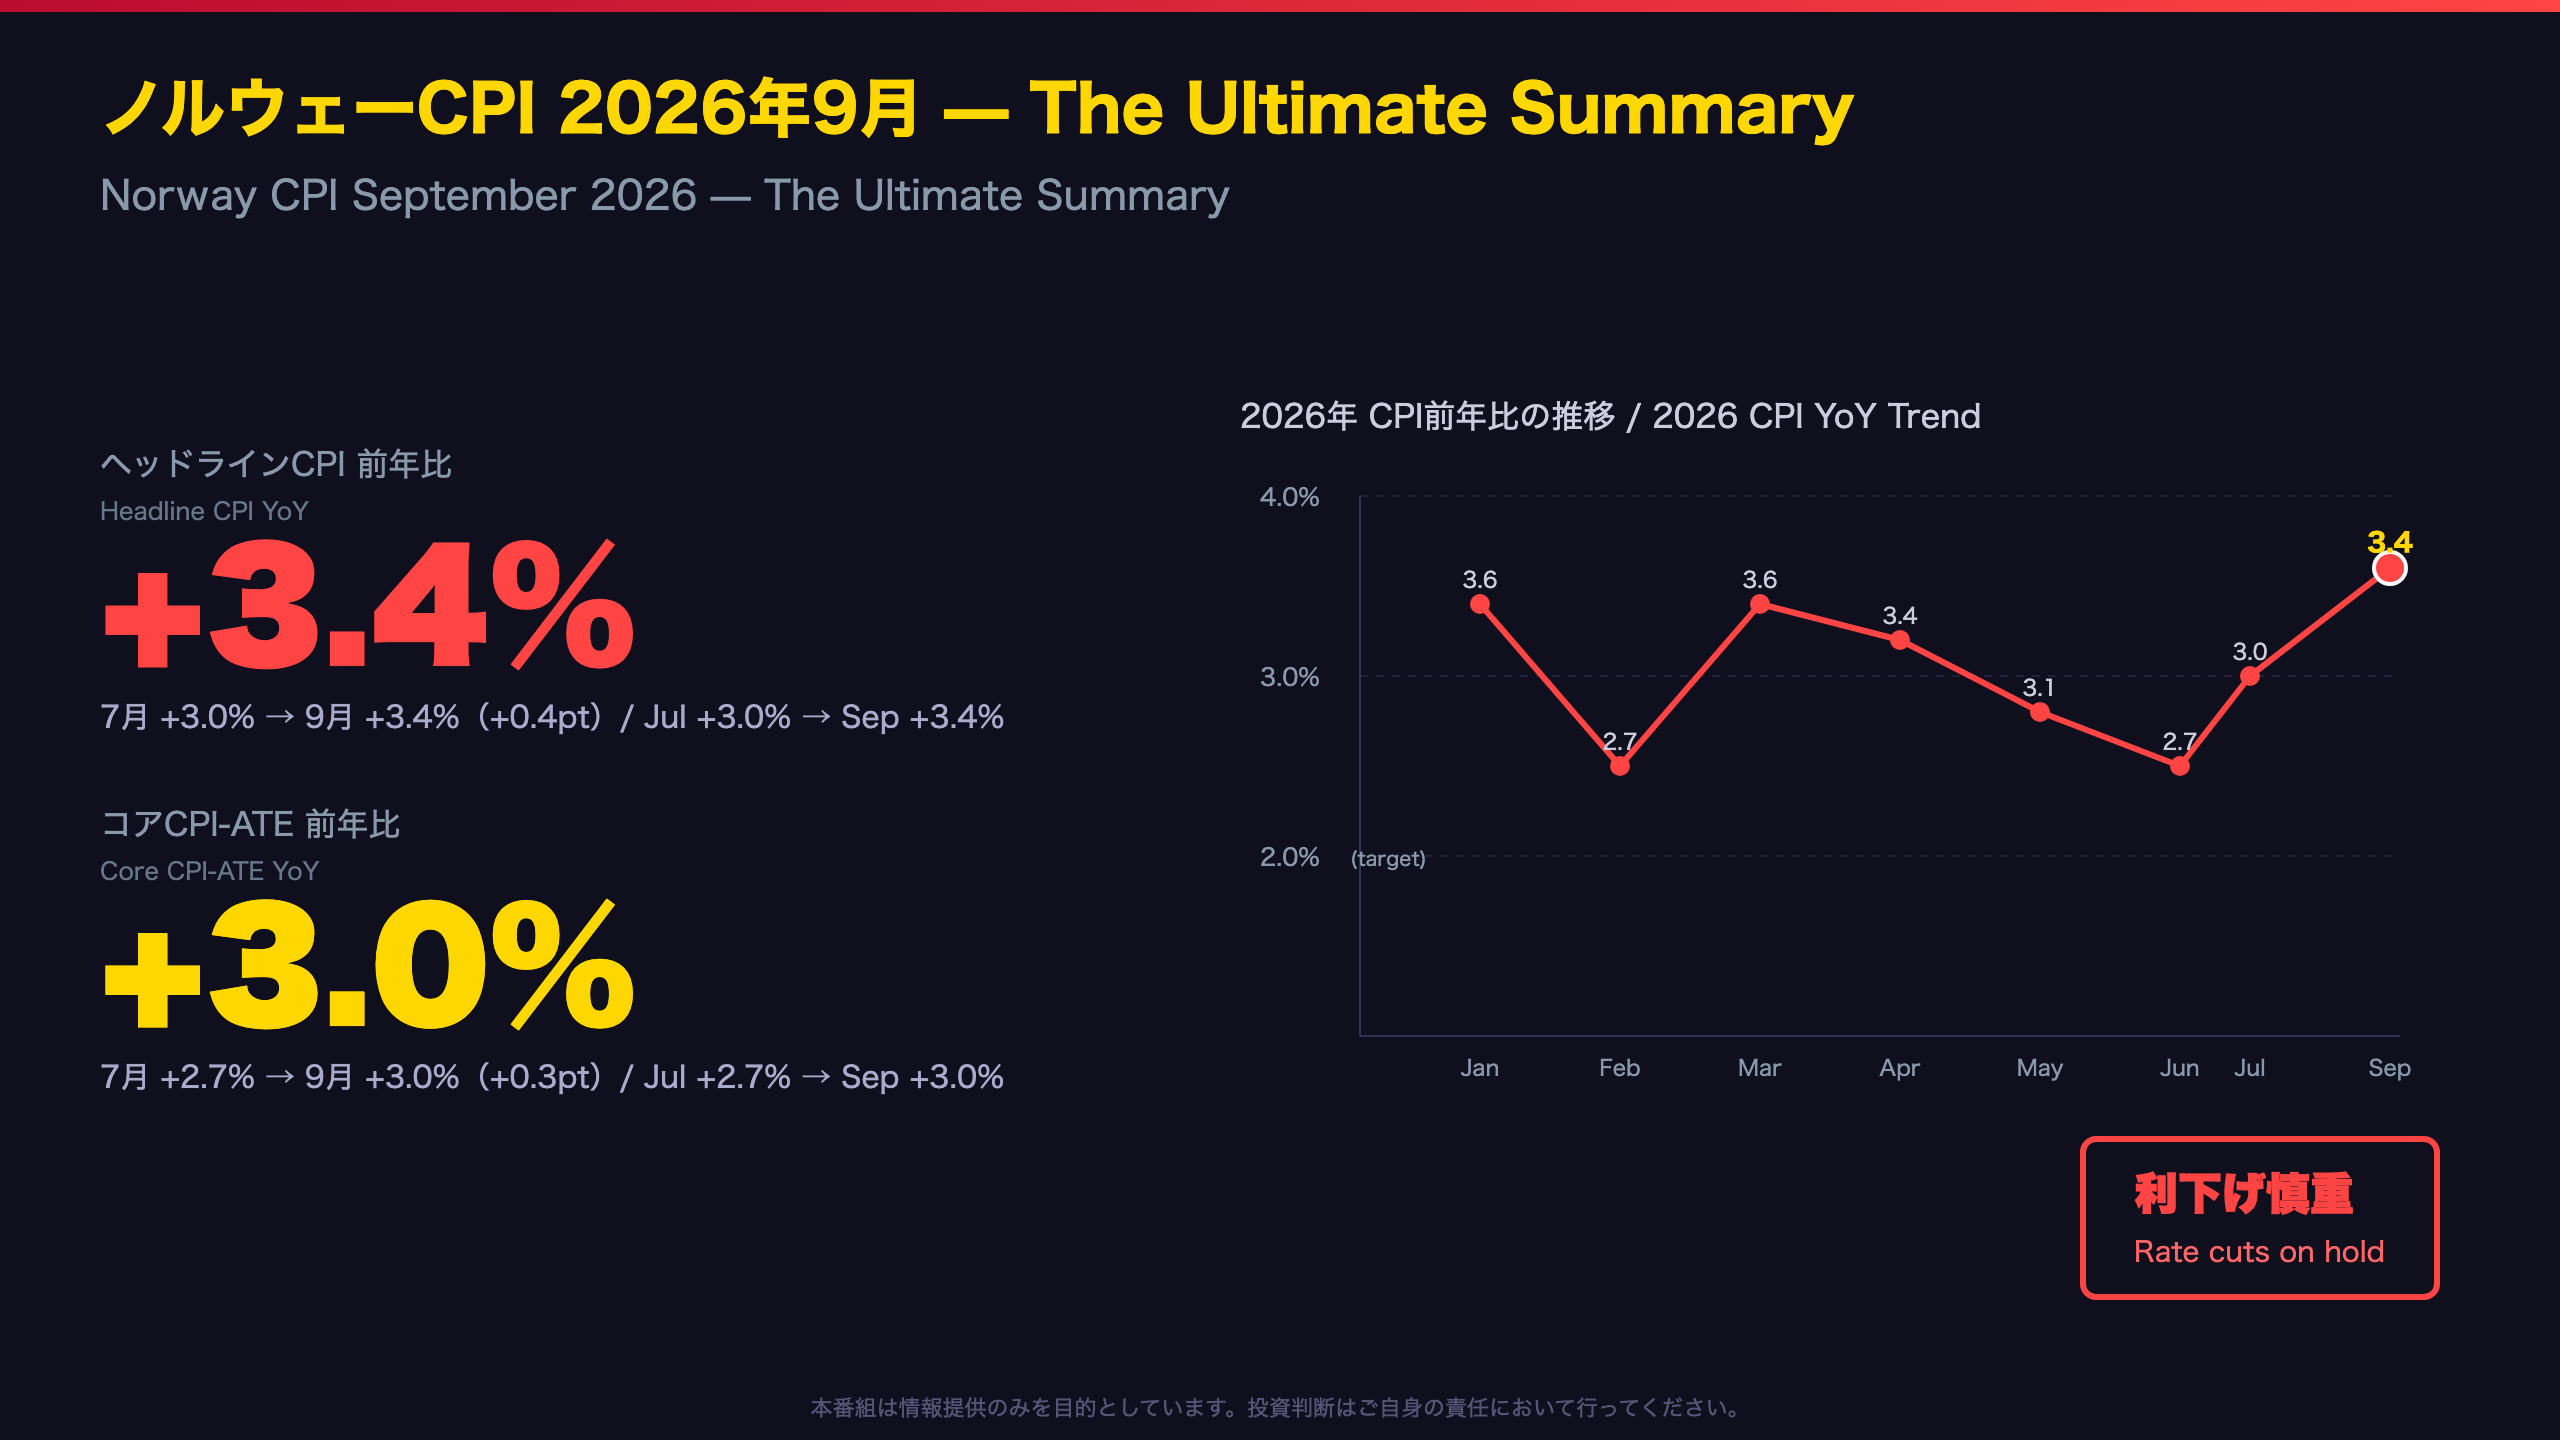
Headline CPI came in at +3.4% year-on-year, the joint-highest reading of 2026 (matching April). The trajectory through 2026 has been volatile: Jan +3.6%, Feb +2.7%, Mar +3.6%, Apr +3.4%, May +3.1%, Jun +2.7%, Jul +3.0%, and now Sep +3.4%. The re-acceleration from the June trough is notable.
SSB stated: “From September 2025 to September 2026 the Consumer Price Index (CPI) rose by 3.4 per cent, while the CPI adjusted for tax changes and excluding energy products (CPI-ATE) rose by 3.0 per cent.”
CPI-ATE Breaches 3.0%
The core measure CPI-ATE rose from +2.7% in July to +3.0% in September. This is significant because Norges Bank targets 2.0% inflation over time. A core reading of 3.0% — a full percentage point above target — suggests that underlying price pressures are broadening rather than fading. For international comparison, the ECB’s eurozone core HICP has been trending lower toward 2.5%, making Norway’s re-acceleration a relative outlier among European economies.
Monthly Change and Seasonality
The month-on-month change (August to September) was +0.5%. Looking at the same month in prior years — September 2025 was roughly +0.4% MoM, September 2024 about +0.3% — the current reading is modestly above seasonal norms.
Next Release
The October CPI will be published on November 10, 2026. Whether CPI-ATE remains at or above 3.0% will be critical for Norges Bank’s December policy meeting.
カテゴリ別分析: サービスvs財の二極化
Structural Stickiness in Services Inflation
The Labor-Intensive Services Surge
The most striking sub-indicator in this release is “Services where labor dominates,” which jumped to +4.1% YoY from just +0.1% in July — a 4.0 percentage point swing in two months. Even excluding administered prices, this measure rose to +4.3% (from +3.8% in July), suggesting accelerating wage-cost pass-through.
For context, Norges Bank closely monitors this category as a proxy for domestically generated inflation. A reading above 4% signals that the labor market remains tight enough for firms to pass higher wages onto consumers.
High-Inflation Service Categories
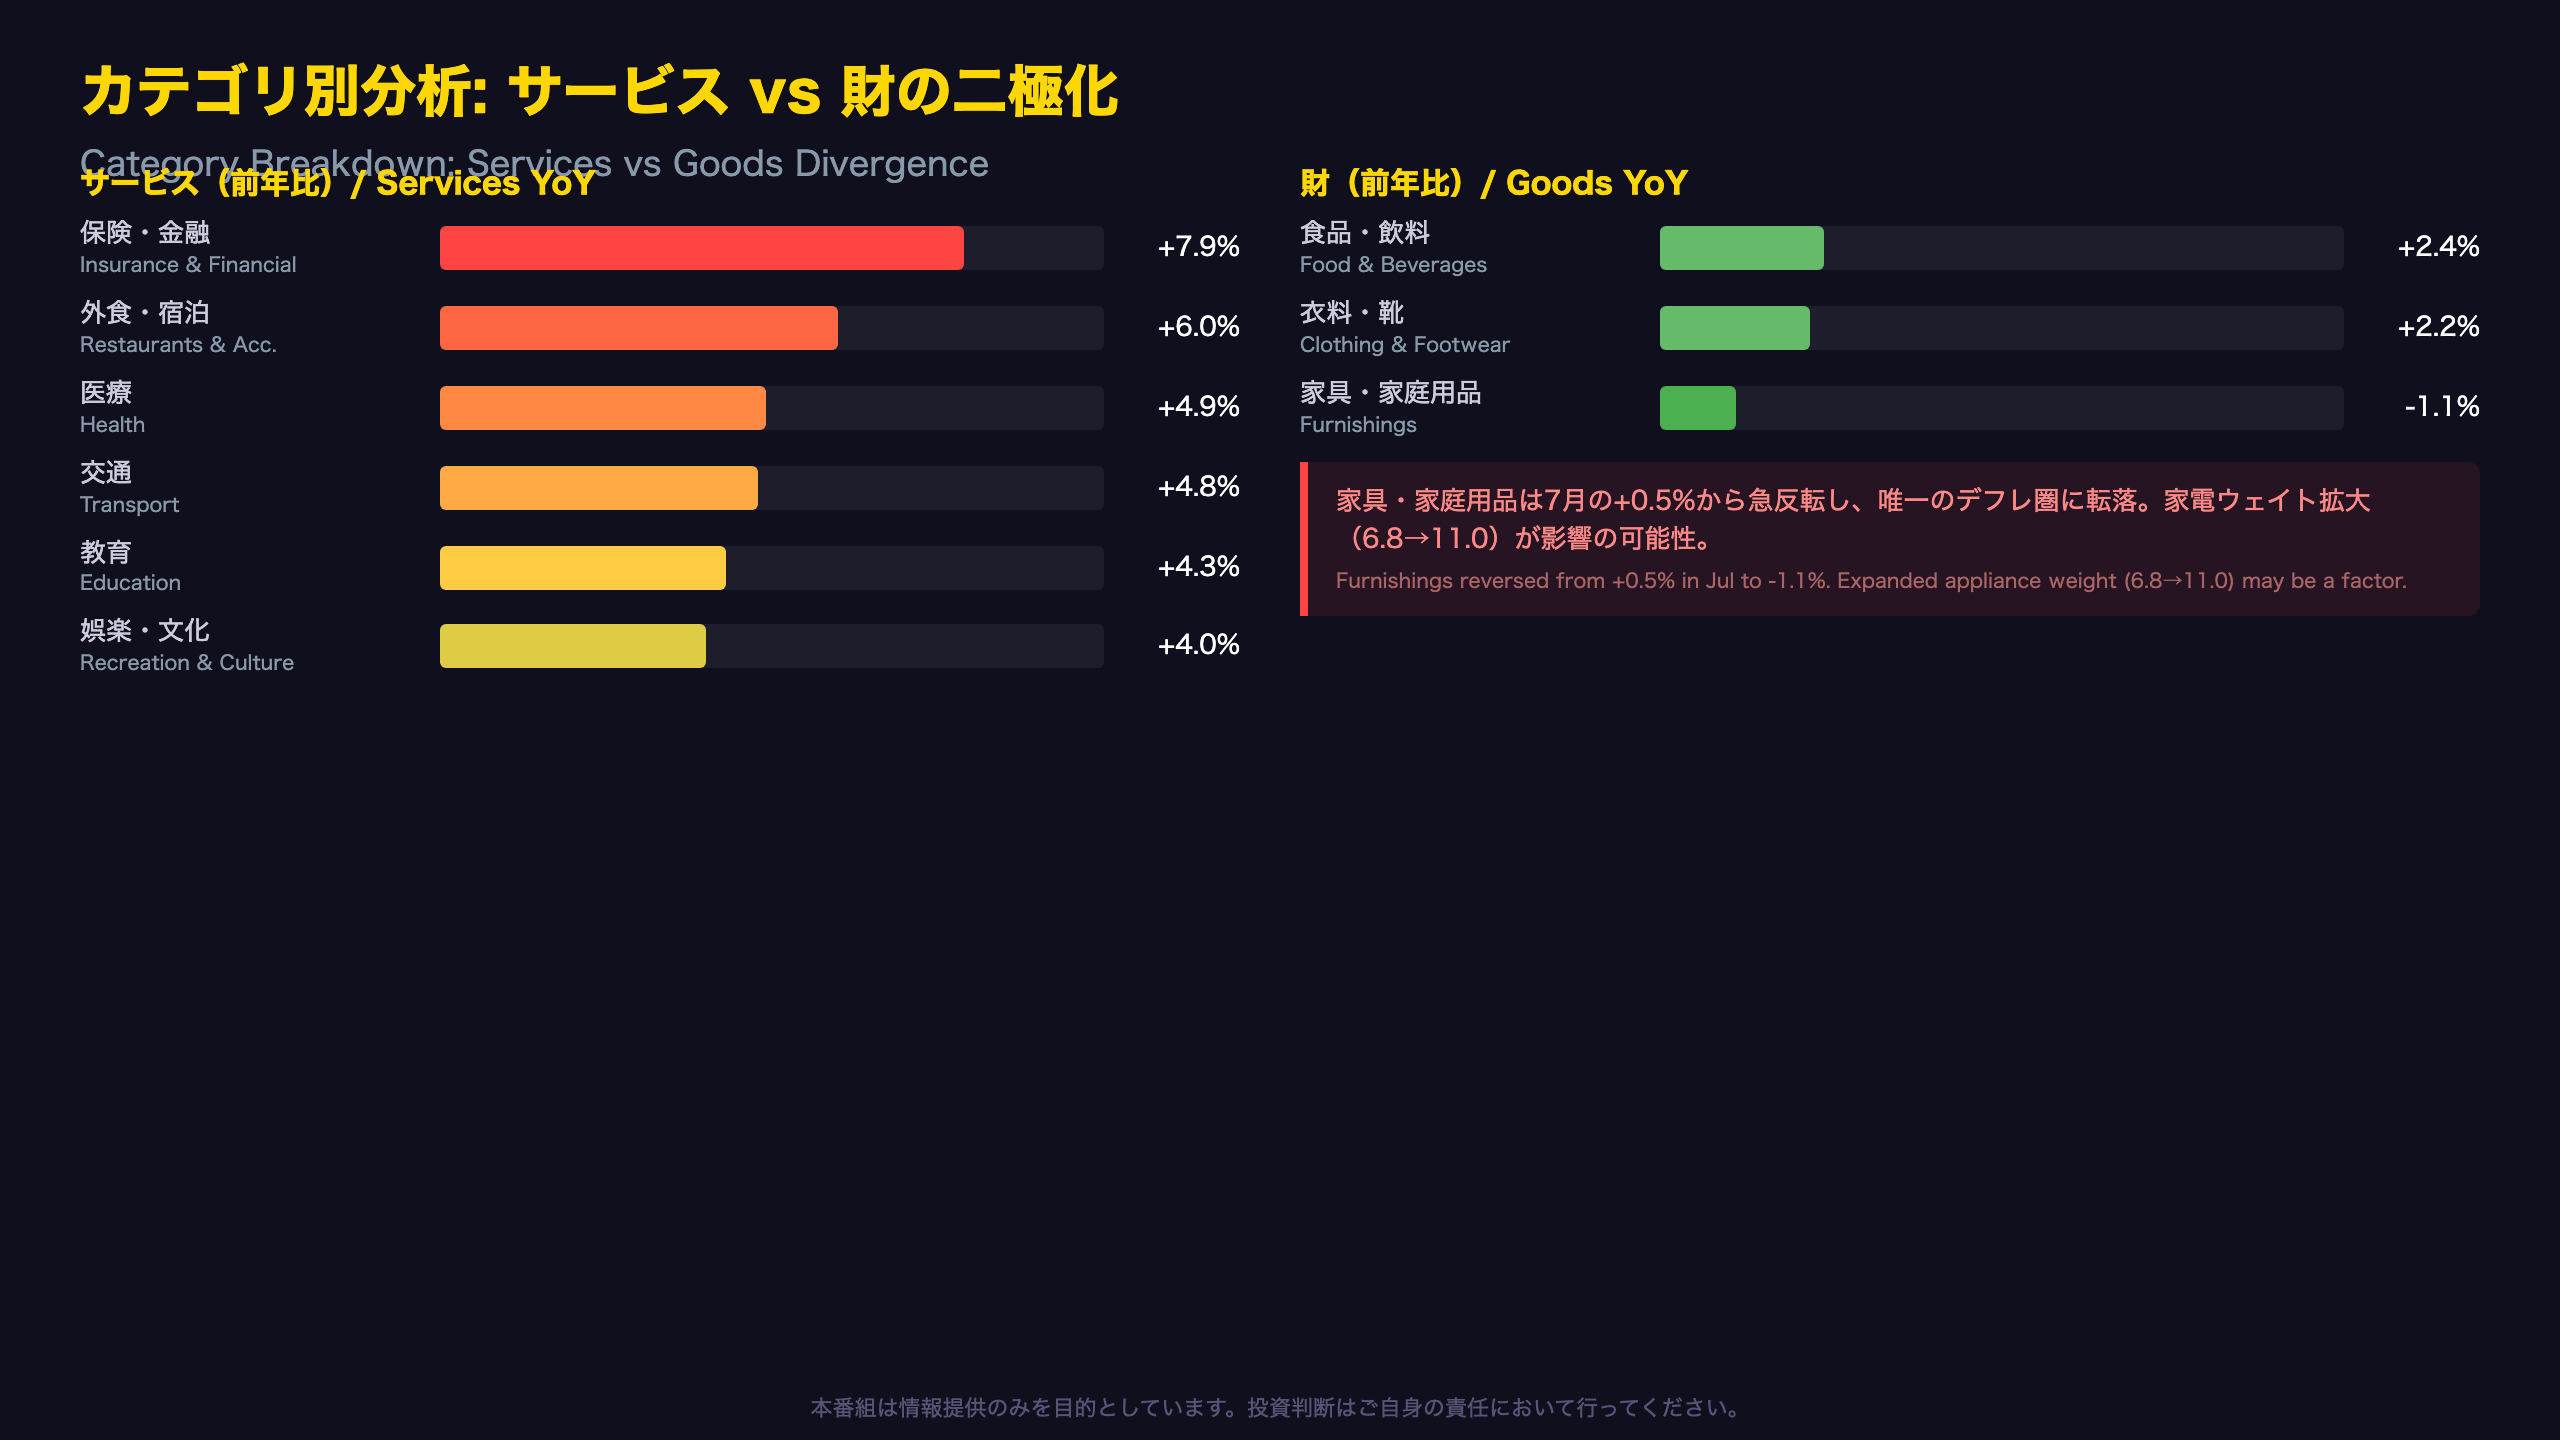
| Category | Jul YoY | Sep YoY | Change |
|---|---|---|---|
| Restaurants & Accommodation | +5.7% | +6.0% | +0.3pt |
| Insurance & Financial Services | +7.9% | +7.9% | Flat |
| Health | +4.4% | +4.9% | +0.5pt |
| Education | +2.4% | +4.3% | +1.9pt |
| Transport | +2.6% | +4.8% | +2.2pt |
The breadth of acceleration across services — education nearly doubling, transport almost doubling — is a red flag for Norges Bank. This is not a single-category story.
Goods Deflation: Furnishings Lead the Way
Furnishings and household equipment fell to -1.1% YoY, the only deflationary category. The weight of household appliances within this group expanded from 6.8 to 11.0, and falling appliance prices may be dragging the entire category lower. This goods-services divergence mirrors patterns seen in the US and eurozone, where goods disinflation has been offset by persistent services inflation.
Weight Structure Shift
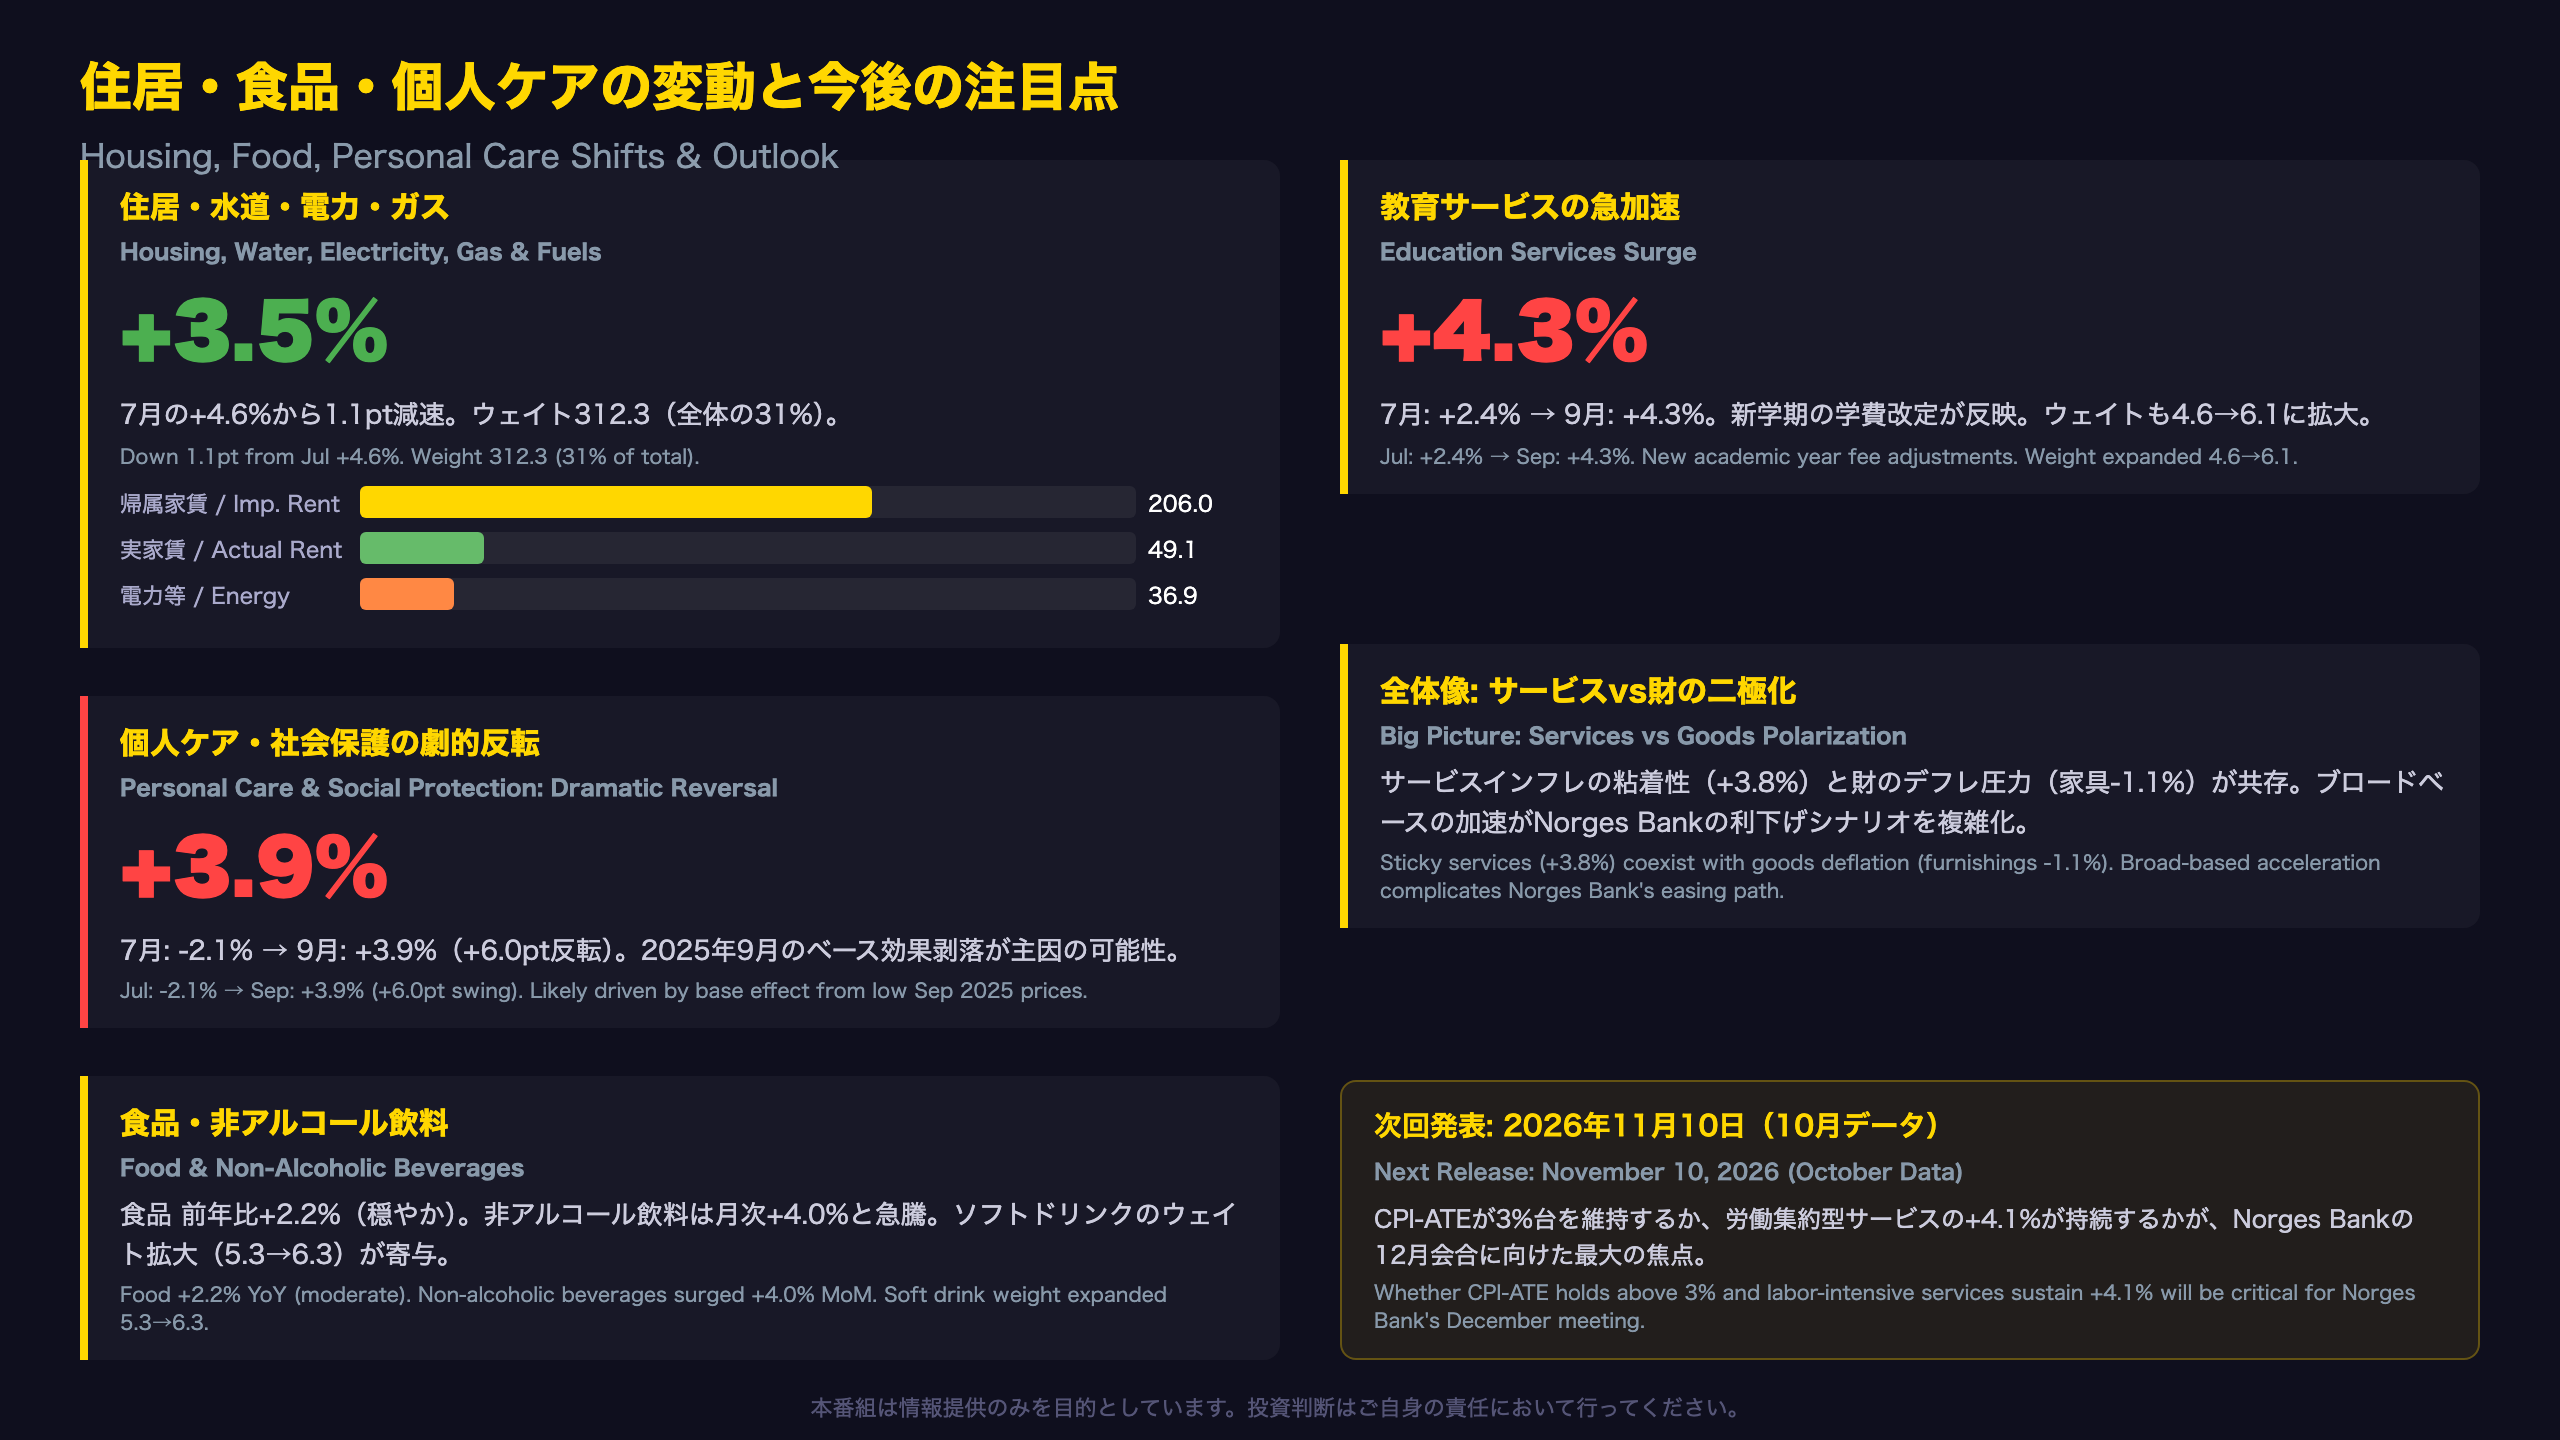
Housing’s CPI weight surged from 253.4 to 312.3, driven by imputed rents rising from 138.5 to 206.0. While housing inflation decelerated from +4.6% to +3.5% YoY, the much larger weight means its absolute contribution to headline CPI remains substantial.
コアCPI-ATEの深掘り: 税・エネルギー除外後も圧力拡大
Decomposing CPI-ATE
What the CPI-AT vs CPI-ATE Gap Reveals
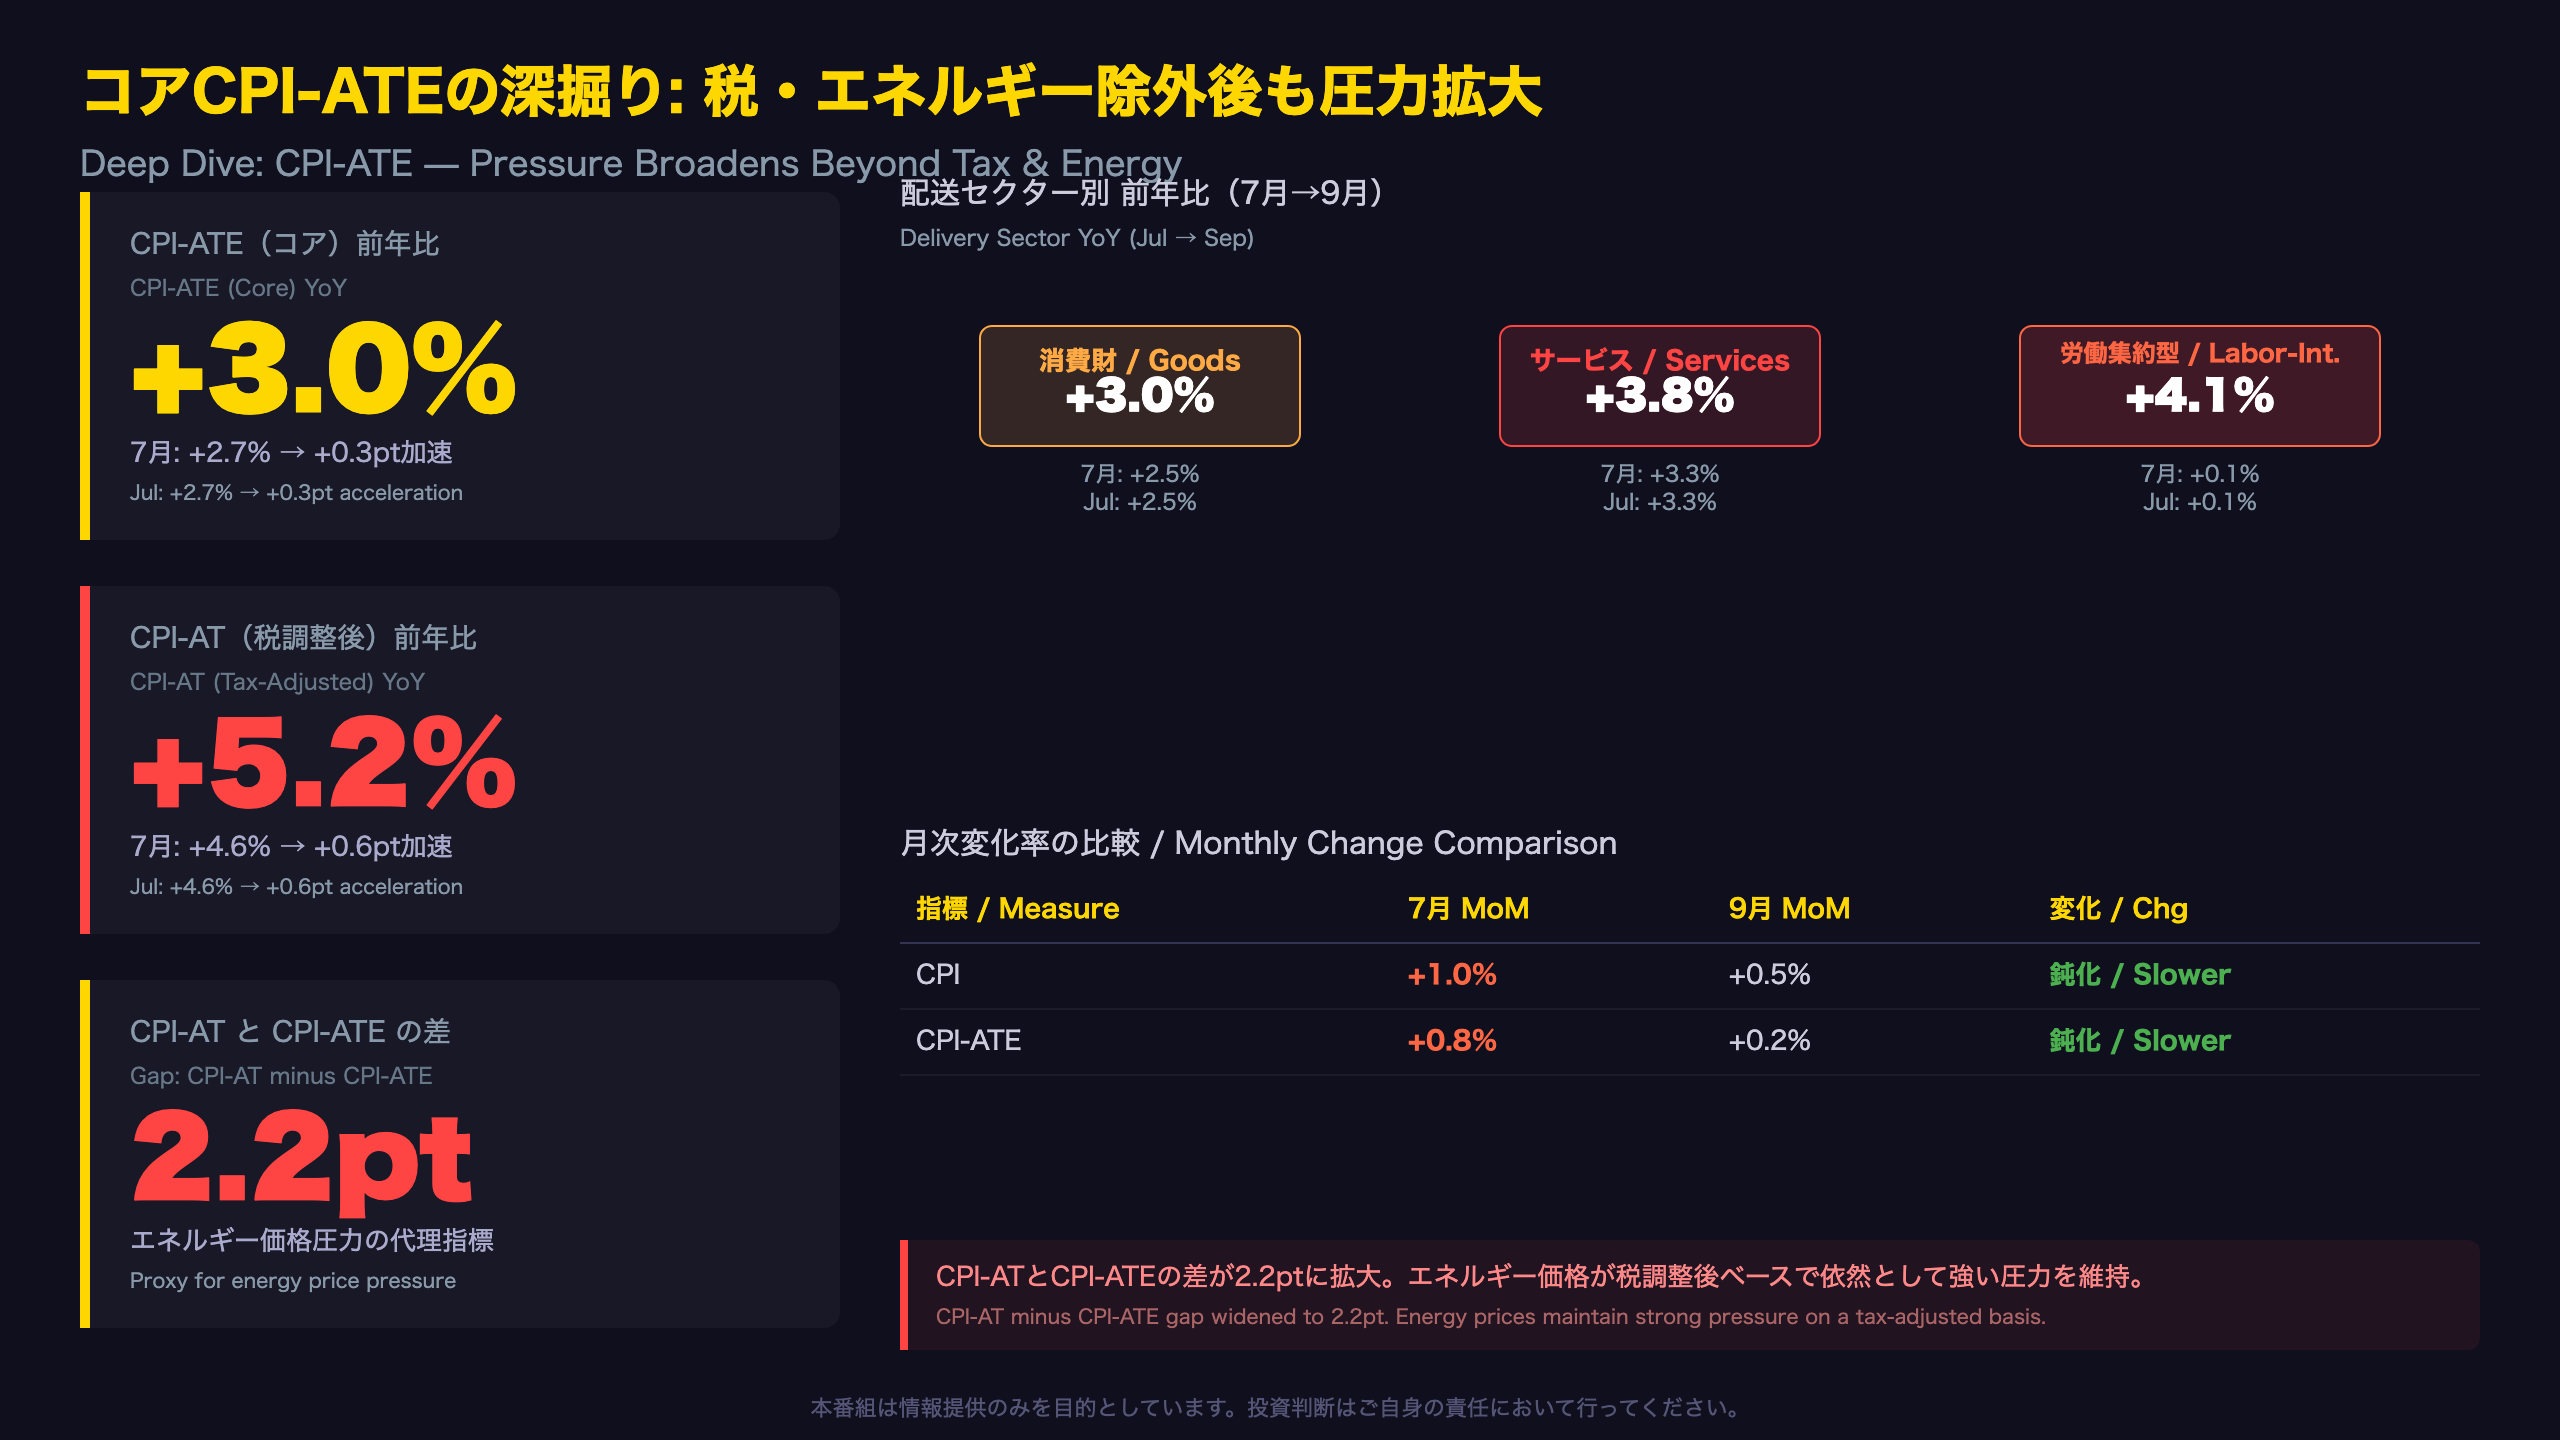
CPI-AT (tax-adjusted CPI) came in at +5.2% YoY, while CPI-ATE (tax-adjusted, excluding energy) was +3.0%. The 2.2 percentage point gap has widened from 1.9 points in July (4.6% minus 2.7%). This divergence reflects energy price pressures that persist even after tax adjustments.
For international readers: CPI-ATE is Norway’s equivalent of “core CPI” but with a twist — it also strips out the effect of tax changes (VAT, excise duties on fuel, alcohol, tobacco, etc.). This makes it a cleaner measure of underlying demand-driven inflation than a simple ex-food-and-energy core.
Monthly Change Interpretation
| Measure | Jul MoM | Sep MoM |
|---|---|---|
| CPI | +1.0% | +0.5% |
| CPI-ATE | +0.8% | +0.2% |
The monthly deceleration looks reassuring at first glance, but July’s +0.8% MoM for CPI-ATE was inflated by seasonal effects (food prices surged +3.2% MoM, clothing fell -3.0% as summer sales ended). September’s +0.2% is roughly in line with historical seasonal norms.
Delivery Sector Breakdown
Consumer goods inflation accelerated to +3.0% YoY (from +2.5% in July), while services rose to +3.8% (from +3.3%). The simultaneous acceleration in both goods and services — a “broad-based” price increase — is the most hawkish signal in this report for Norges Bank.
For comparison, in the eurozone, goods inflation has been trending toward 1% while services remain sticky near 3.5-4%. Norway’s goods inflation at 3.0% is notably higher, possibly reflecting the weaker Norwegian krone’s pass-through effect on imported goods prices.
SSB: “The CPI increased by 0.5 per cent from August to September, while the CPI-ATE increased by 0.2 per cent in the same period.”
住居・食品・個人ケアの変動と今後の注目点
Housing Category: Structural Weight Shift
The Imputed Rent Weight Surge
The housing category’s total weight jumped from 253.4 in 2025 to 312.3 in 2026, a 23% increase. The bulk of this came from imputed rents (the estimated cost of owner-occupied housing), whose weight surged from 138.5 to 206.0 — a 49% increase.
For international readers: Norway’s CPI includes imputed rents, unlike the Harmonized Index of Consumer Prices (HICP) used for European comparisons. This means Norway’s headline CPI is more sensitive to housing market valuations than the HICP. The dramatic weight increase suggests that National Accounts data (which provides the weights) has reassessed the share of housing consumption upward, possibly reflecting rising Norwegian property values.
Housing Inflation Decelerating
Despite the larger weight, housing inflation decelerated to +3.5% YoY from +4.6% in July. The electricity, gas and fuels sub-weight shrank from 46.8 to 36.9, reducing the direct energy impact. However, the CPI-AT vs CPI-ATE gap (2.2pt) confirms that energy pressures persist on a tax-adjusted basis.
Notable Category Swings
Personal Care & Social Protection: Dramatic Reversal
This category swung from -2.1% YoY in July to +3.9% in September — a 6.0 percentage point turnaround. The most likely explanation is a base effect: September 2025 prices in this category were unusually low, and as that comparison month rolled off, the year-on-year rate mechanically jumped. The original SSB release does not explicitly address this swing.
Non-Alcoholic Beverages: Monthly Spike
Non-alcoholic beverages surged +4.0% MoM, with soft drinks weight expanding from 5.3 to 6.3. This could reflect seasonal demand, raw material cost increases, or the Norwegian sugar tax impact.
Education Services: New Academic Year Effect
Education jumped to +4.3% YoY (from +2.4% in July) with a +4.3% MoM increase. September marks the start of the academic year in Norway, when tuition and fee adjustments typically take effect. The weight expanded from 4.6 to 6.1.
What to Watch Next
The October CPI will be released on November 10, 2026. Key questions:
1. Does CPI-ATE hold at or above 3.0%? If so, Norges Bank’s December meeting becomes significantly more hawkish.
2. Was the labor-intensive services surge to +4.1% a one-off or the start of a trend?
3. Will housing inflation continue to decelerate despite the expanded weight?
Norges Bank’s policy rate currently sits at 4.50% (as of the most recent decision). The central bank has signaled a gradual easing path, but persistent core inflation above 3% could delay or reverse that guidance.
Disclaimer: This article is for informational purposes only. All investment decisions are made solely at your own risk.







