
📺 Watch the Full Video Analysis
This article was automatically generated by the NFC Market Live AI analysis system. (Updated: 2026-10-06 21:44 JST)
📄 Primary Source
U.S. Census Bureau
https://www.census.gov/foreign-trade/Press-Release/current_press_release/ft900.pdf
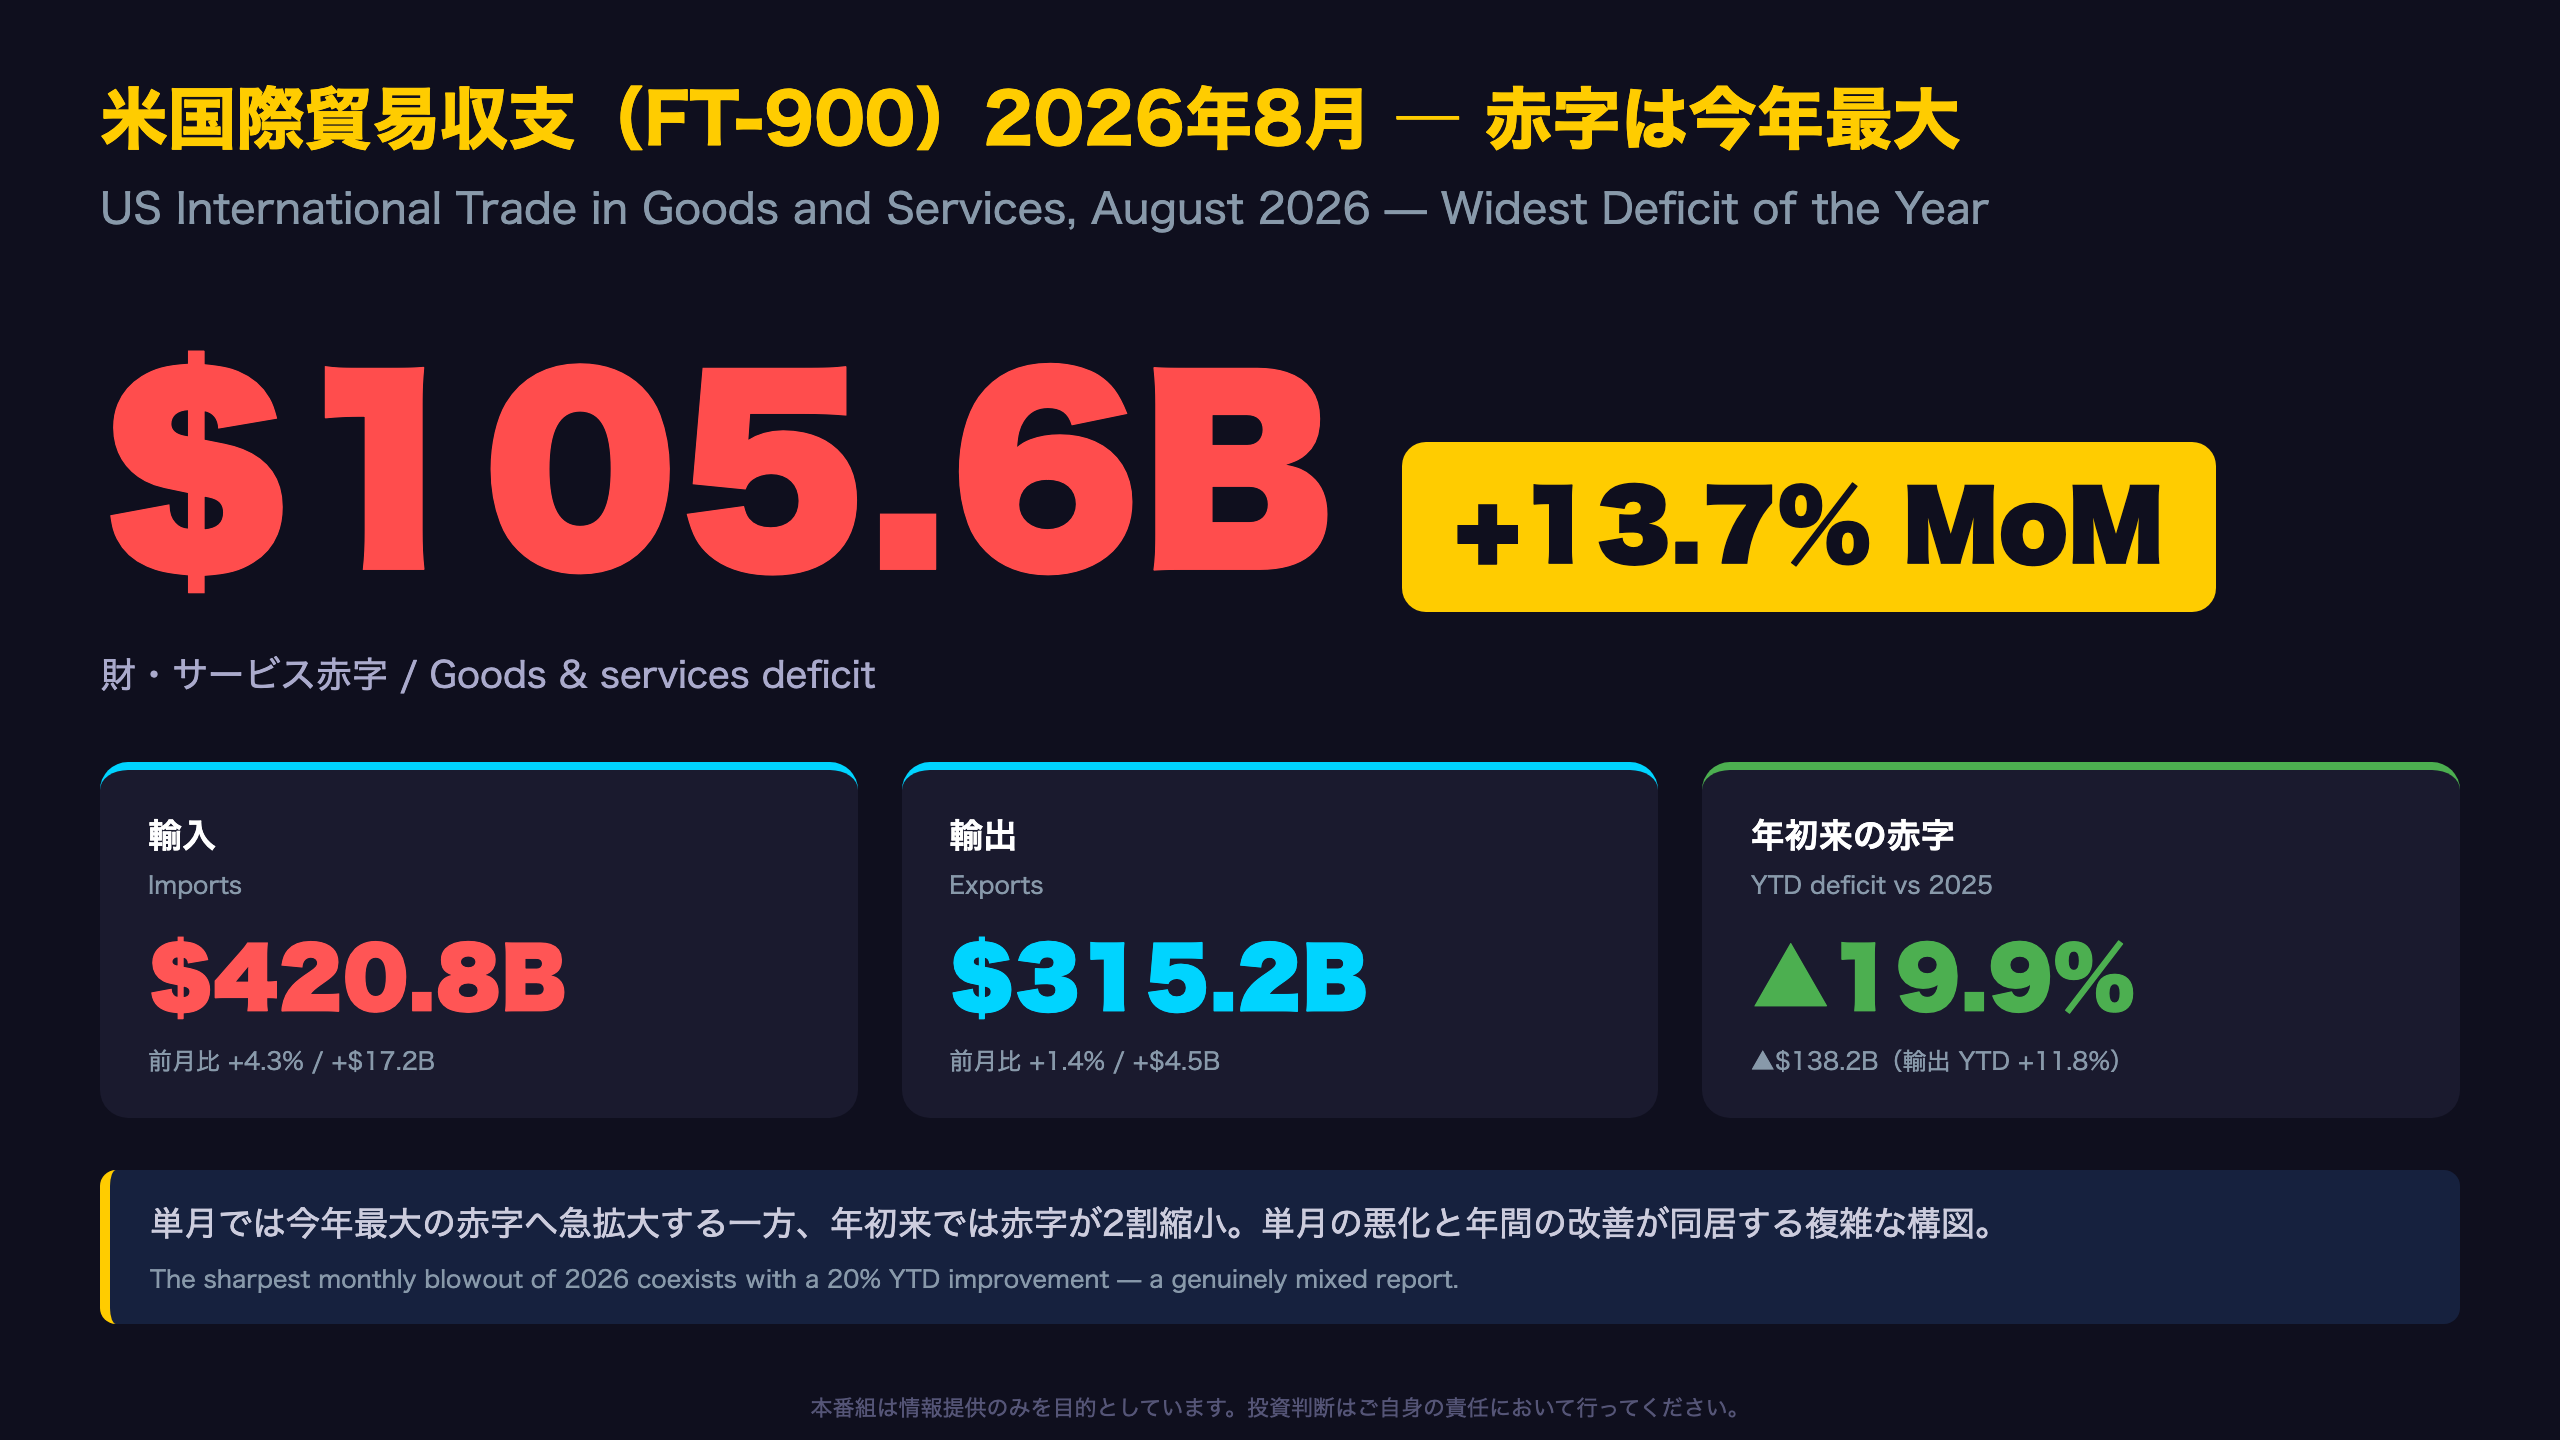
📊 The US goods & services deficit widened 13.7% to $105.6B in August 2026 — the largest monthly gap of the year, per Census Bureau & BEA (FT-900).
📈 Imports surged 4.3% to $420.8B, led by capital goods at a record $146.4B. YTD computer imports nearly doubled vs 2025 and semiconductor imports jumped 84% — the AI datacenter buildout is reshaping US trade.
💡 Exports also rose 1.4% to $315.2B, lifted by gold, crude oil and fuel oil. YTD exports are up 11.8%, and the YTD deficit is down 19.9% from 2025.
⚠️ Country mix shift: deficits with Vietnam ($24.0B) and Taiwan ($18.3B) now exceed China ($16.4B).
📅 Next release: Nov 4, 2026. The wider real goods deficit points to a net-export drag on Q3 GDP.
The Ultimate Summary:貿易赤字、今年最大の1,056億ドルへ
Why the Headline Cuts Both Ways
The FT-900 is the definitive monthly US trade report, jointly published by the Census Bureau and the Bureau of Economic Analysis (BEA) — the same data that feeds directly into the net-export component of US GDP. The August release states that \”the goods and services deficit was $105.6 billion in August, up $12.7 billion from $92.8 billion in July, revised.\”
The monthly path matters
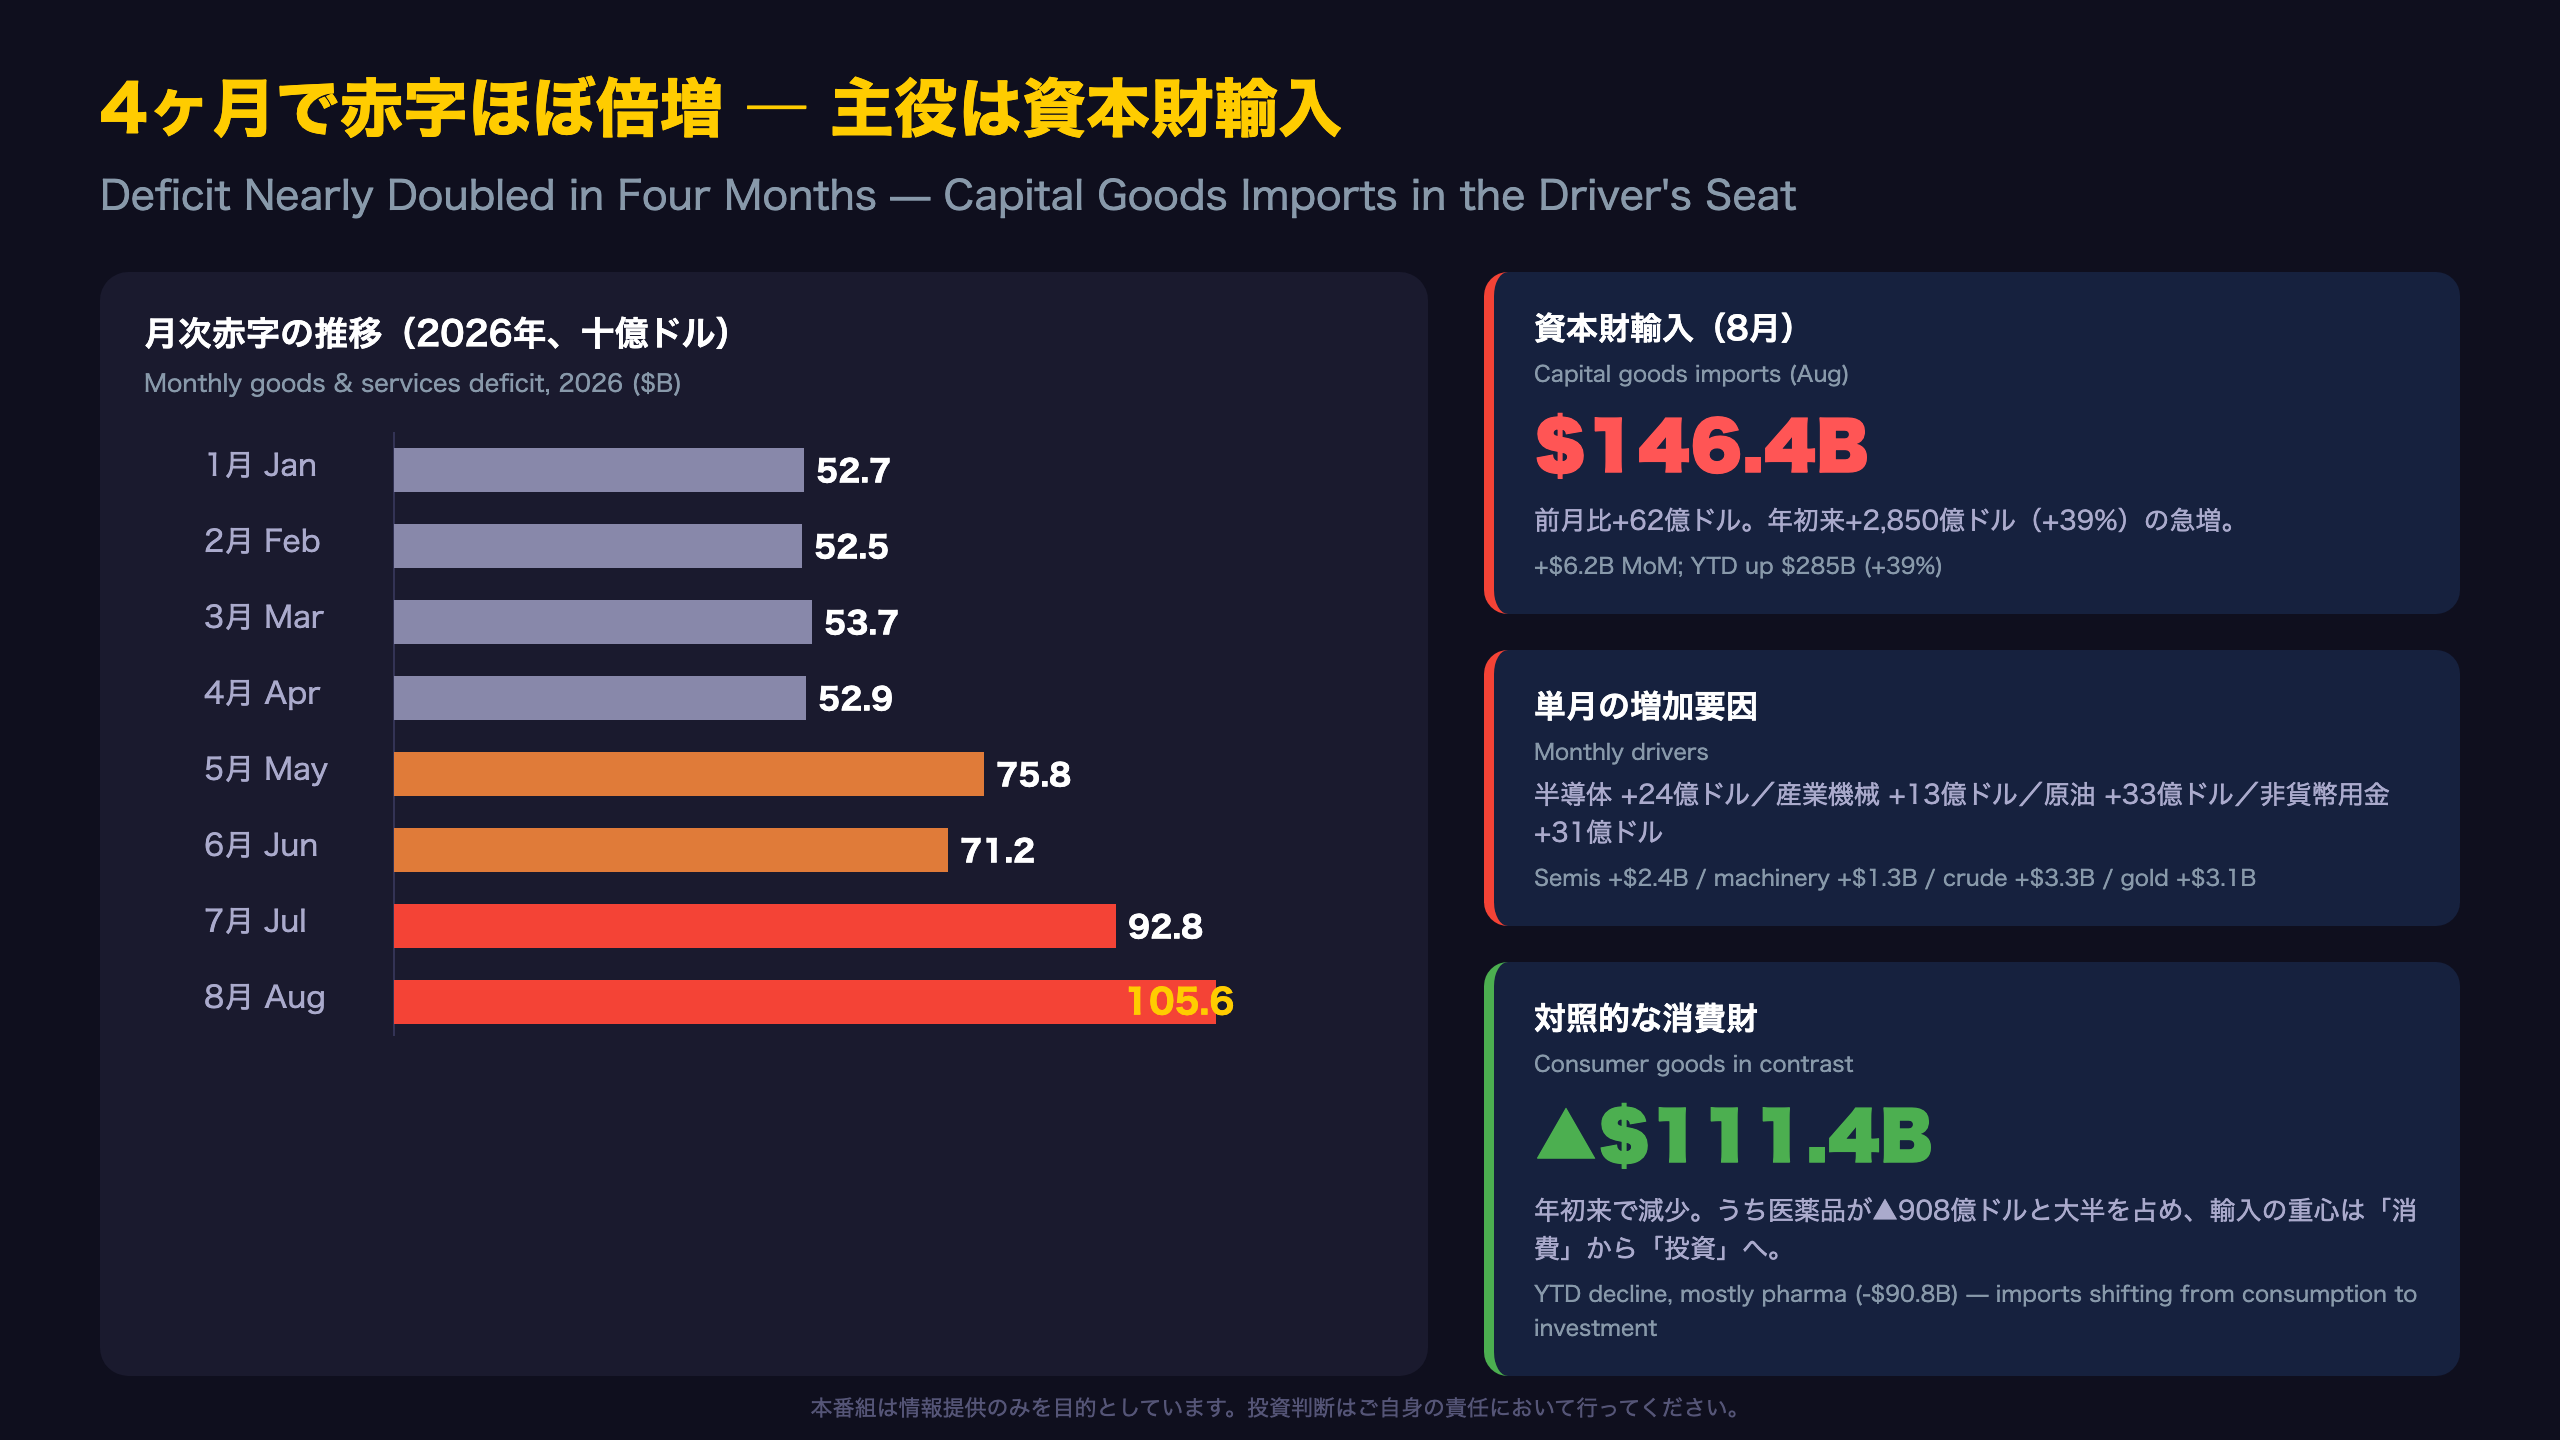
From January through April 2026, the monthly deficit was remarkably stable at $52–54 billion. It then nearly doubled over four months: $75.8B in May, $92.8B in July (revised), and $105.6B in August. Yet the year-to-date deficit of $557 billion is 19.9% smaller than the same period of 2025 — largely because early 2025 was distorted by historic tariff front-running (January 2025 alone saw a $124.7B deficit).
A revision worth noting
July goods imports were revised up by $4.4 billion, meaning import momentum entering August was stronger than first reported.
For international investors, the key context: unlike Japan’s trade statistics, the US report is dominated by the goods deficit ($136.6B in August), partially offset by a persistent services surplus ($31.0B). The month-on-month blowout and the year-on-year improvement are both true — the composition, explored in the following sections, determines which one matters for markets.
Deep Dive①:4ヶ月で赤字ほぼ倍増 ― 主役は資本財輸入
The Quality of the Deficit: Investment, Not Consumption
The FT-900 breaks imports down by \”end-use\” category — a classification unique to US trade statistics that reveals what the imports are actually for. The 2026 picture is stark.
End-use imports, year to date vs 2025
- Capital goods: $1,016.4B, up $285.0B (+39%) — the only major category growing
- Consumer goods: $451.4B, down $111.4B
- Automotive: $276.6B, down $12.8B
- Foods & beverages: $140.7B, down $7.7B
In GDP accounting terms, this matters enormously. A deficit driven by consumer goods subtracts from GDP with little offset. A deficit driven by capital goods is partially offset by higher business fixed investment — the US is effectively importing future productive capacity, much of it for AI datacenters.
The pharma distortion
Of the $111B decline in consumer goods imports, pharmaceutical preparations alone account for $90.8B (YTD imports fell from $205.9B to $115.1B). This is the unwind of massive tariff front-running in early 2025, not a collapse in US consumer demand — cell phone imports, for instance, are essentially flat year over year.
For comparison, no other G7 economy is seeing anything like this capex-driven import surge; it is the trade-statistics mirror of the US AI investment cycle that has dominated equity markets.
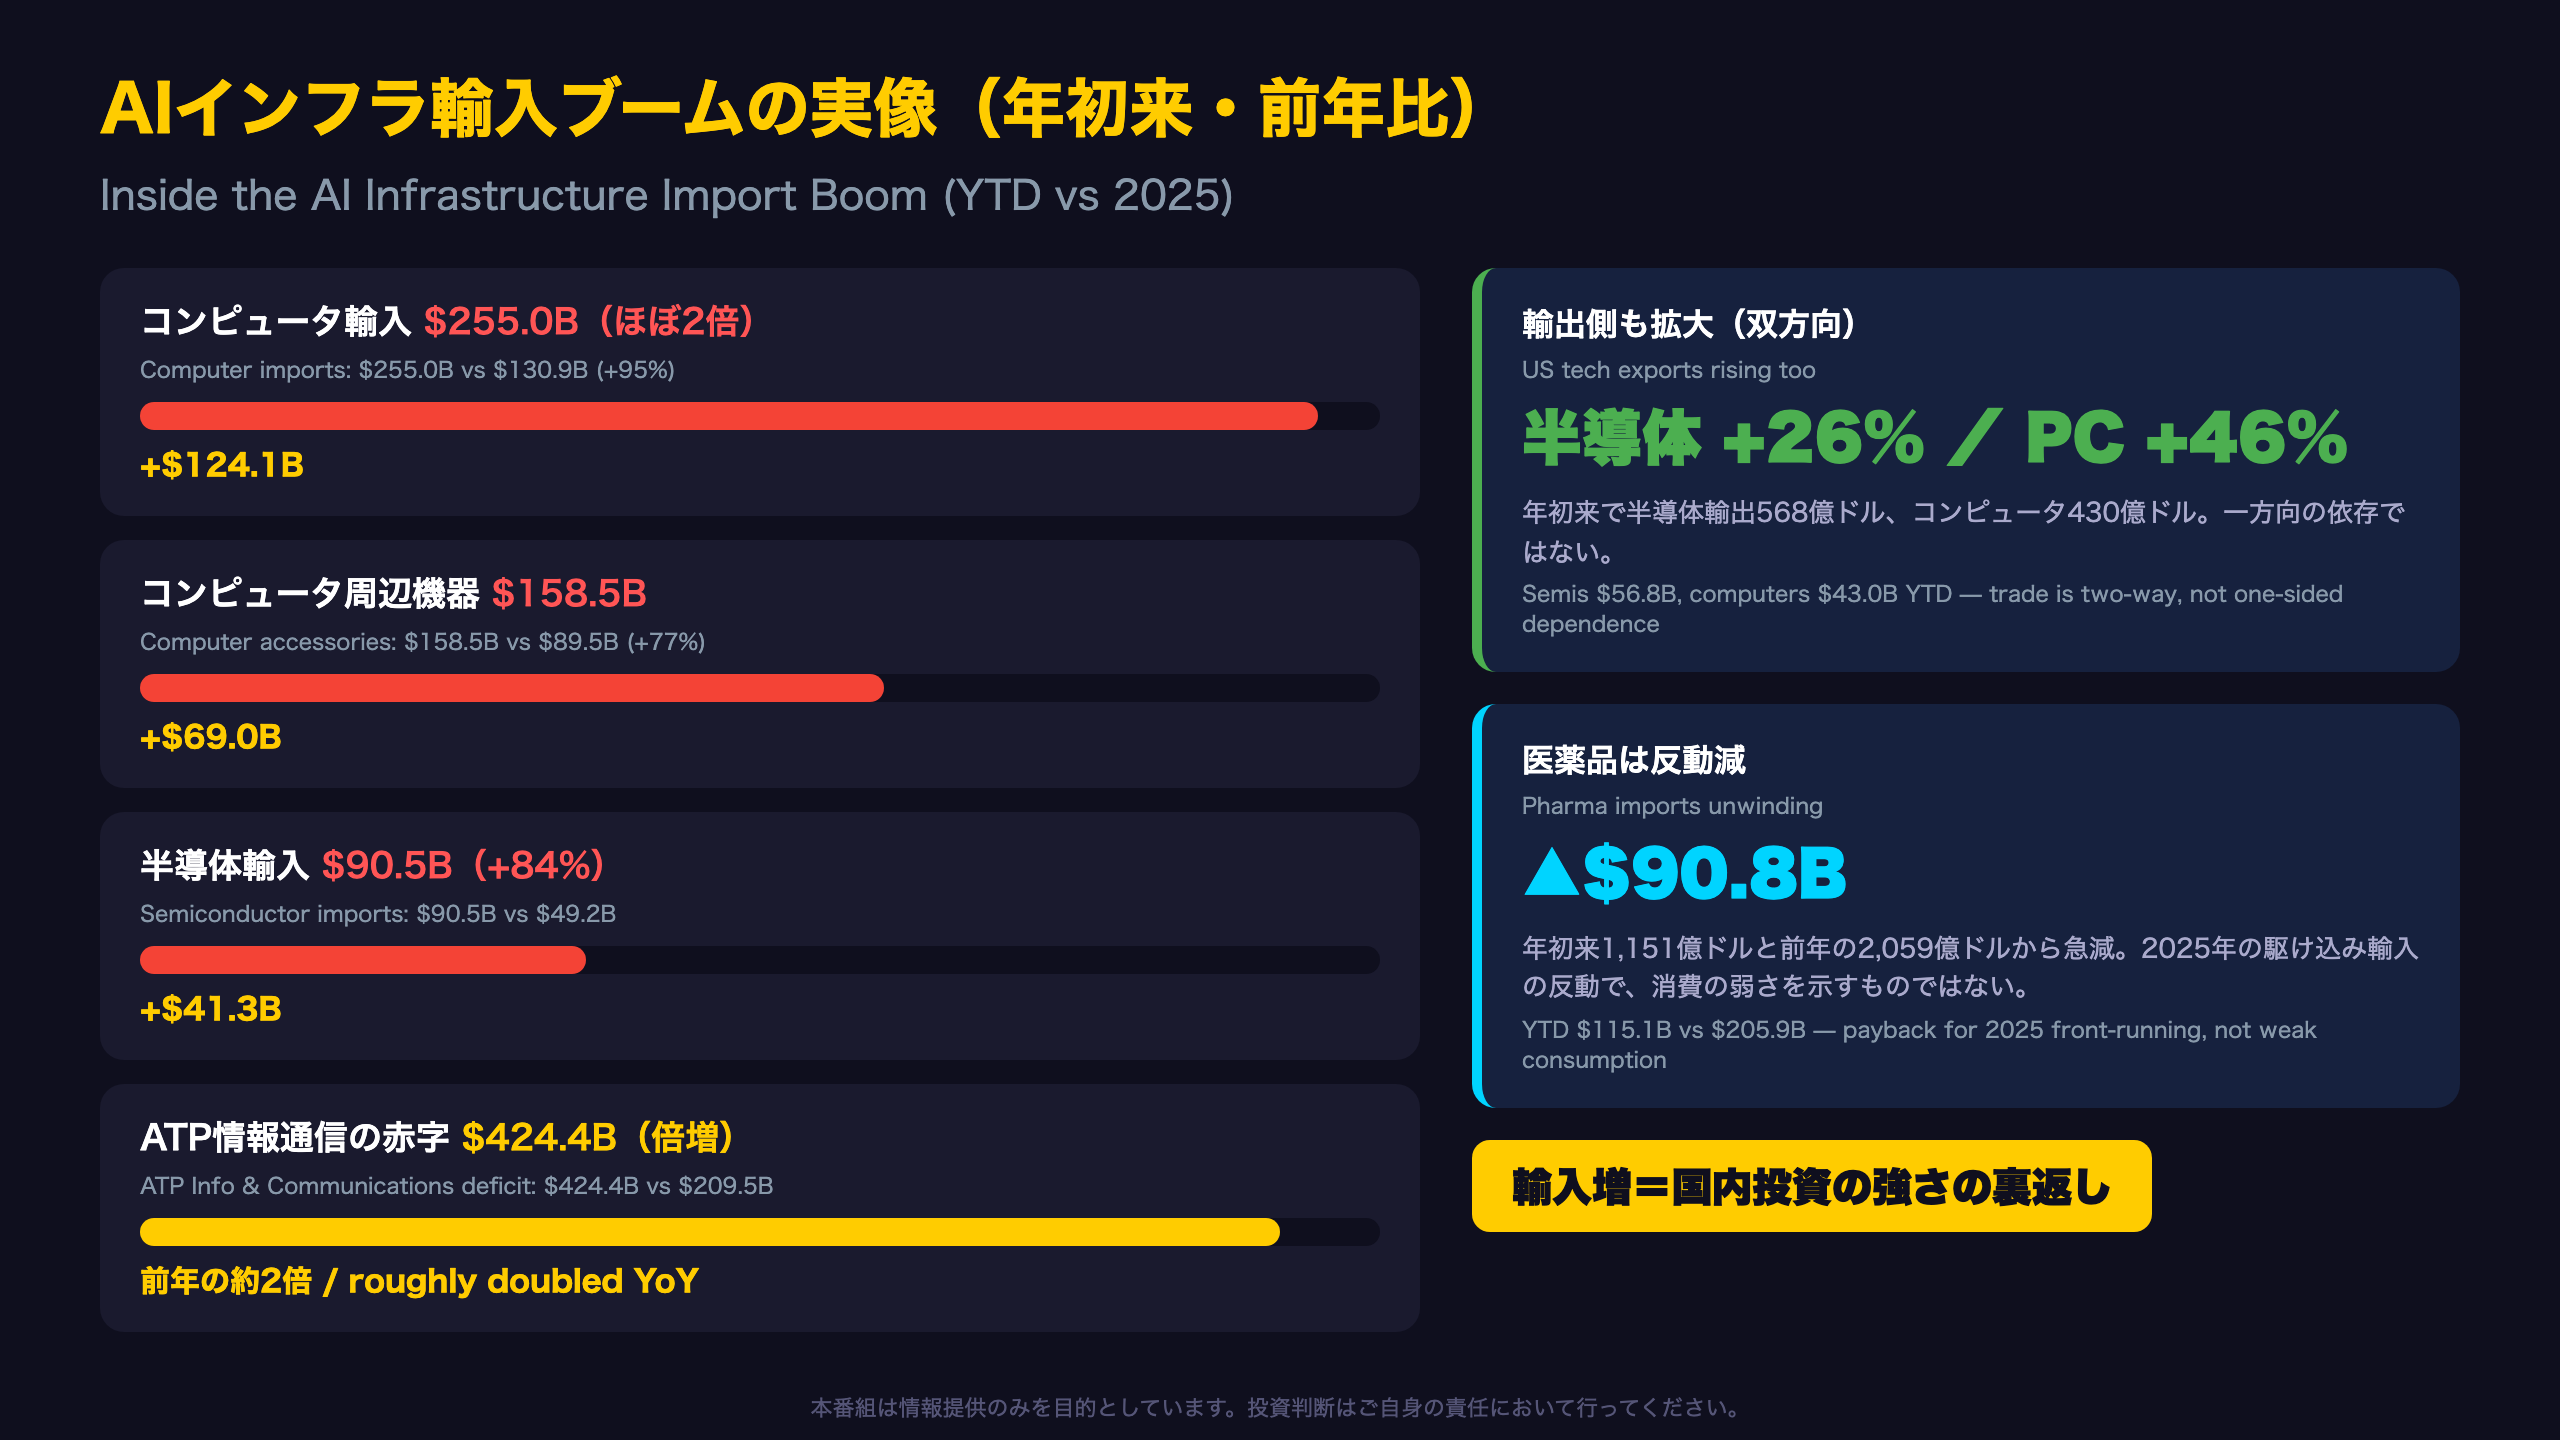
Deep Dive②:AIインフラ輸入ブームの実像
What the Advanced Technology Products Data Reveals
A unique feature of the FT-900 is its Advanced Technology Products (ATP) tabulation — roughly 500 product codes identified as leading-edge technology, tracked separately from standard commodity classifications. In 2026 this dataset has become the clearest statistical window into the AI buildout.
The ICT deficit doubled
The ATP deficit reached $392.2B year to date, up from $259.1B in 2025. Within that, the Information & Communications category deficit exploded from $209.5B to $424.4B — more than doubling in one year. Meanwhile the biotechnology deficit collapsed from $76.0B to just $10.1B, confirming that 2025’s import distortion (pharma front-running) has been replaced by 2026’s AI hardware wave.
Where the dollars are going
- Computer imports YTD: $255.0B vs $130.9B (+95%)
- Computer accessories: $158.5B vs $89.5B (+77%)
- Semiconductors: $90.5B vs $49.2B (+84%)
- Telecom equipment: $111.6B vs $72.9B (+53%)
For equity investors, this is the macro confirmation of hyperscaler capex guidance: the hardware is physically arriving, at a scale visible in national accounts.
The two-way trade point
US semiconductor exports are up 26% YTD and computer exports up 46%. The US remains a major tech exporter even as it imports AI infrastructure — a more balanced position than the headline deficit suggests.
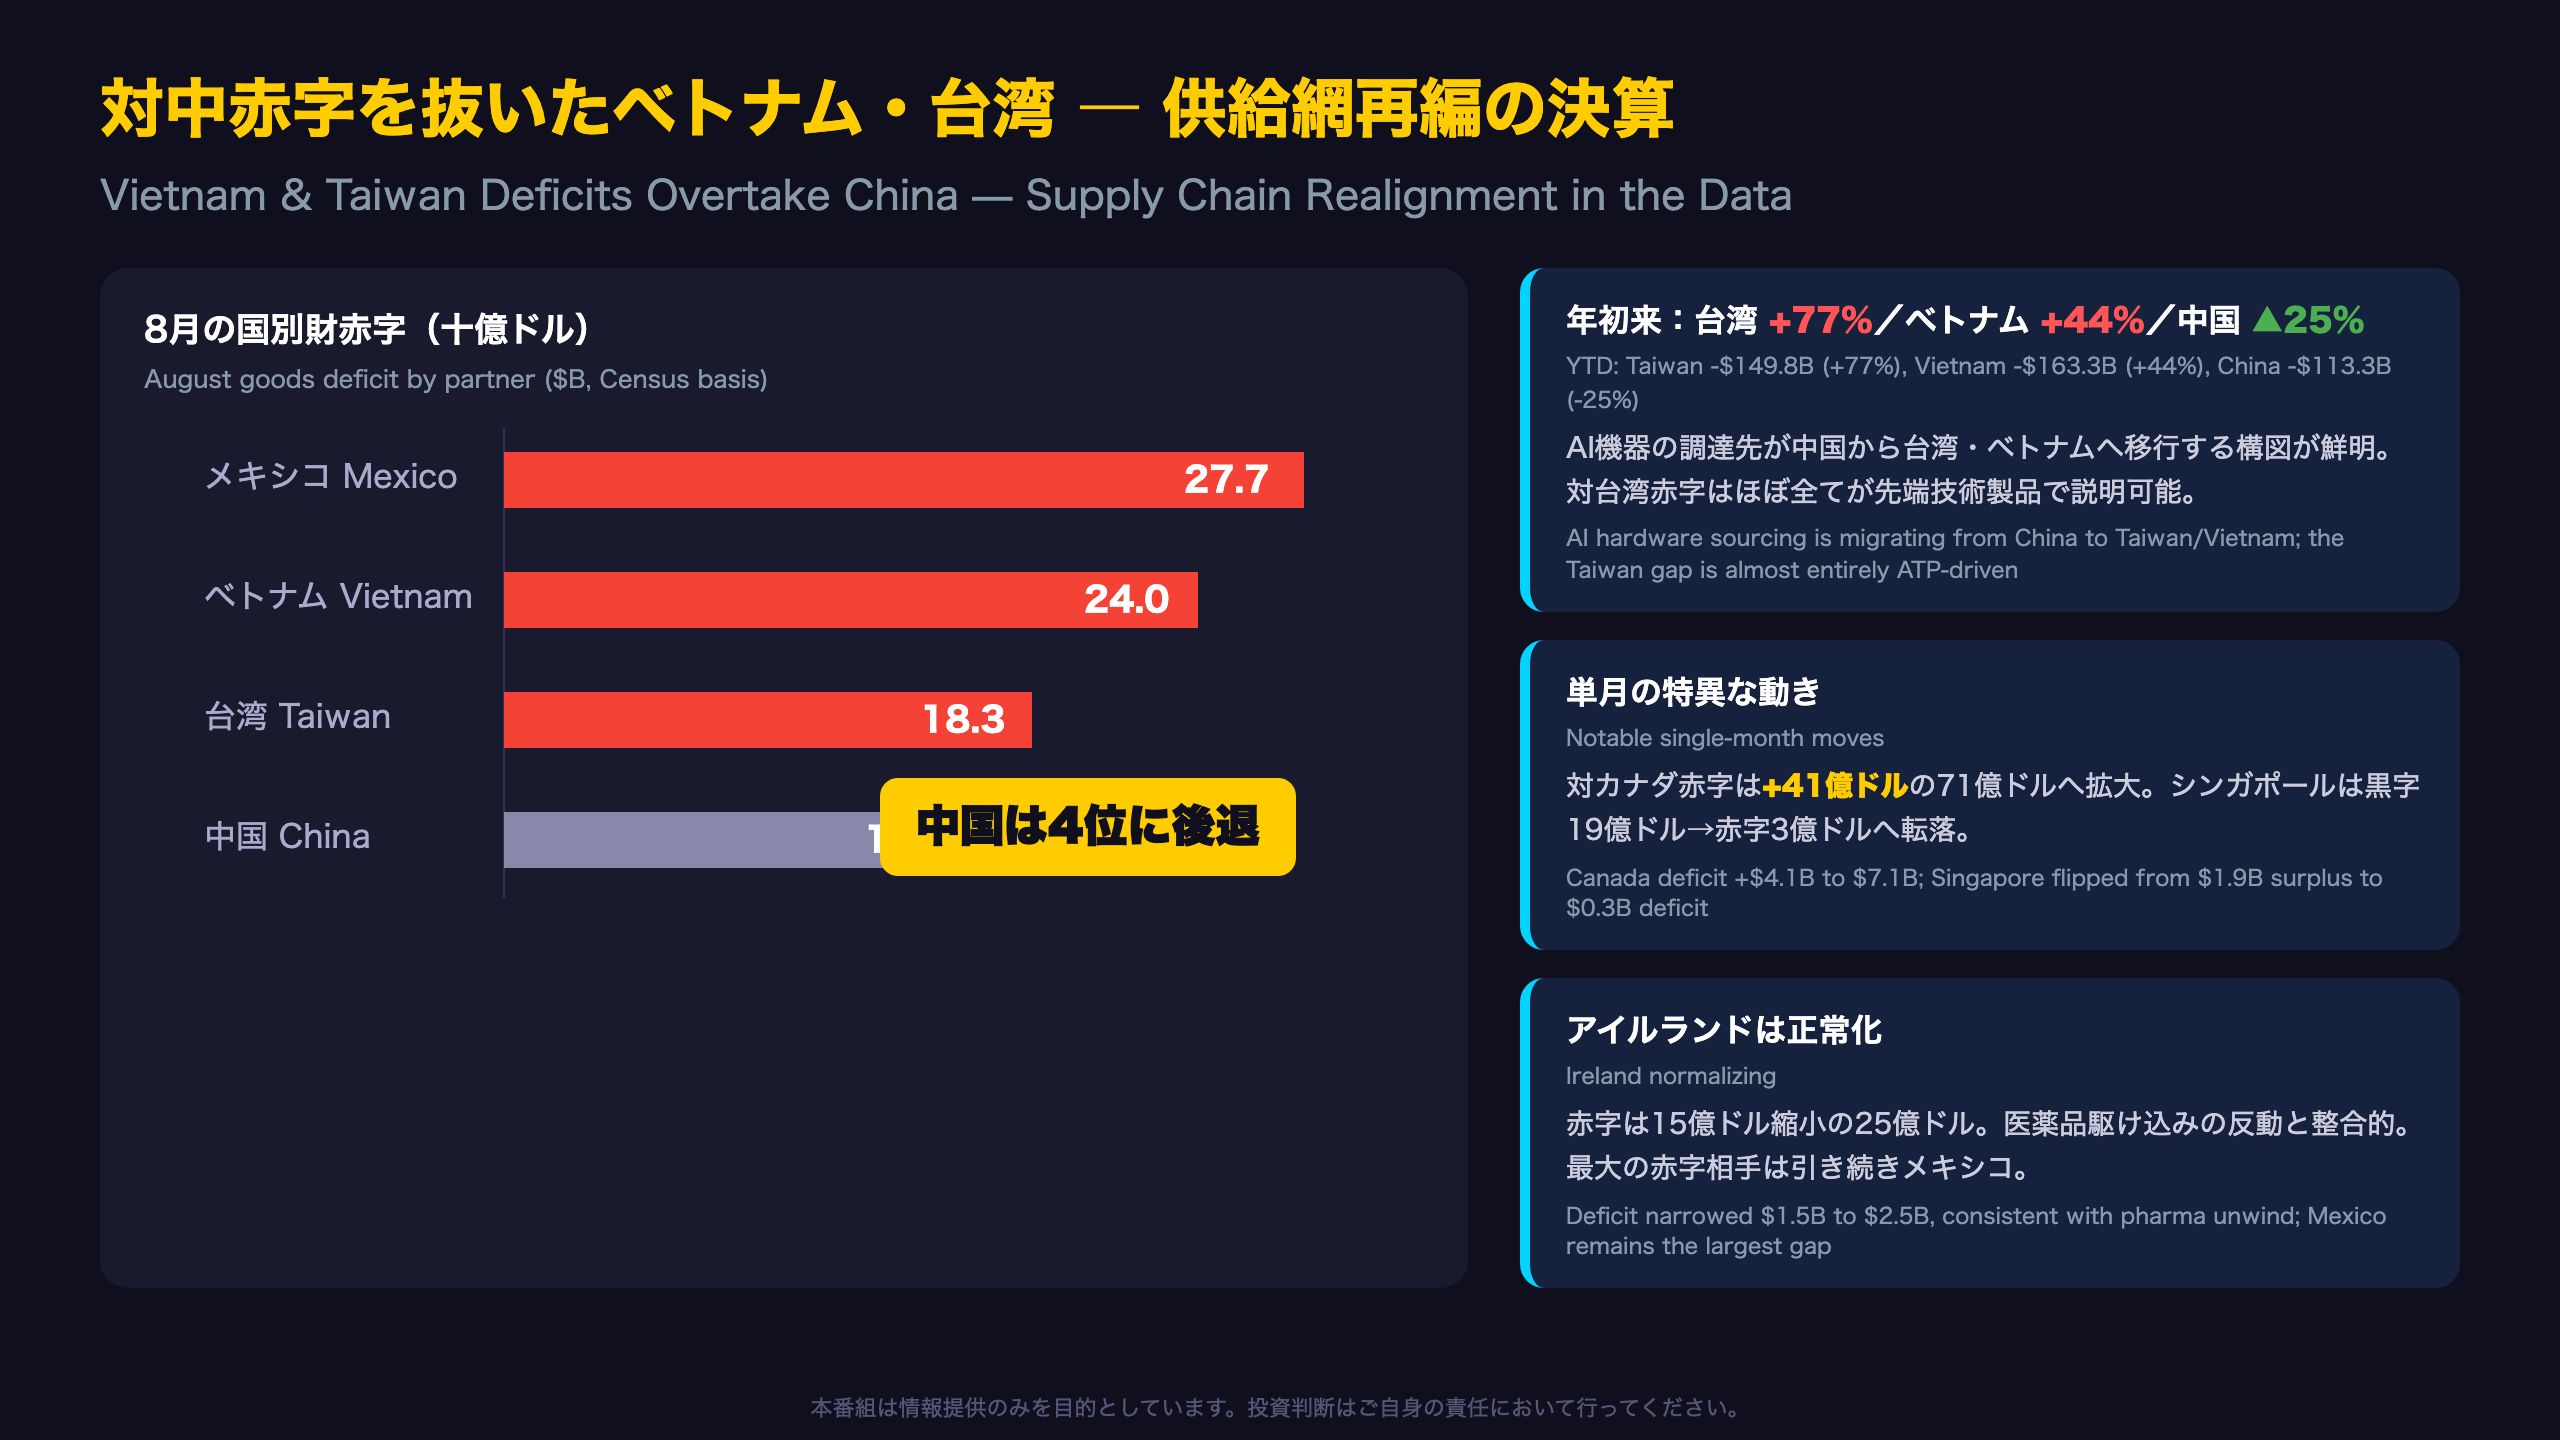
Deep Dive③:対中赤字を抜いたベトナム・台湾 ― 供給網再編の決算
The Month \”De-China-fication\” Became Official
For two decades, the US-China deficit defined American trade politics. In August 2026, China ranked only fourth among deficit partners — behind Mexico ($27.7B), Vietnam ($24.0B) and Taiwan ($18.3B).
The YTD league table (Census basis, seasonally adjusted)
- Vietnam: -$163.3B (vs -$113.5B in 2025, +44%)
- Mexico: -$156.5B (+21%)
- Taiwan: -$149.8B (vs -$84.6B, +77%) — the fastest-growing deficit
- China: -$113.3B (vs -$151.3B, -25%)
The Taiwan surge is almost entirely explained by advanced technology products: the ATP-only deficit with Taiwan hit $140.2B YTD versus $74.0B a year earlier. In other words, AI servers and chips account for virtually the whole bilateral gap — a concentration risk worth noting for anyone tracking Taiwan Strait geopolitics.
Other notable moves in August
- Canada: deficit widened $4.1B to $7.1B as imports rose $4.6B
- Singapore: flipped from a $1.9B surplus in July to a $0.3B deficit
- Ireland: deficit narrowed $1.5B to $2.5B, consistent with the pharma normalization (Ireland was an $87.9B YTD deficit in 2025, now $24.1B)
One caveat: country-level data cannot distinguish genuine production shifts from transshipment of Chinese-origin goods through third countries — a limitation the Census Bureau itself acknowledges in its methodology notes.
Deep Dive④:輸出の強さとGDPへの含意
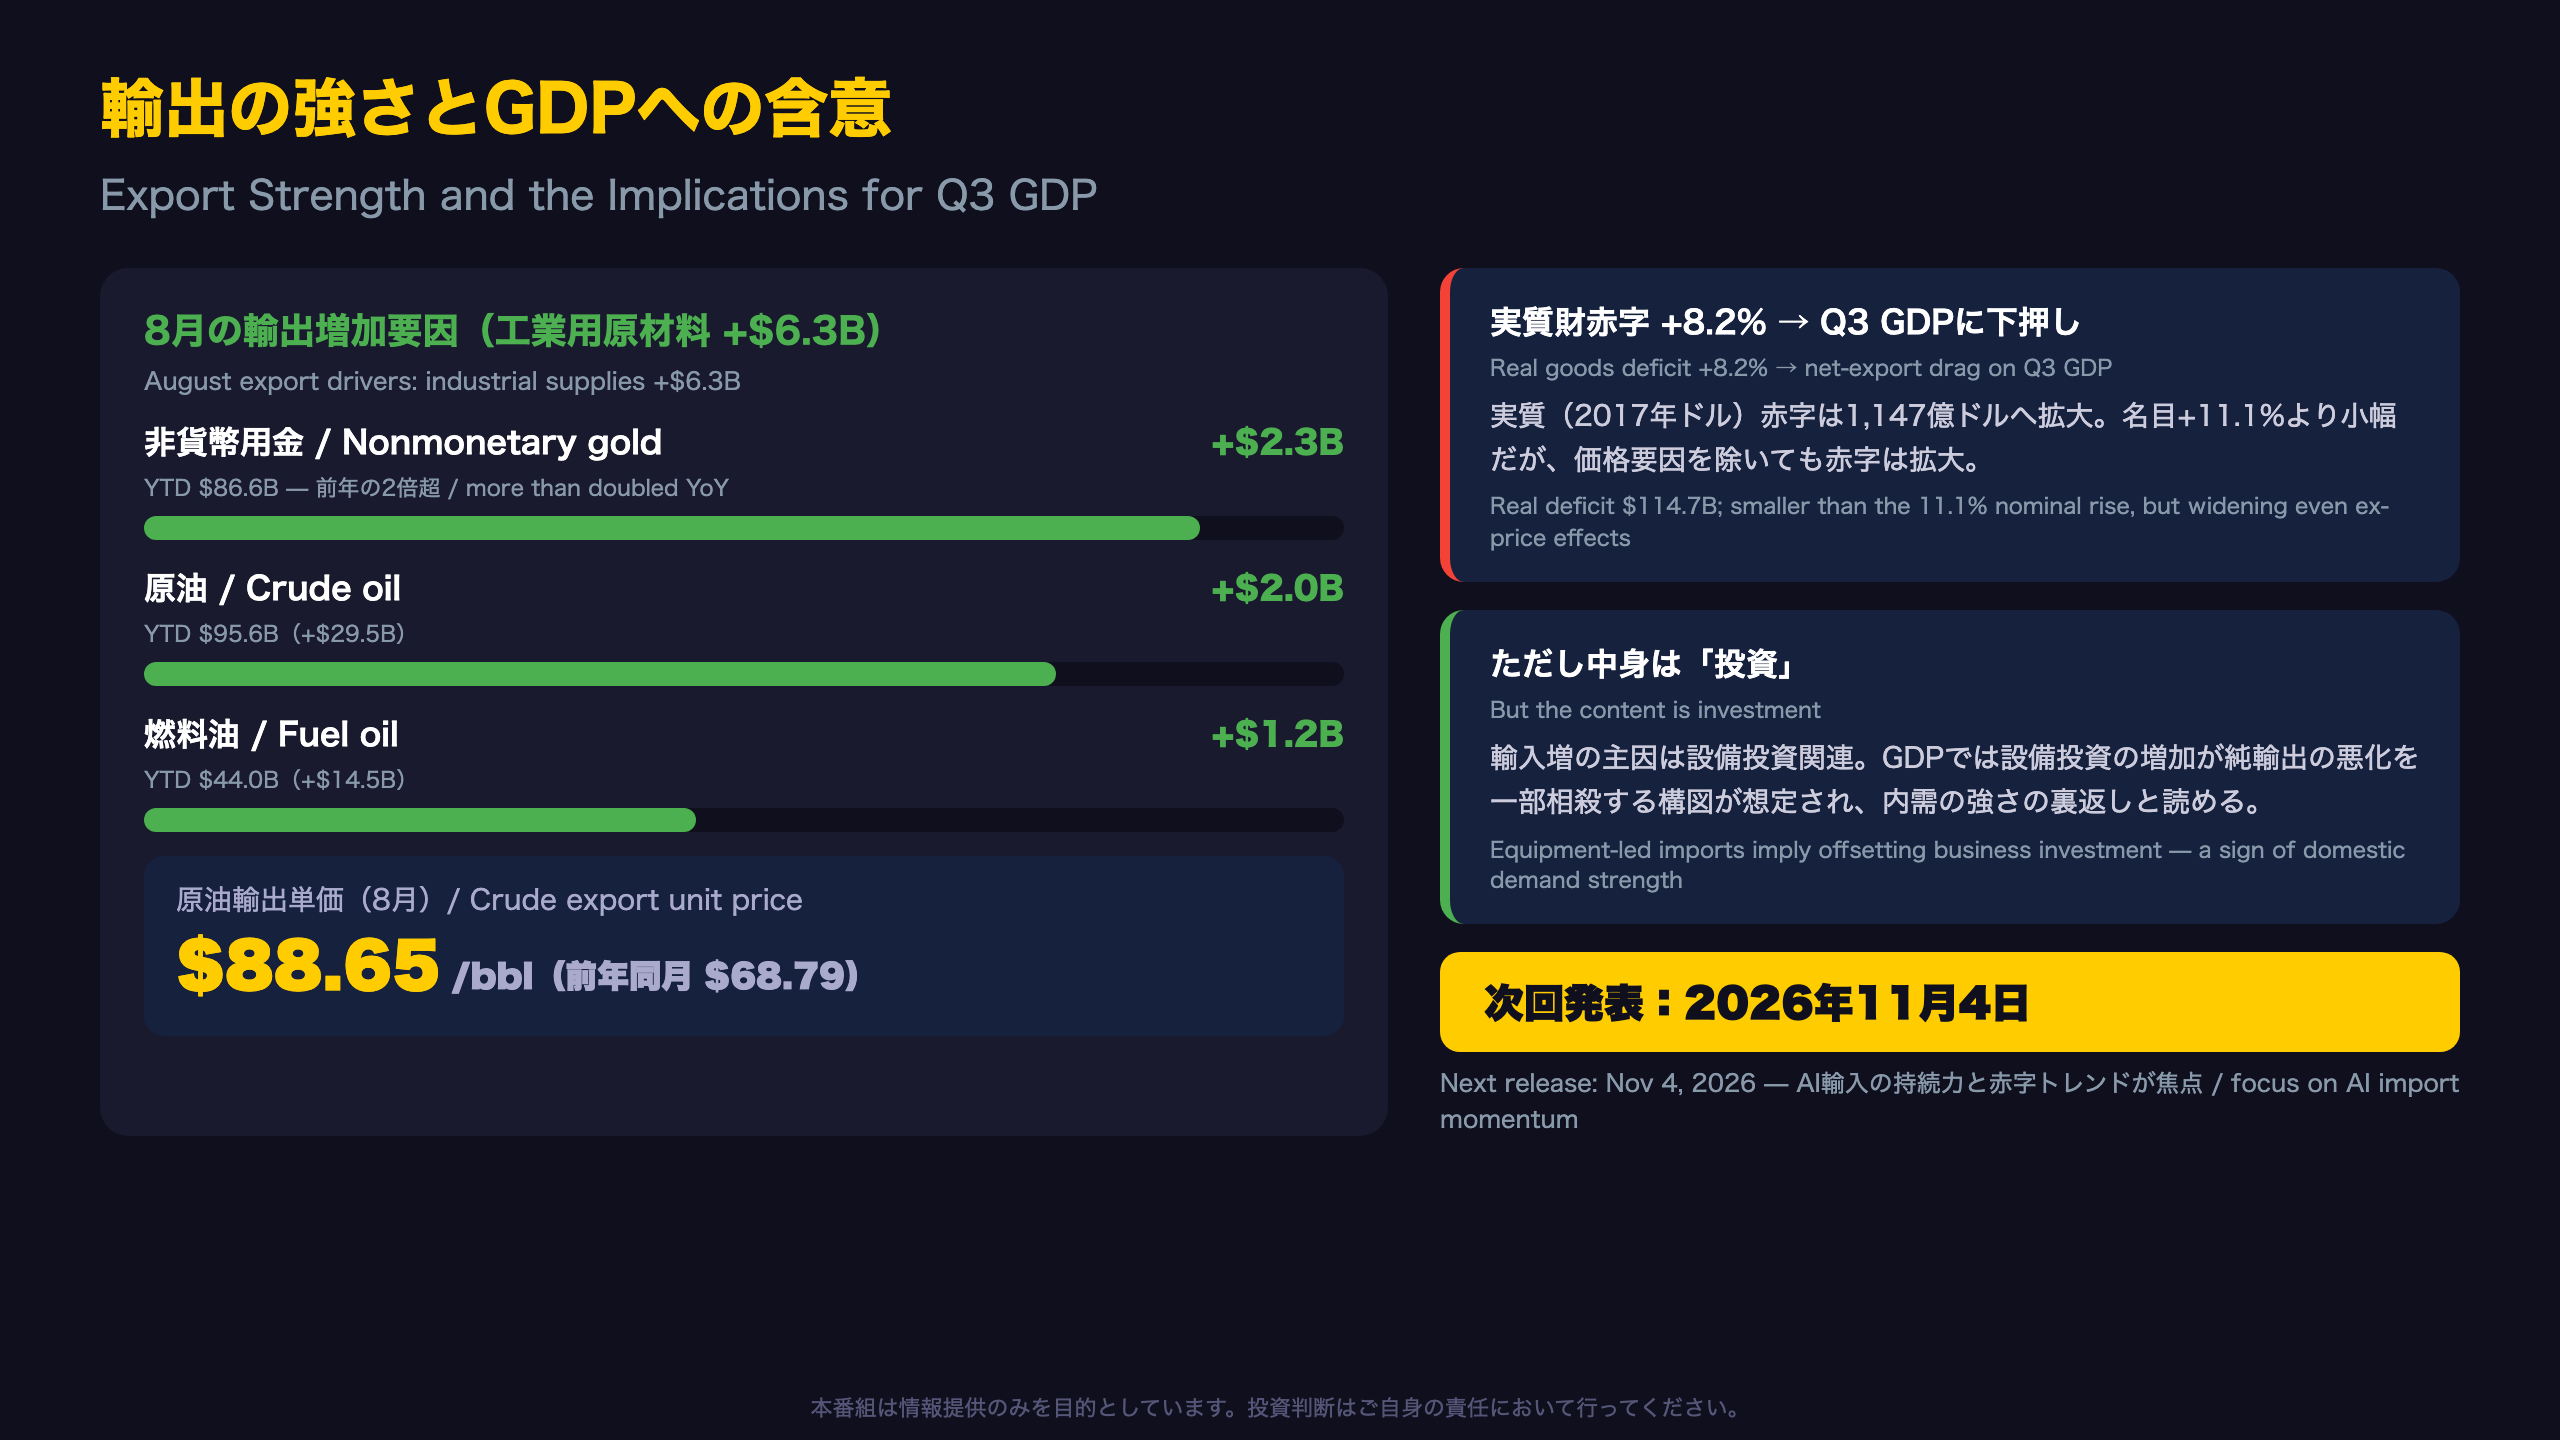
The Export Engine: Energy and Gold
Lost beneath the deficit headlines is a historic US export expansion. YTD goods exports (Census basis) reached $1,649.4B, up $214.5B from 2025. Two pillars stand out.
What is driving exports
- Nonmonetary gold: $86.6B YTD vs $40.1B — more than doubling, reflecting elevated gold prices and shifting international bullion flows
- Crude oil: $95.6B (+$29.5B). The export unit price averaged $88.65/bbl in August vs $68.79 a year earlier, after spiking above $100 in April–May 2026
- Fuel oil $44.0B (+$14.5B) and natural gas $43.0B (+$7.8B)
- Capital goods exports: $538.8B (+$65.6B), led by aircraft engines, semiconductors and computers
The US now functions as a major energy and gold exporter — a structural difference from deficit economies like the UK, and a partial natural hedge against commodity-driven import costs.
GDP arithmetic
The report notes the real (2017-dollar) goods deficit widened 8.2% to $114.7B, versus an 11.1% nominal increase. Even stripping out prices, the gap is growing — pointing to a net-export drag on Q3 GDP. The crucial offset: because the import surge is equipment-led, much of it should reappear as business fixed investment within the same GDP report, muting the hit to headline growth.
What to watch next
The September FT-900 lands November 4, 2026. Key questions: does capital goods import momentum persist, does the Taiwan/Vietnam deficit keep compounding, and can gold and crude sustain the export side? The 3-month average deficit has already risen $9.9B to $89.9B — the widening trend is becoming entrenched.
Disclaimer: This article is for informational purposes only. All investment decisions are made solely at your own risk.







