📺 Watch the Full Video Analysis
This article was automatically generated by the NFC Market Live AI analysis system. (Updated: 2026-10-03 07:10 JST)
📄 Primary Source
米国労働省(DOL)— 新規失業保険申請件数
https://www.dol.gov/newsroom/releases/eta/eta20261001
米国エネルギー情報局(EIA)— 週間石油状況レポート
https://www.eia.gov/petroleum/supply/weekly/pdf/highlights.pdf
連邦準備制度理事会(FRB)— H.4.1 バランスシート
https://www.federalreserve.gov/releases/h41/current/h41.htm
📊 A full breakdown of this week’s three key US macro releases.
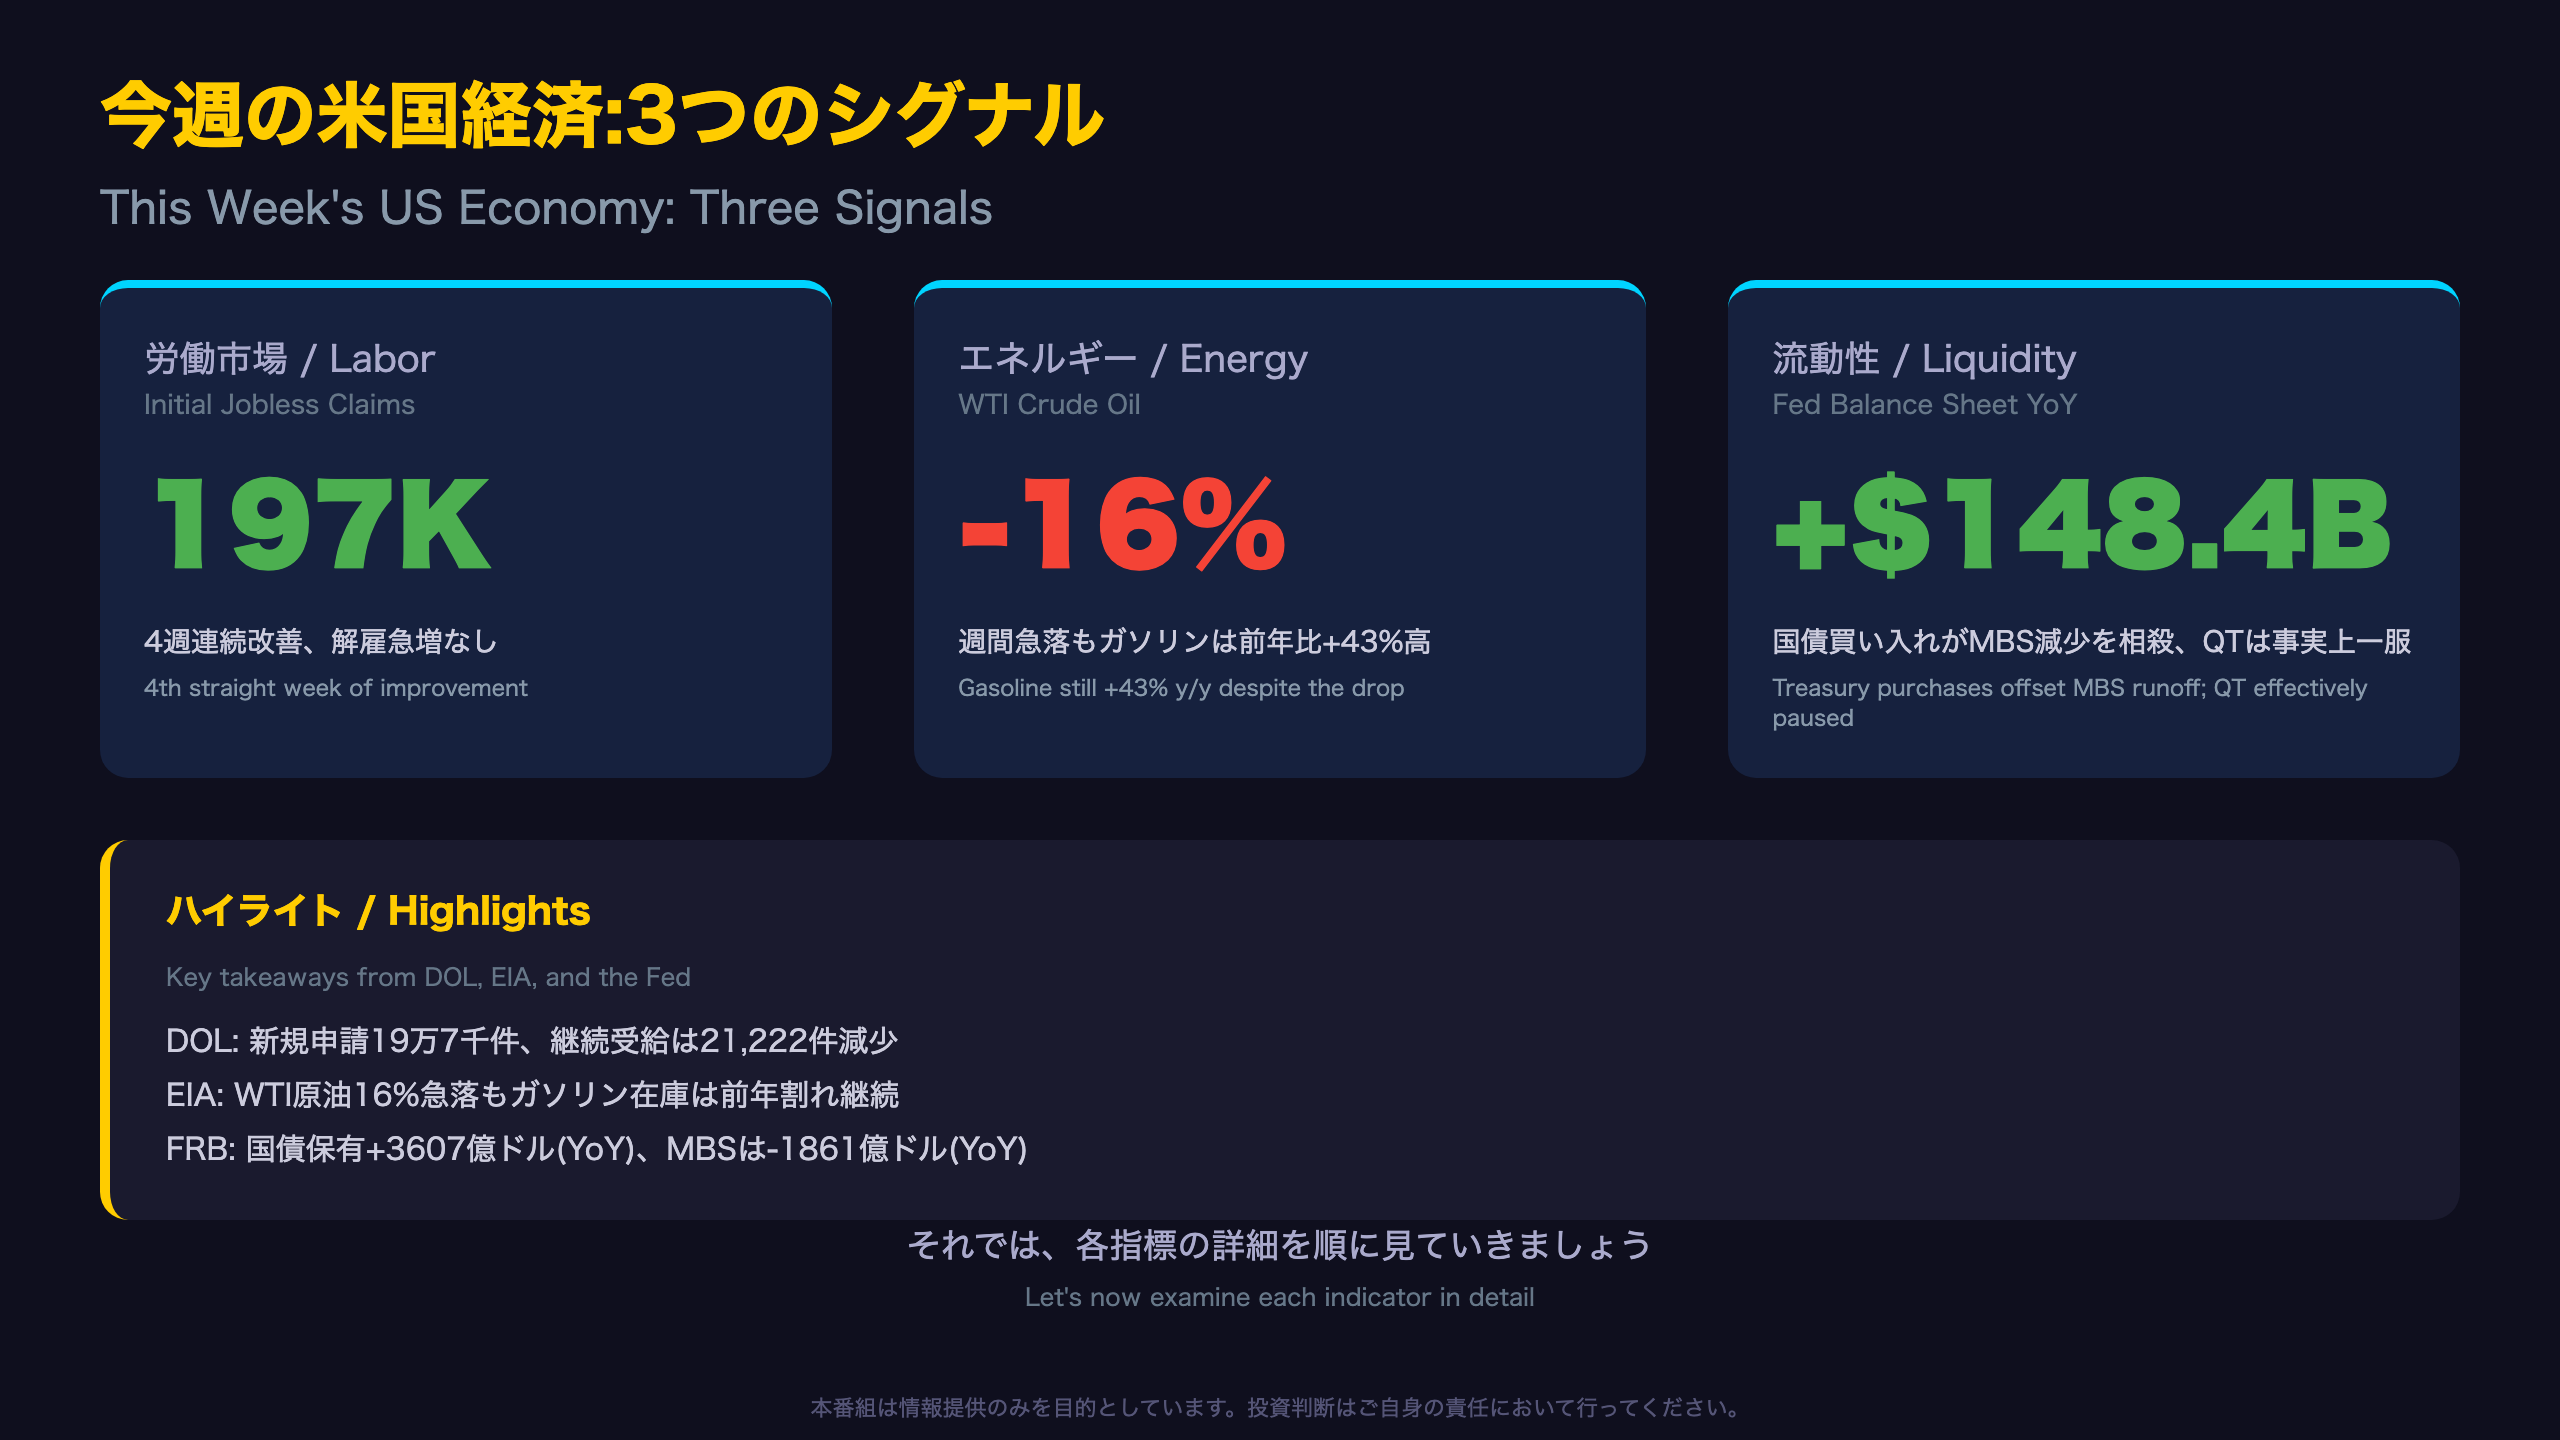
Initial jobless claims improved to 197,000, with no sign of accelerating layoffs.
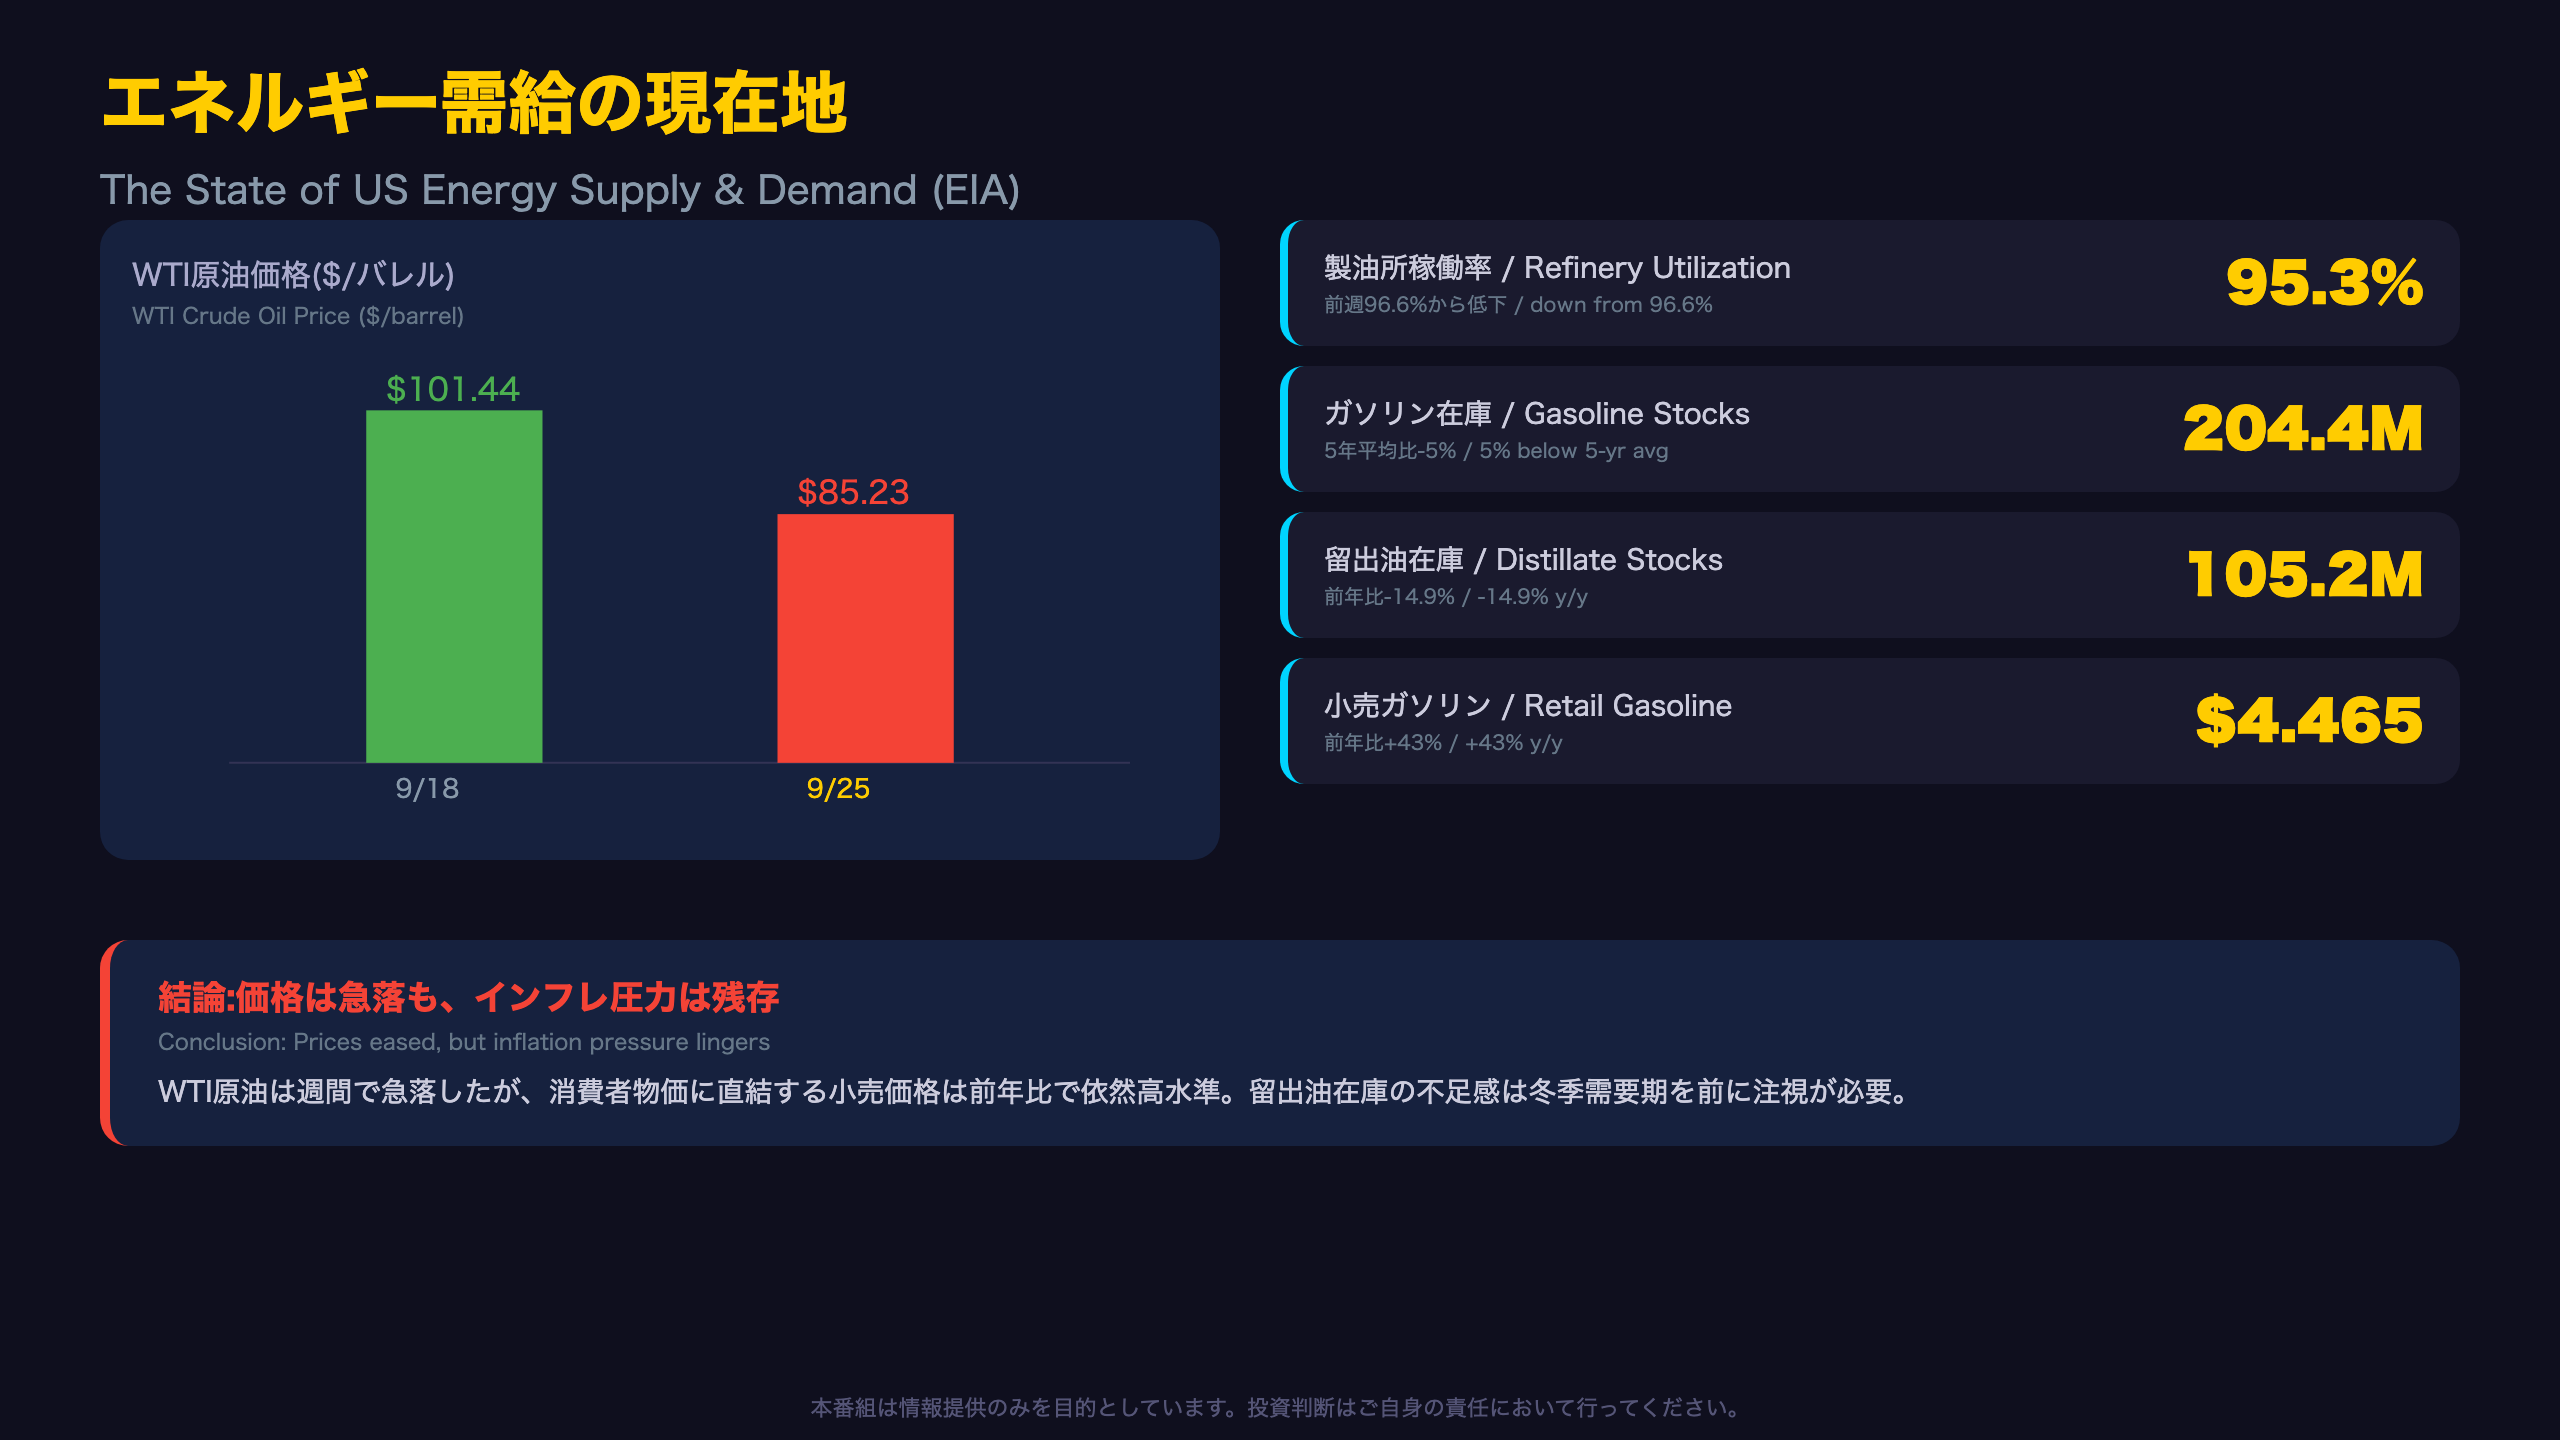
📉 Meanwhile, WTI crude plunged roughly 16% in a week. Yet retail gasoline remains 43% higher y/y, keeping energy-driven inflation risk alive.
💰 The Fed’s balance sheet grew $148.4B y/y, as Treasury purchases effectively paused QT even as MBS runoff continues.
⚠️ Labor, energy, and liquidity: three signals point to a ‘stable but watchful’ US economy. We break down the data professionally.
今週のアルティメット・サマリー
A Quant Lens on This Week’s “Stability”
Beyond the headline releases, our in-house weekly Hidden Markov Model (HMM) regime classifier has kept the US economy in the same “R0” regime for five consecutive weeks, each time with 100% probability. The centroid distance, a measure of how far current data sits from the regime’s typical pattern, has held in a tight 1.82-1.87 range, suggesting no structural shift is under way.
Context: the quietest layoffs in a year
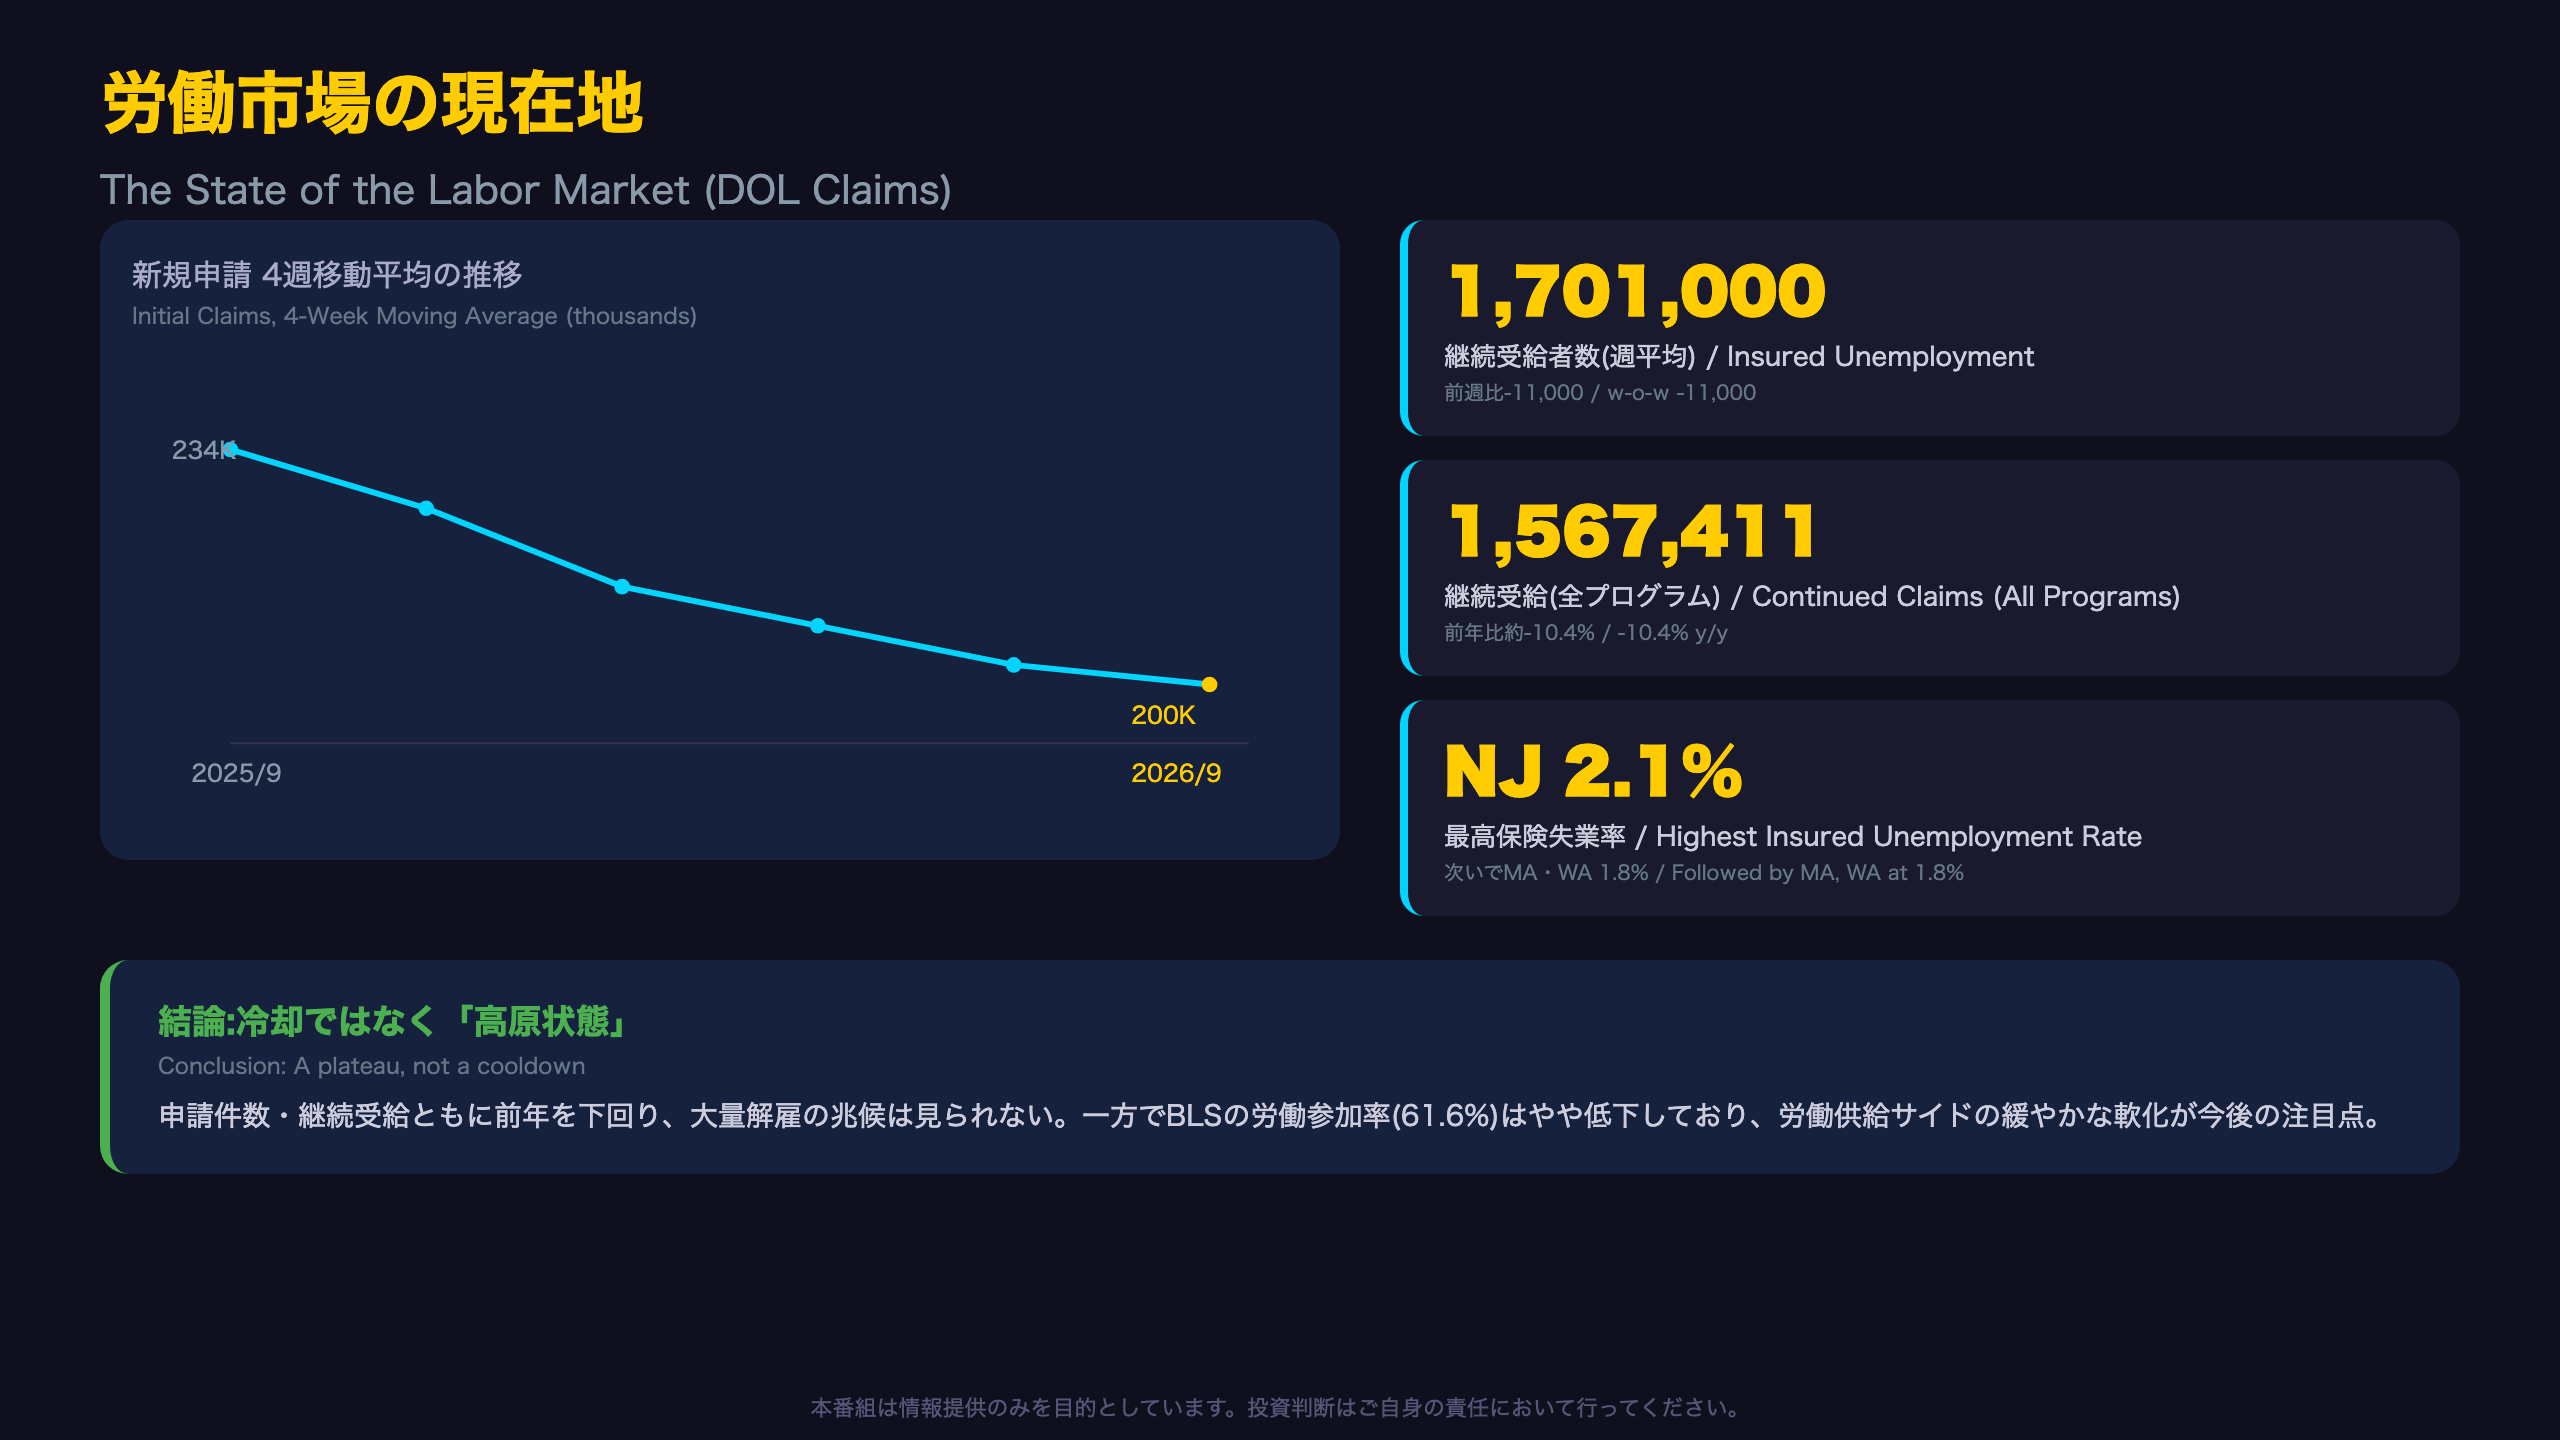
A year ago, seasonally adjusted initial claims were running between 219,000 and 233,000. Since early 2026, that level has steadily compressed toward roughly 200,000. The current four-week average of 200,000 ranks among the lowest readings of the past twelve months, trailing only April 25 (190,000) and July 18 (189,000).
What’s flashing red
Not every sub-indicator agrees. Gasoline CPI is running at +27.4% y/y, wildly above the regime’s typical centroid near -1.5%. Airline fare CPI sits at +23.4% y/y. Meanwhile, labor force participation (61.6%) and the employment-population ratio (59.1%) have both drifted modestly lower, hinting at softening beneath the surface of a seemingly resilient labor market.
For US-focused investors, the read-through is nuanced: rather than a simple “strong jobs, weak everything else” story, this week’s data suggests energy-driven inflation risk is running on a largely separate track from labor market health.
労働市場の現在地
Continued Claims Down ~10% Year-over-Year
Total continued weeks claimed across all programs fell to 1,567,411, down 21,222 from the prior week and roughly 10.4% below the year-ago level of 1,749,873. In other words, the pool of people still drawing unemployment benefits has shrunk meaningfully compared with a year ago.
Context for US readers
The Department of Labor’s weekly claims release (ETA 538/539) is widely followed as a leading indicator because it reflects emerging layoffs in near real-time, unlike the monthly Employment Situation report. A year ago, the four-week average for initial claims hovered near 234,000; it has since eased toward 200,000 through 2026. The actual low for the past year was 189,000 (week of July 18), meaning today’s reading reflects a stable low plateau rather than a fresh record.
State-level dispersion
California (+2,352), Hawaii (+1,524), and New York (+868) posted the largest increases, while Massachusetts (-501) and Kentucky (-326) saw the biggest declines. No state shows signs of a broad-based layoff wave.
A note of caution
BLS data referenced in our quant model show labor force participation at 61.6%, down modestly from the regime average of 62.3%. This divergence between low claims and softer participation is worth monitoring, though a single data point should not be read as a structural trend.
エネルギー需給の現在地
Seasonal Context: Maintenance Season Meets a Tightening Cushion
A dip in refinery utilization to 95.3% is broadly consistent with the autumn maintenance season that follows the summer driving period in the US, so a single week’s decline should not be read as a supply-disruption signal on its own.
Context for international readers
The EIA’s Weekly Petroleum Status Report is the US equivalent of the IEA’s monthly oil market report, but published weekly and closely watched by traders for real-time signals on crude and refined product balances. The original release notes gasoline inventories are “5% below the five-year average” and distillate inventories “13% below the five-year average” (propane/propylene, by contrast, sits 22% above average), a divergence worth tracking heading into the Northern Hemisphere winter heating season.
Direct quote
The report states: “Crude oil imports increased 234,000 b/d to 7.1 million b/d, and the four-week average of 6.7 million barrels per day is 7.5% above the year-ago level,” underscoring a steady rise in import flows.
Bull vs. bear read
Bears could argue the roughly 16% weekly WTI drop signals softening global demand or an easing geopolitical risk premium; however, a single week of price action cannot confirm a trend. Bulls would point to total products supplied running 2.1% above year-ago levels, consistent with resilient underlying US demand.
The next EIA Weekly Petroleum Status Report is due October 7; the pace of distillate drawdowns ahead of winter heating demand will be the key variable to watch.
FRB流動性の現在地
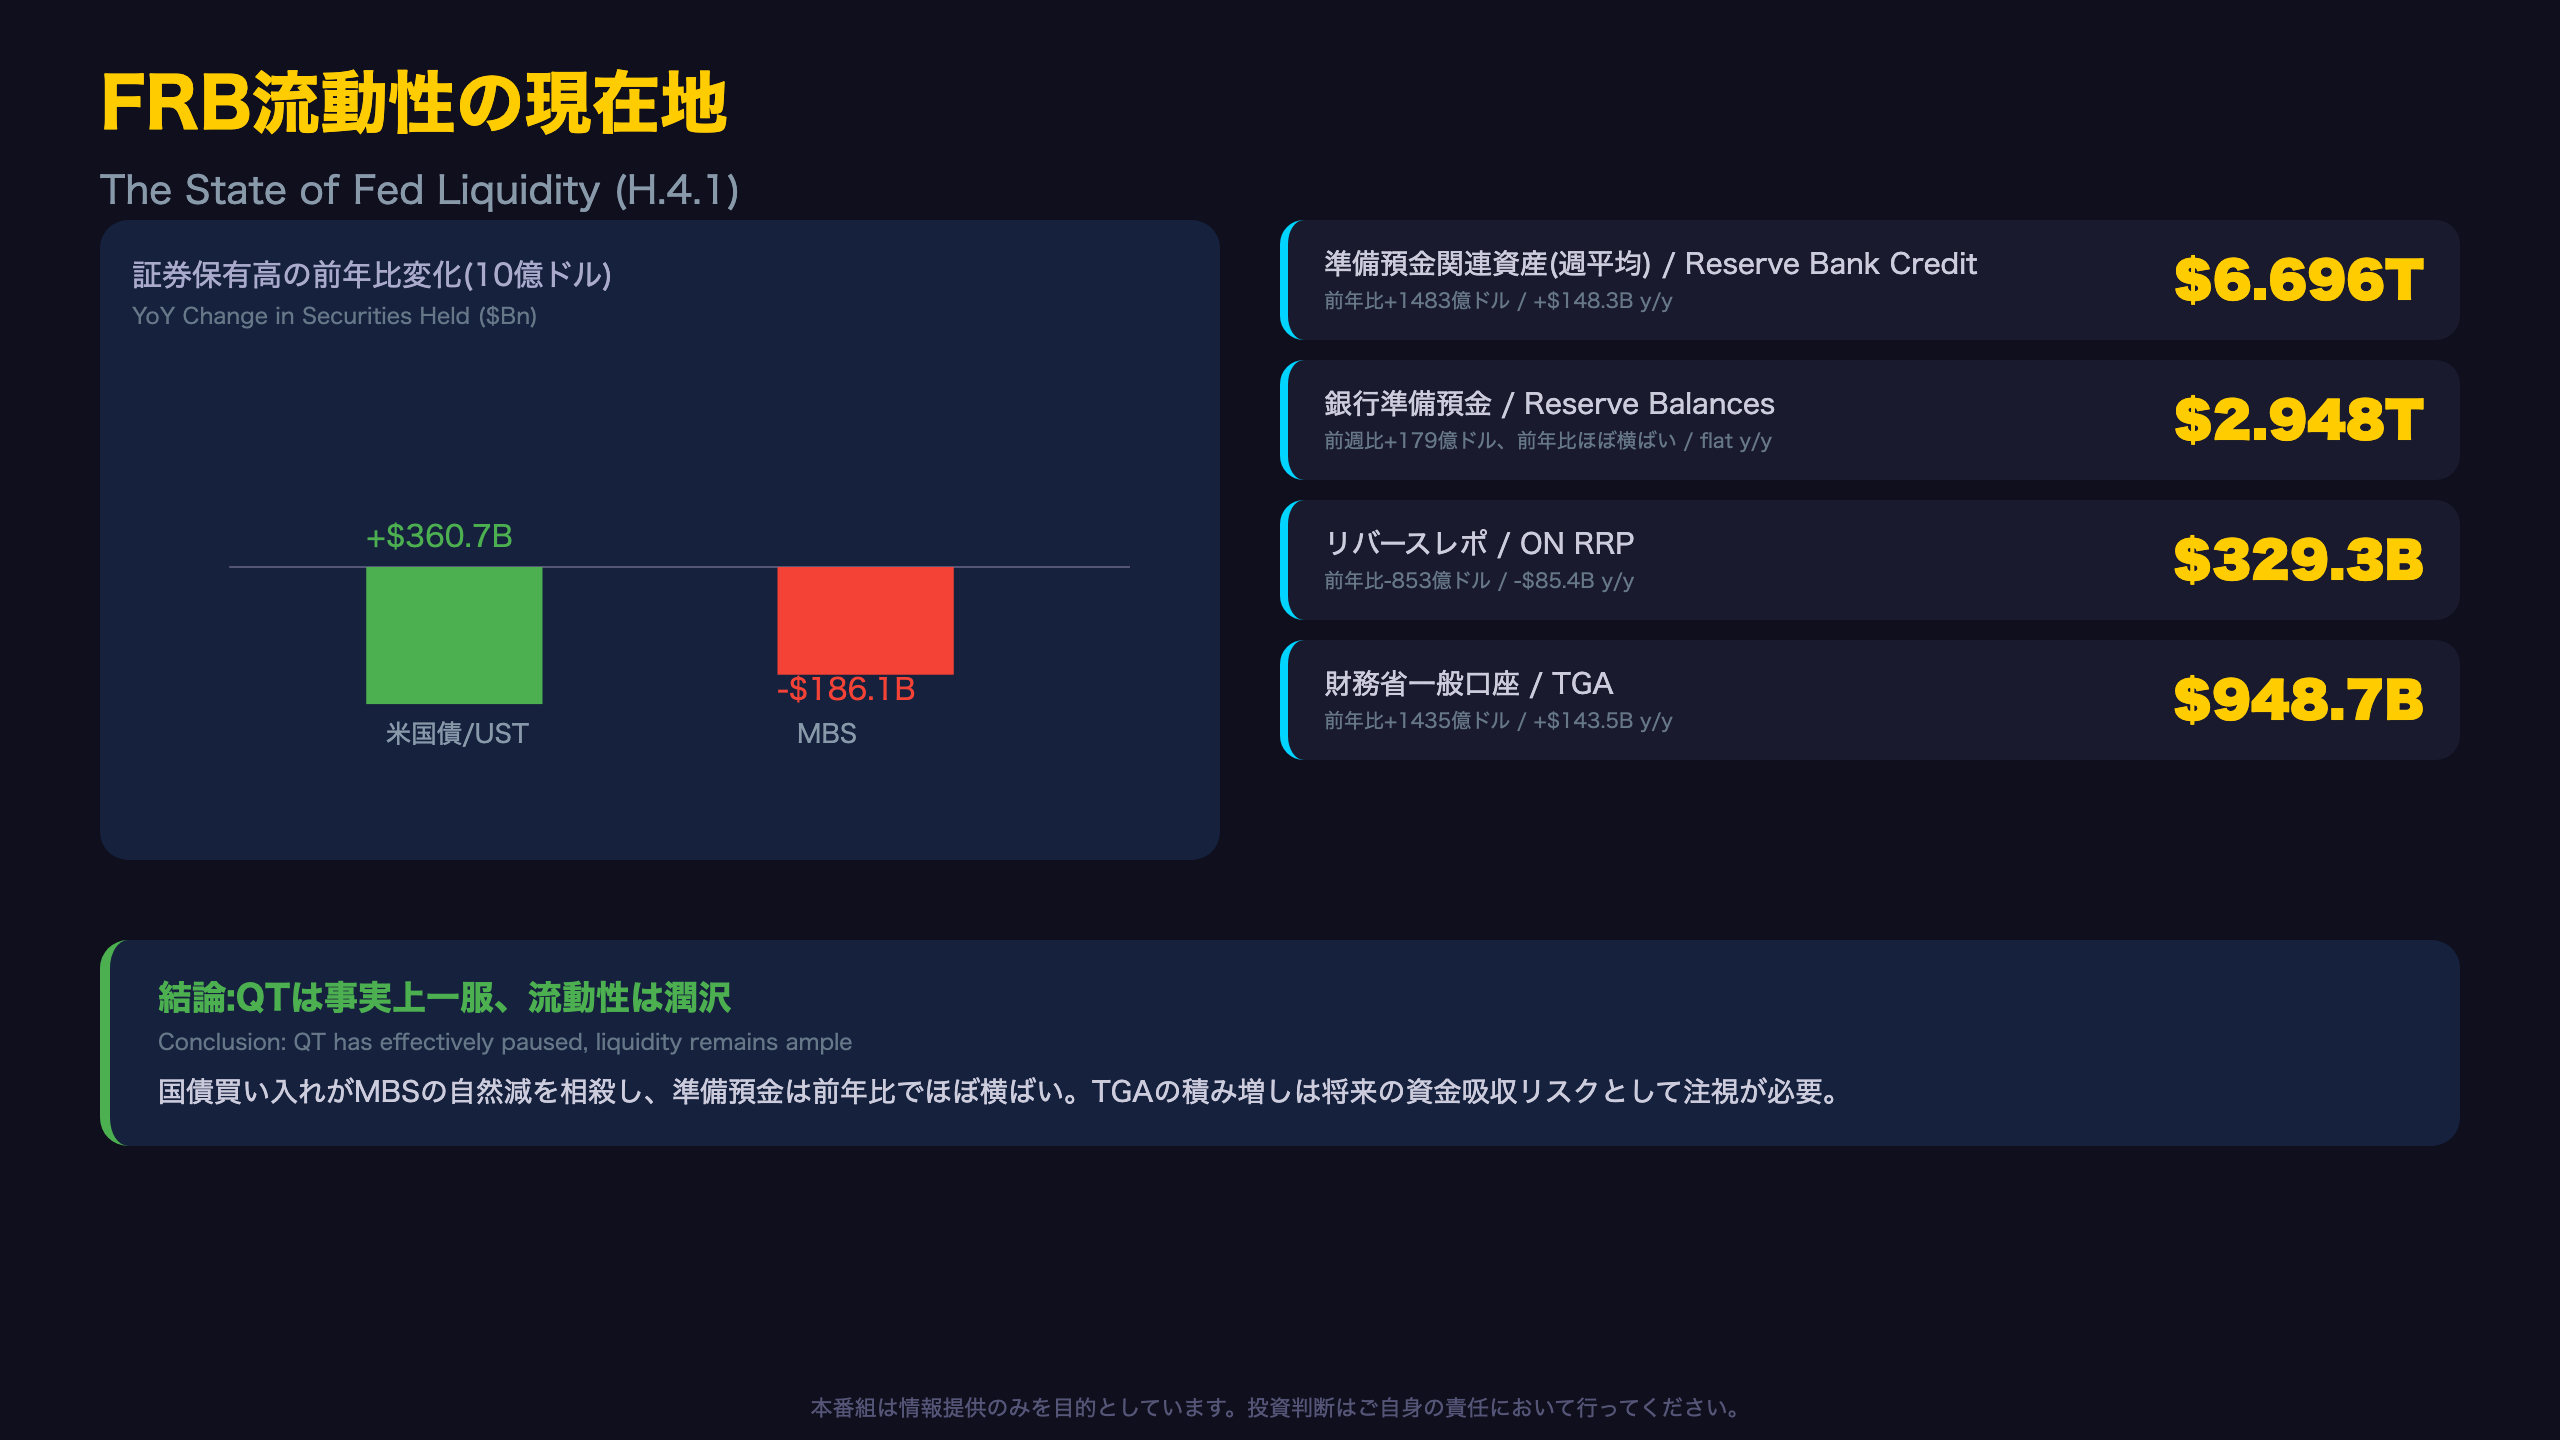
How QT Is Ending: Bill Issuance vs. MBS Runoff
The data show Treasury bill holdings up $361.1 billion year-over-year, dwarfing the $37.4 billion increase in nominal notes and bonds, meaning nearly all of the Fed’s Treasury growth is concentrated in short-dated bills. Meanwhile, MBS holdings continue to decline, down $186.1 billion year-over-year. In effect, the Fed is using active bill purchases, often described as “reserve management purchases” rather than QE, to offset passive MBS runoff, nudging the overall balance sheet modestly higher.
Context for international readers
The Fed’s H.4.1 release is the weekly equivalent of the ECB’s balance sheet data or the BOJ’s weekly business accounts; it is the most granular, timely window into the central bank’s balance sheet and the banking system’s reserve position. For comparison, the Fed had been shrinking its balance sheet continuously since 2022 under QT; this data suggests that process has effectively stalled for Treasuries even as MBS keeps running off passively.
Reverse repo and the TGA swing factor
The report shows reverse repo usage (ON RRP) down $85.4 billion year-over-year to $329.3 billion, hinting that money-market funds are redeploying cash elsewhere, likely into expanded bill supply, though the facility is far from drained and still functions as a liquidity buffer. The Treasury General Account averaged $948.7 billion, up $143.5 billion year-over-year; a rapid TGA drawdown would inject reserves into the system, while a rapid rebuild would drain them; a dynamic that can move short-term repo rates independent of Fed policy itself.
The next H.4.1 release is due October 8; watch whether reserve balances hold above the $2.9 trillion mark.
ストラテジスト総括
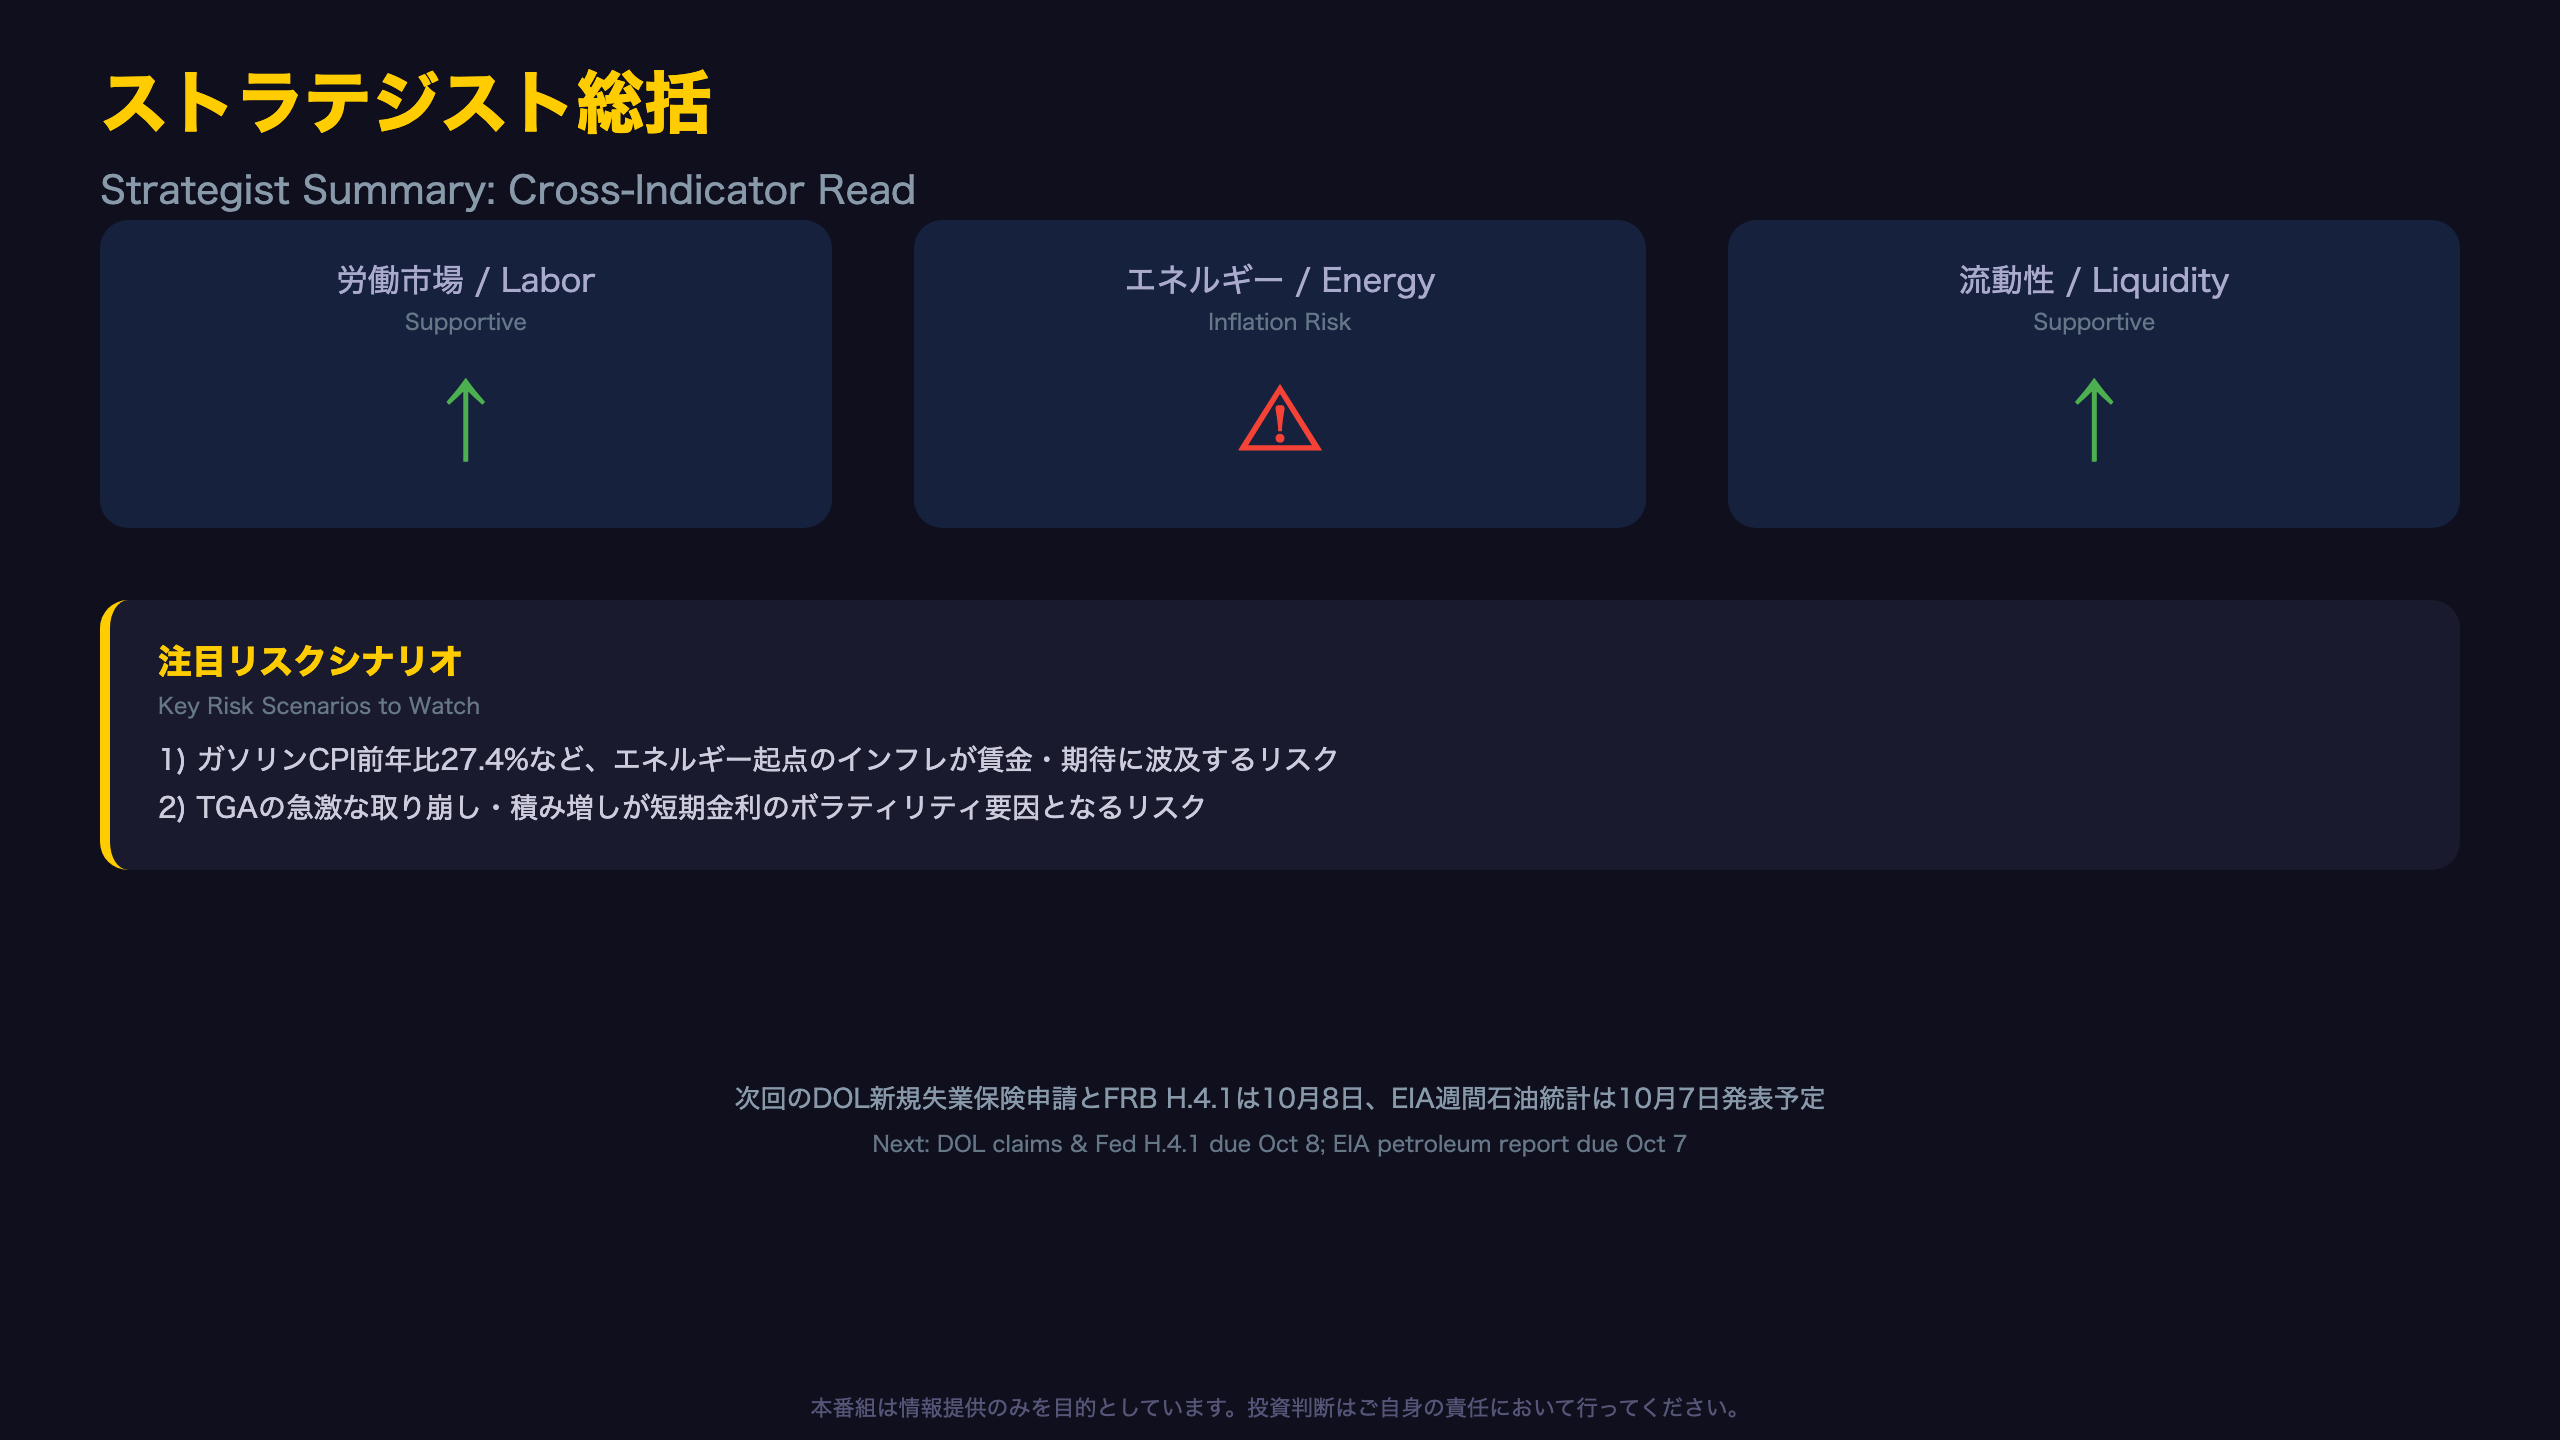
Scenario Mapping Across Asset Classes
Summing up the three indicators: labor market resilience and ample Fed liquidity both lean supportive, while energy prices lean toward upside inflation risk, a two-against-one split. For equities, this combination (no recession, ample liquidity) is a reasonably constructive backdrop. For bonds, however, persistent energy inflation makes it harder for long-term yields to grind meaningfully lower.
Context: why the TGA matters for global investors
Unlike the ECB or BOJ, the Fed’s operating framework ties the Treasury General Account directly to the banking system’s reserve balances. A rapid TGA drawdown (e.g., post-debt-ceiling resolution) mechanically injects reserves and loosens financial conditions, even without any change in Fed policy intent, while a rapid TGA rebuild does the opposite. This is a frequently overlooked lever for US dollar funding markets and repo rates, distinct from policy rate decisions themselves.
Two scenarios to watch
- Base case: The labor market’s current plateau persists, Fed Treasury purchases keep pace with MBS runoff, and energy prices stabilize, supporting a gradual disinflation path.
- Risk case: Gasoline CPI at +27.4% y/y, an outlier flagged by our regime model (Z-score 2.15), feeds into wage negotiations and inflation expectations, pushing back market expectations for Fed easing.
Direct quote from the data
The Fed’s H.4.1 release states: “Treasury, General Account 948,674 -28,410 +143,535 984,046,” underscoring the scale of the year-over-year TGA buildup.
Going forward, investors should track the upcoming jobs report and CPI alongside shifts in TGA balances and the pace of Fed Treasury purchases.
Disclaimer: This article is for informational purposes only. All investment decisions are made solely at your own risk.







