
📺 Watch the Full Video Analysis
This article was automatically generated by the NFC Market Live AI analysis system. (Updated: 2026-09-30 21:44 JST)
📄 Primary Source
U.S. Bureau of Economic Analysis
https://www.bea.gov/sites/default/files/2026-09/gdp2q26-3rd.pdf
🇺🇸 The US Bureau of Economic Analysis released its Third Estimate of Q2 2026 GDP.
📊 Real GDP was revised up to 2.2% SAAR (from 1.5%, +0.7pp).
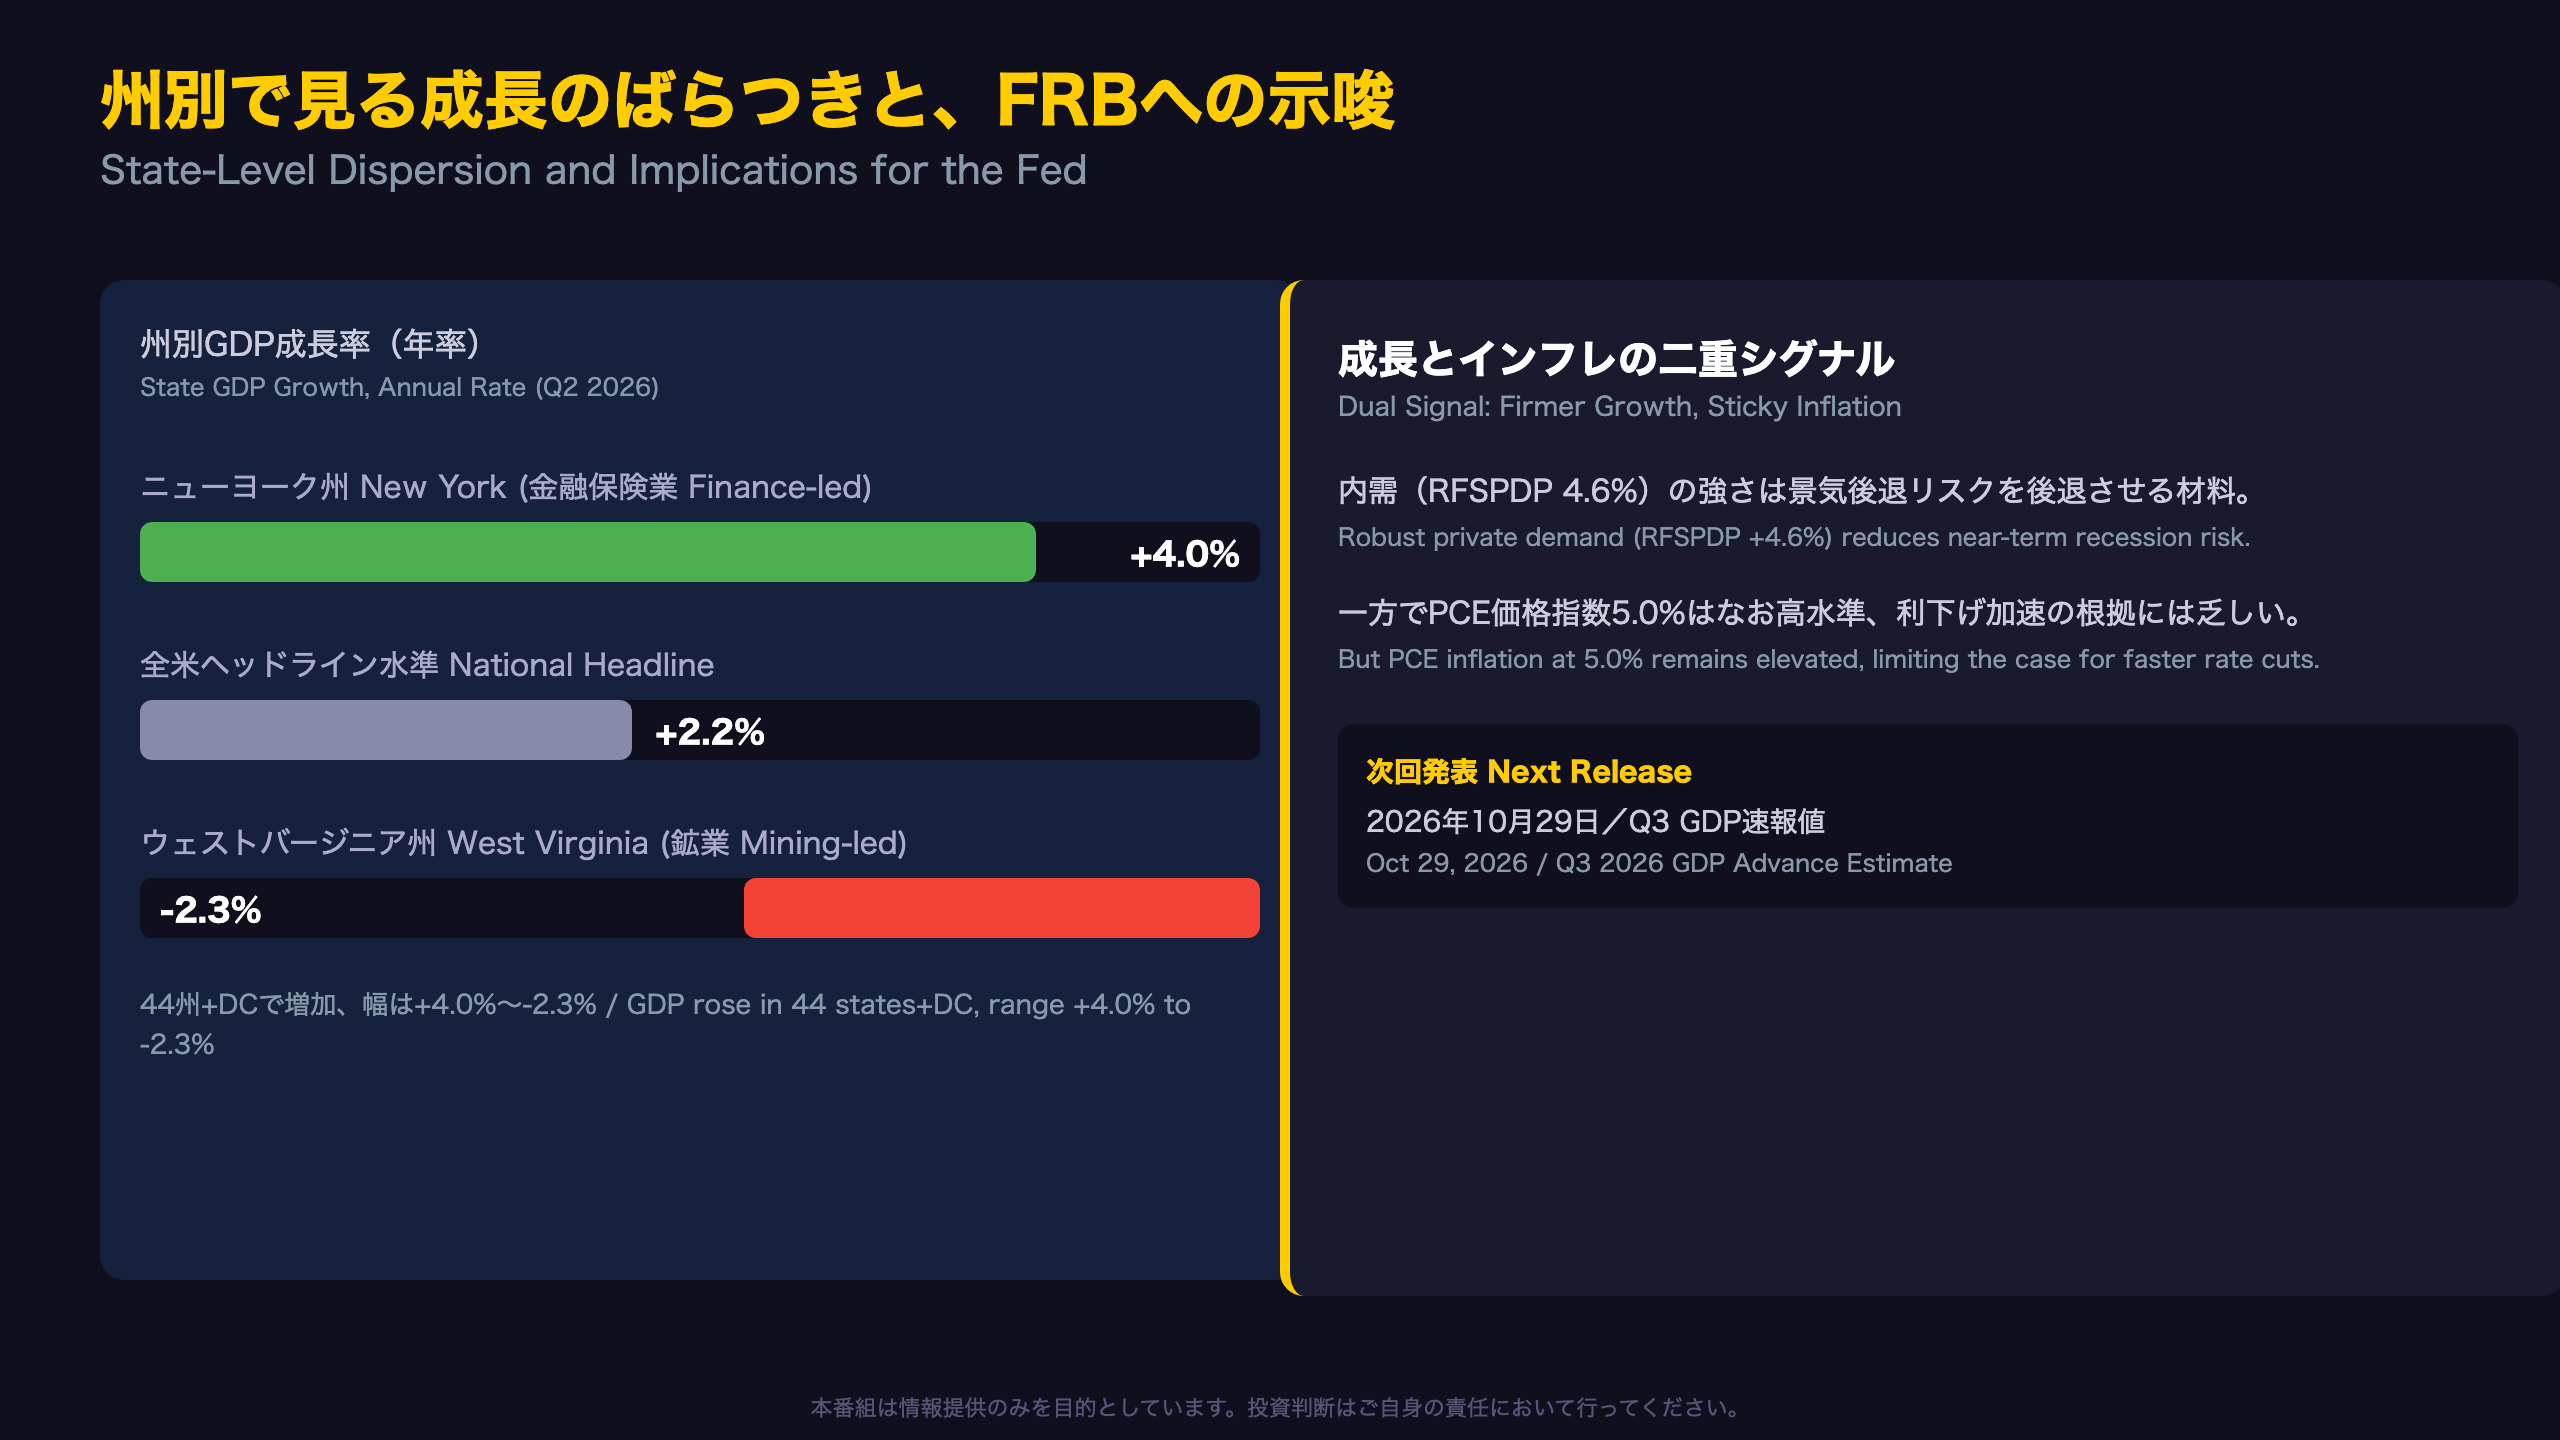
💪 Real final sales to private domestic purchasers surged to 4.6%, showing robust underlying demand.
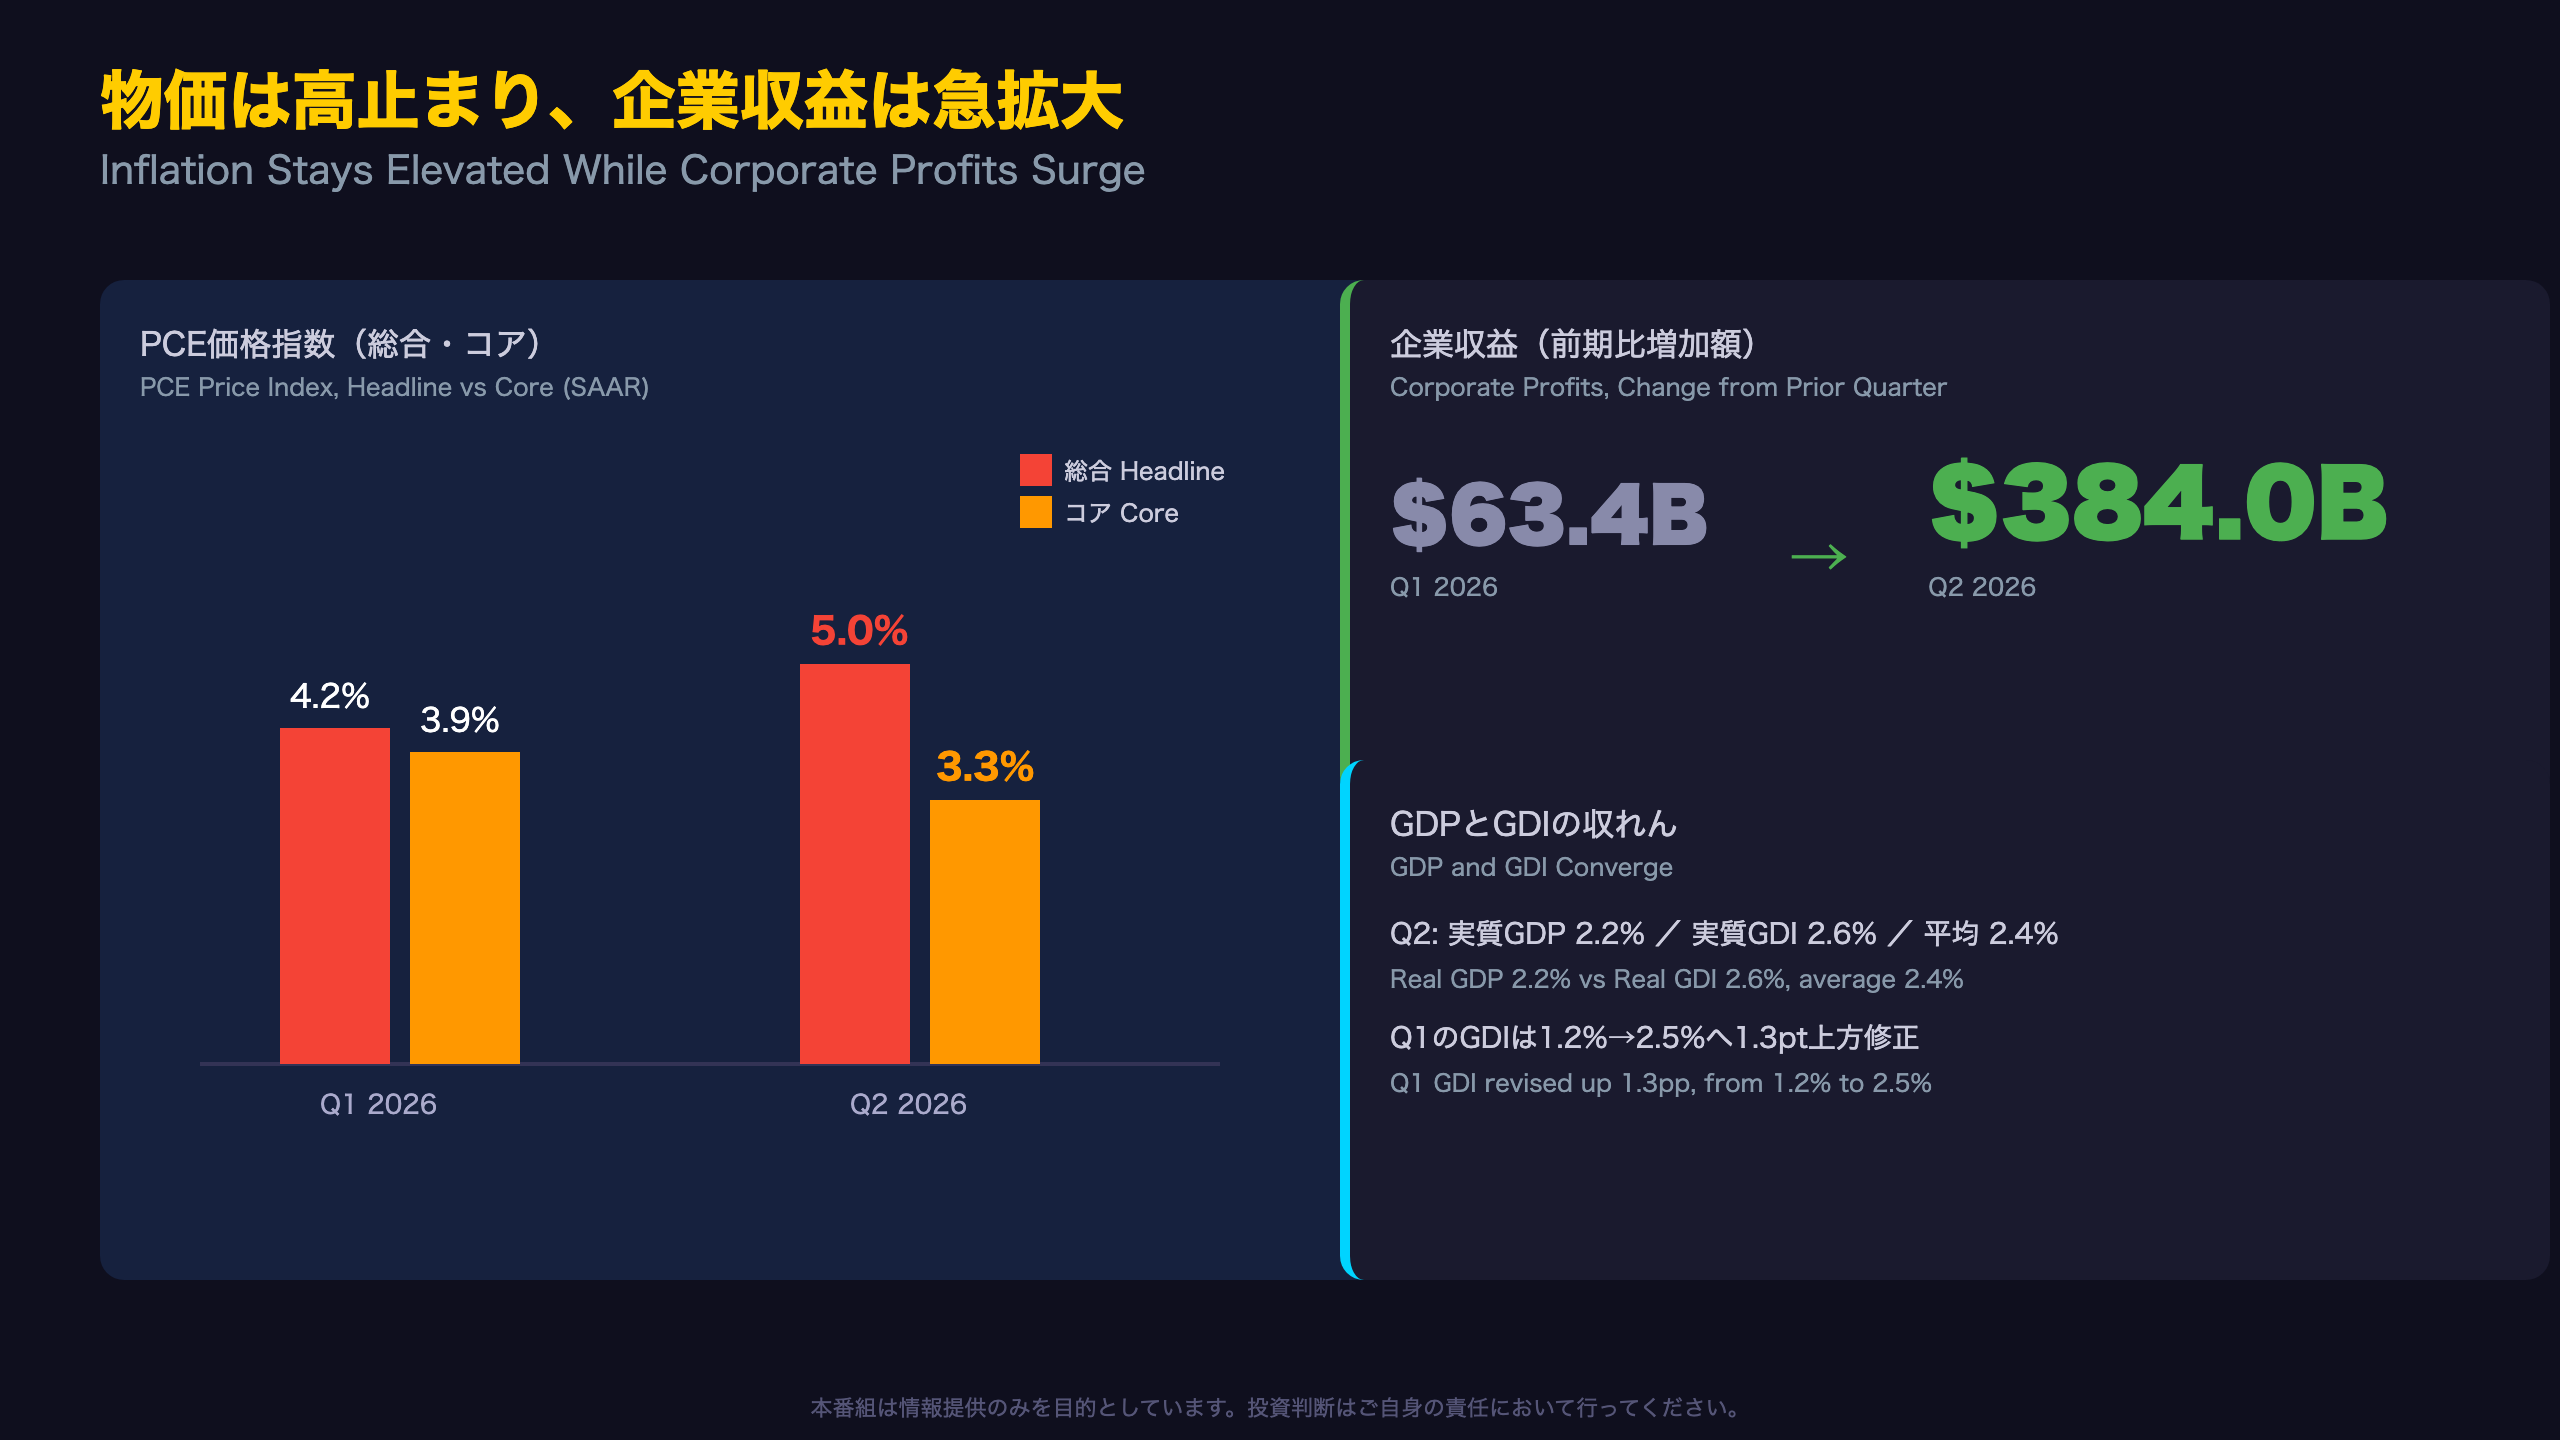
⚠️ Yet the PCE price index held at 5.0% (core 3.3%) — still elevated.
💡 Stronger growth and sticky inflation together complicate the Fed’s path forward.
Next release: Oct 29, 2026, Q3 GDP Advance Estimate.
The Ultimate Summary:GDP2.2%へ大幅上方修正
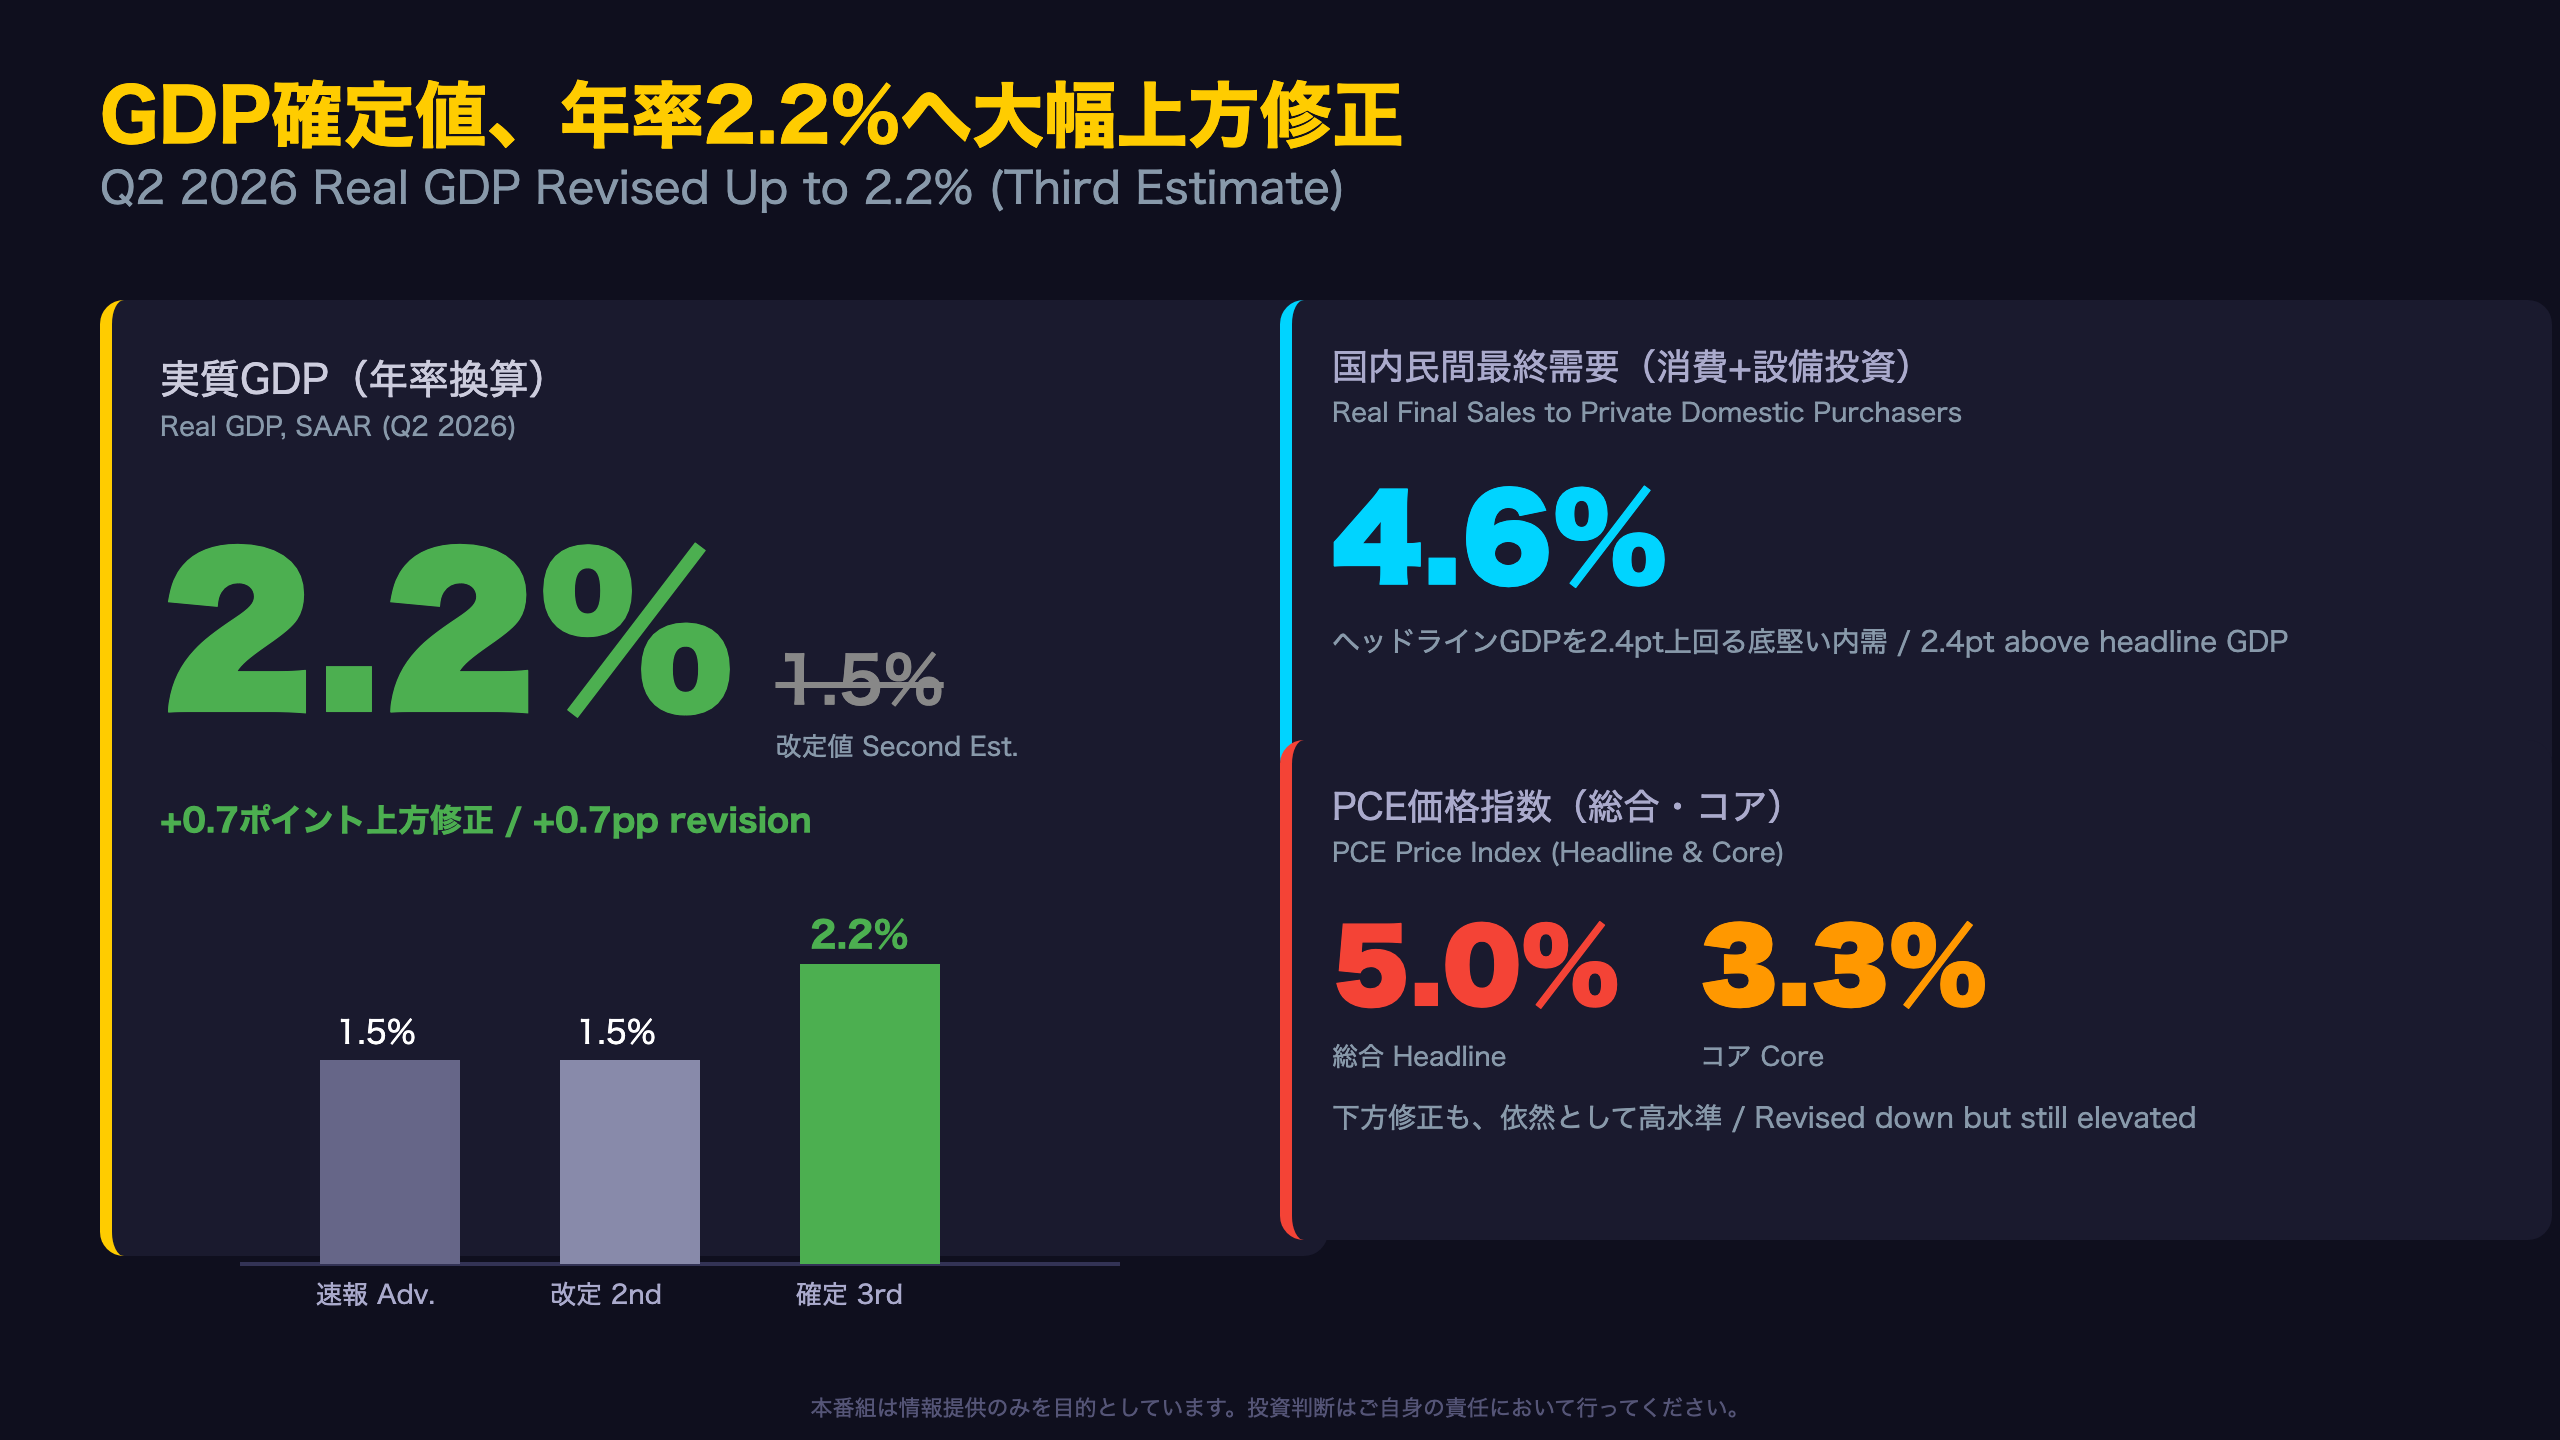
Understanding BEA’s Three-Stage GDP Estimates
Unlike many countries that publish a single GDP figure, the U.S. Bureau of Economic Analysis (BEA) releases GDP in three sequential estimates: Advance, Second, and Third (Final). Today’s release is the Third Estimate for Q2 2026, published alongside BEA’s Annual Update — a five-year data overhaul (2021 Q1 through 2026 Q1) that occurs roughly once a year and can trigger unusually large revisions.
That context matters: the +0.7 percentage point upward revision from the Second Estimate (1.5% to 2.2%) is notably larger than a typical quarter-to-quarter revision, which usually runs a few tenths of a point. This isn’t just noise — it reflects genuine improvements in source data (Census Bureau surveys, BLS wage data) layered on top of the annual benchmarking process.
Q1 2026 GDP was also revised up, from 2.1% to 2.5%, meaning the U.S. economy entered mid-2026 in stronger shape than initially reported.
For international investors, revisions of this magnitude can shift the narrative from “late-cycle slowdown” to “resilient expansion” almost overnight — with direct implications for Fed rate-path expectations and dollar positioning. The next release (Q3 Advance Estimate, October 29, 2026) will build on this newly revised, higher base.
上方修正の中身——投資・消費・政府支出が総崩し的に上振れ
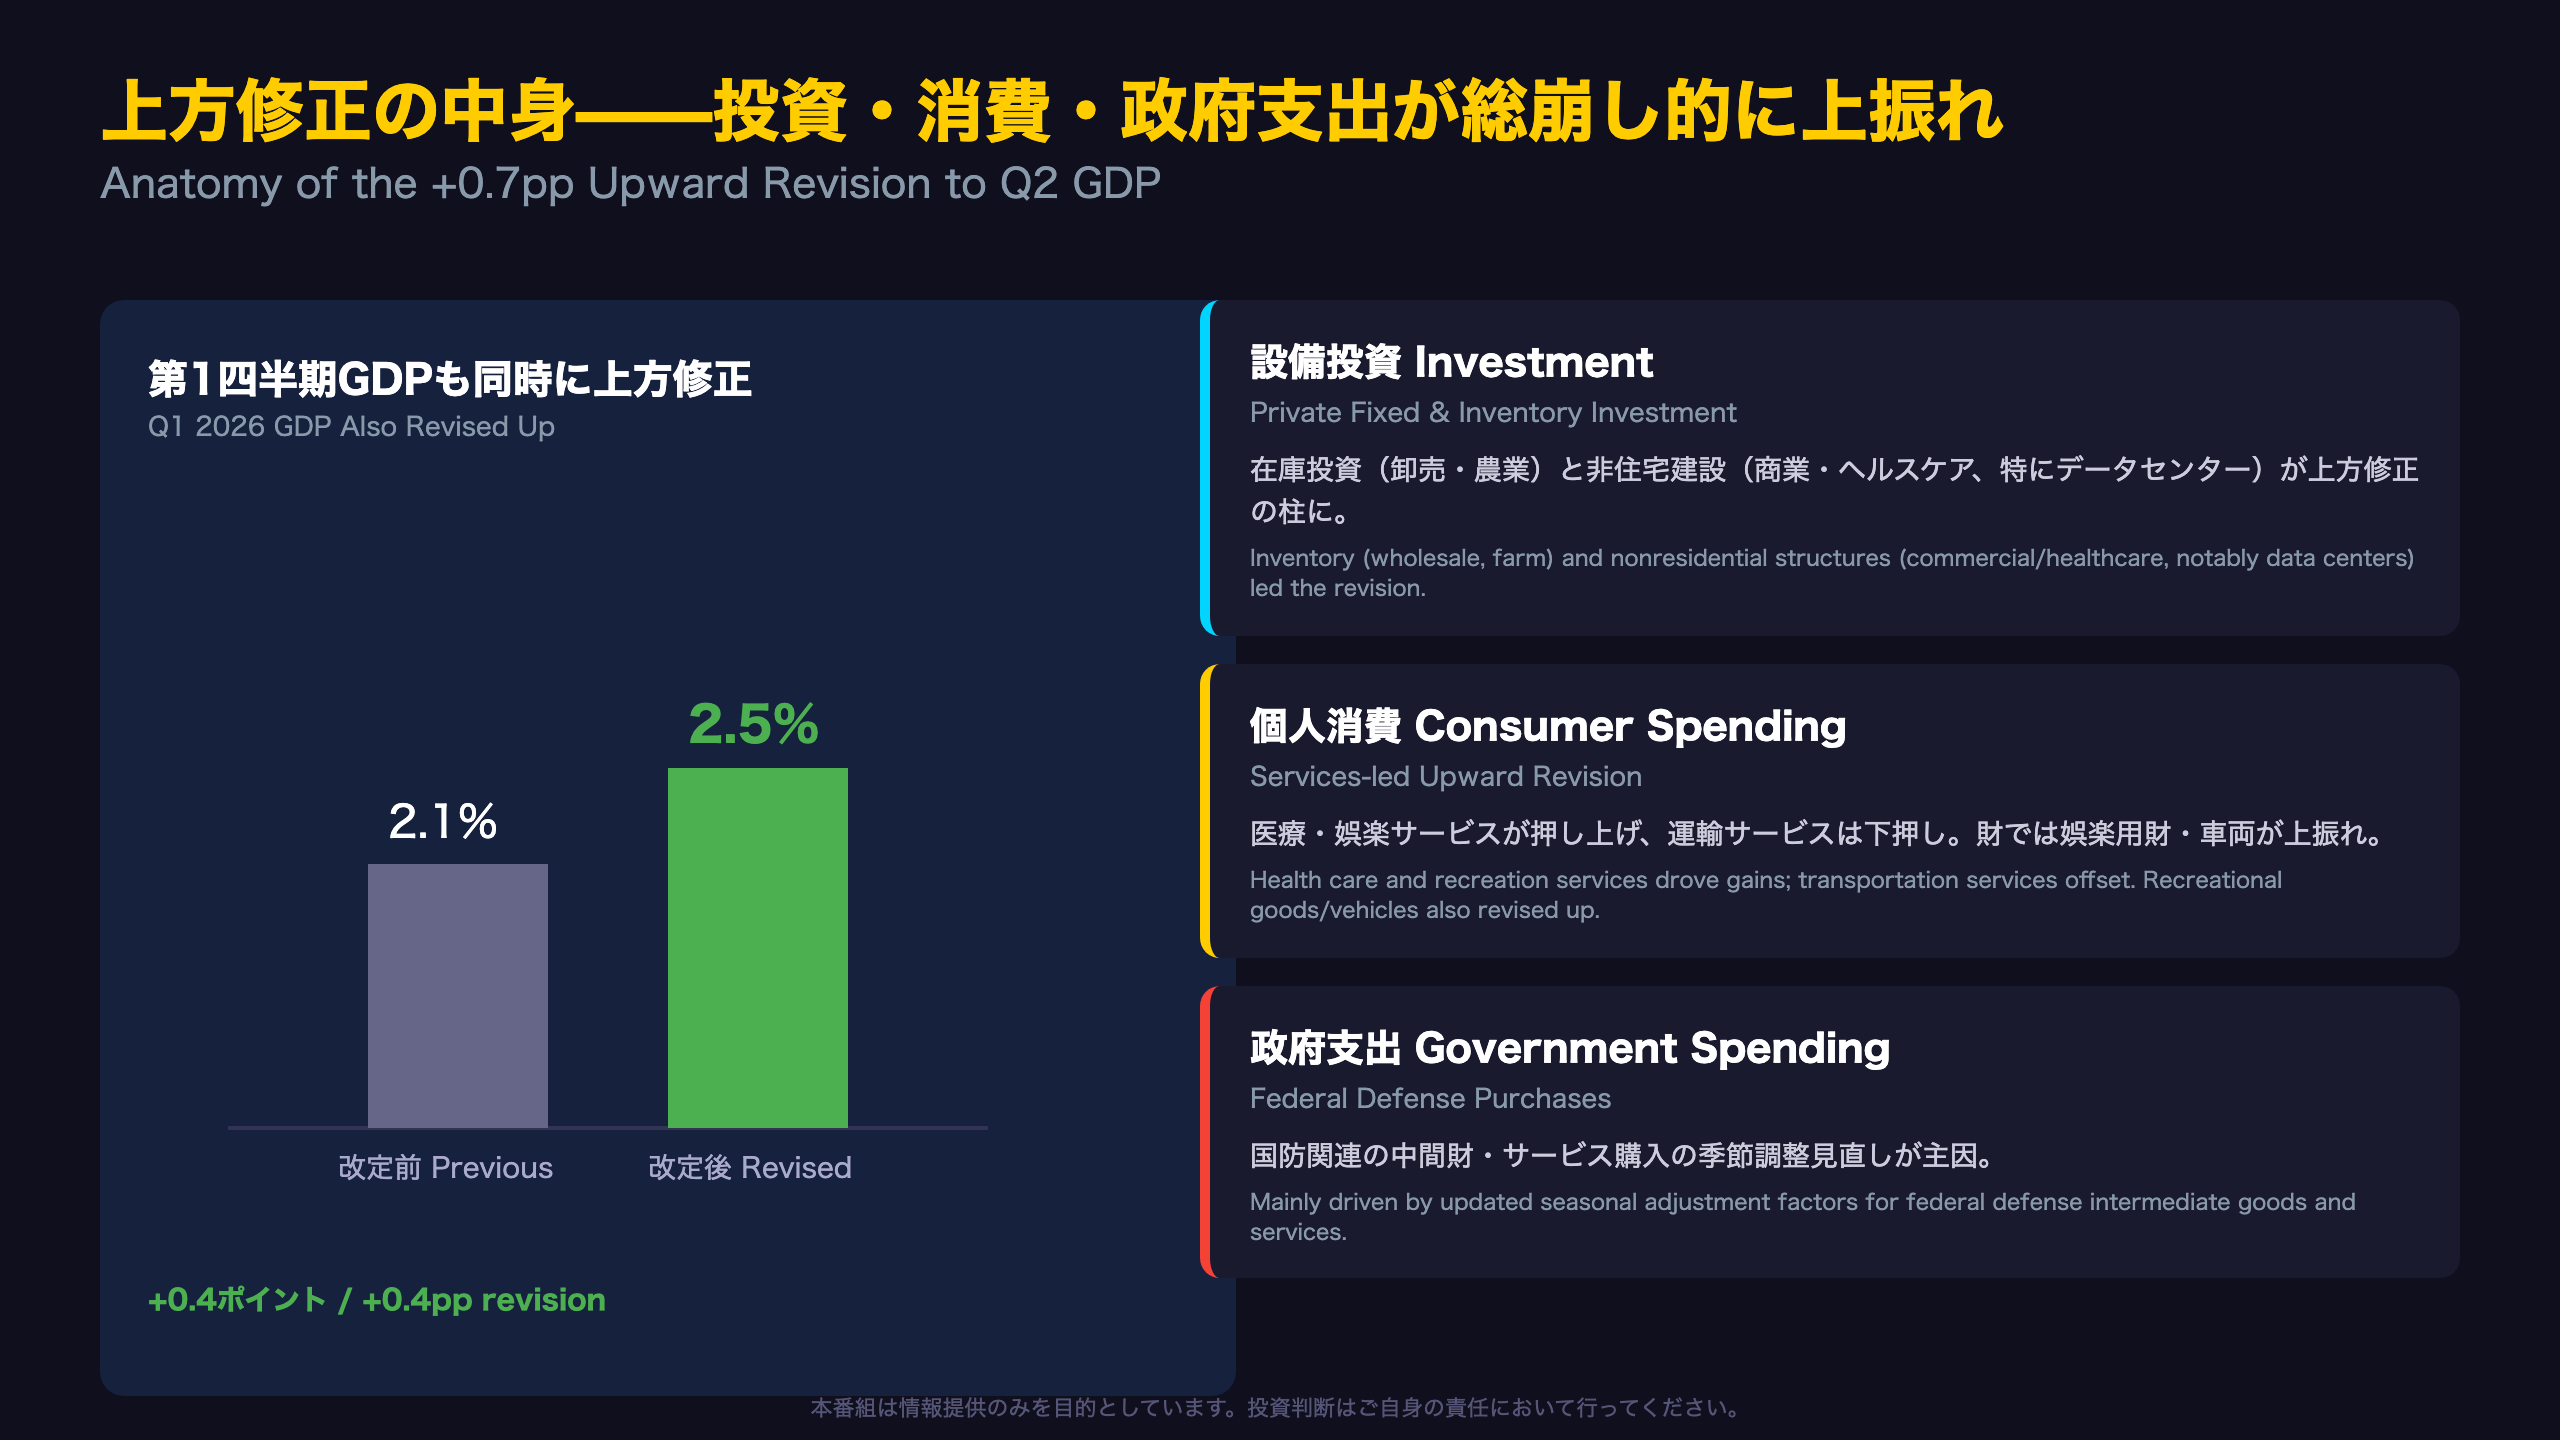
The Data Center Investment Story
One of the most striking details buried in BEA’s technical notes: the upward revision to nonresidential structures investment was “led by commercial and health care, mainly data centers.” This is a direct, official confirmation that AI-related infrastructure spending is now visibly moving the needle on U.S. GDP statistics — not just anecdotally, but in the government’s own accounting.
Inventory investment also played a bigger role than previously thought, with upward revisions across wholesale trade, mining/utilities/construction, and farm inventories (both crops and livestock). This suggests businesses were restocking more aggressively than initially estimated — often a sign of confidence in near-term demand.
On the consumer side, health care and recreation services drove the upward revision, while air transportation services were revised down. Within goods, recreational goods and vehicles (including information processing equipment) added to the upside.
Investor takeaway: these are backward-looking data revisions based on newly available survey data (Census Bureau, USDA, BLS), not forward guidance. Whether the data-center-driven investment boom continues will be tested in the Q3 Advance Estimate on October 29, 2026.
内需の実力——国内民間最終需要はヘッドラインを凌駕
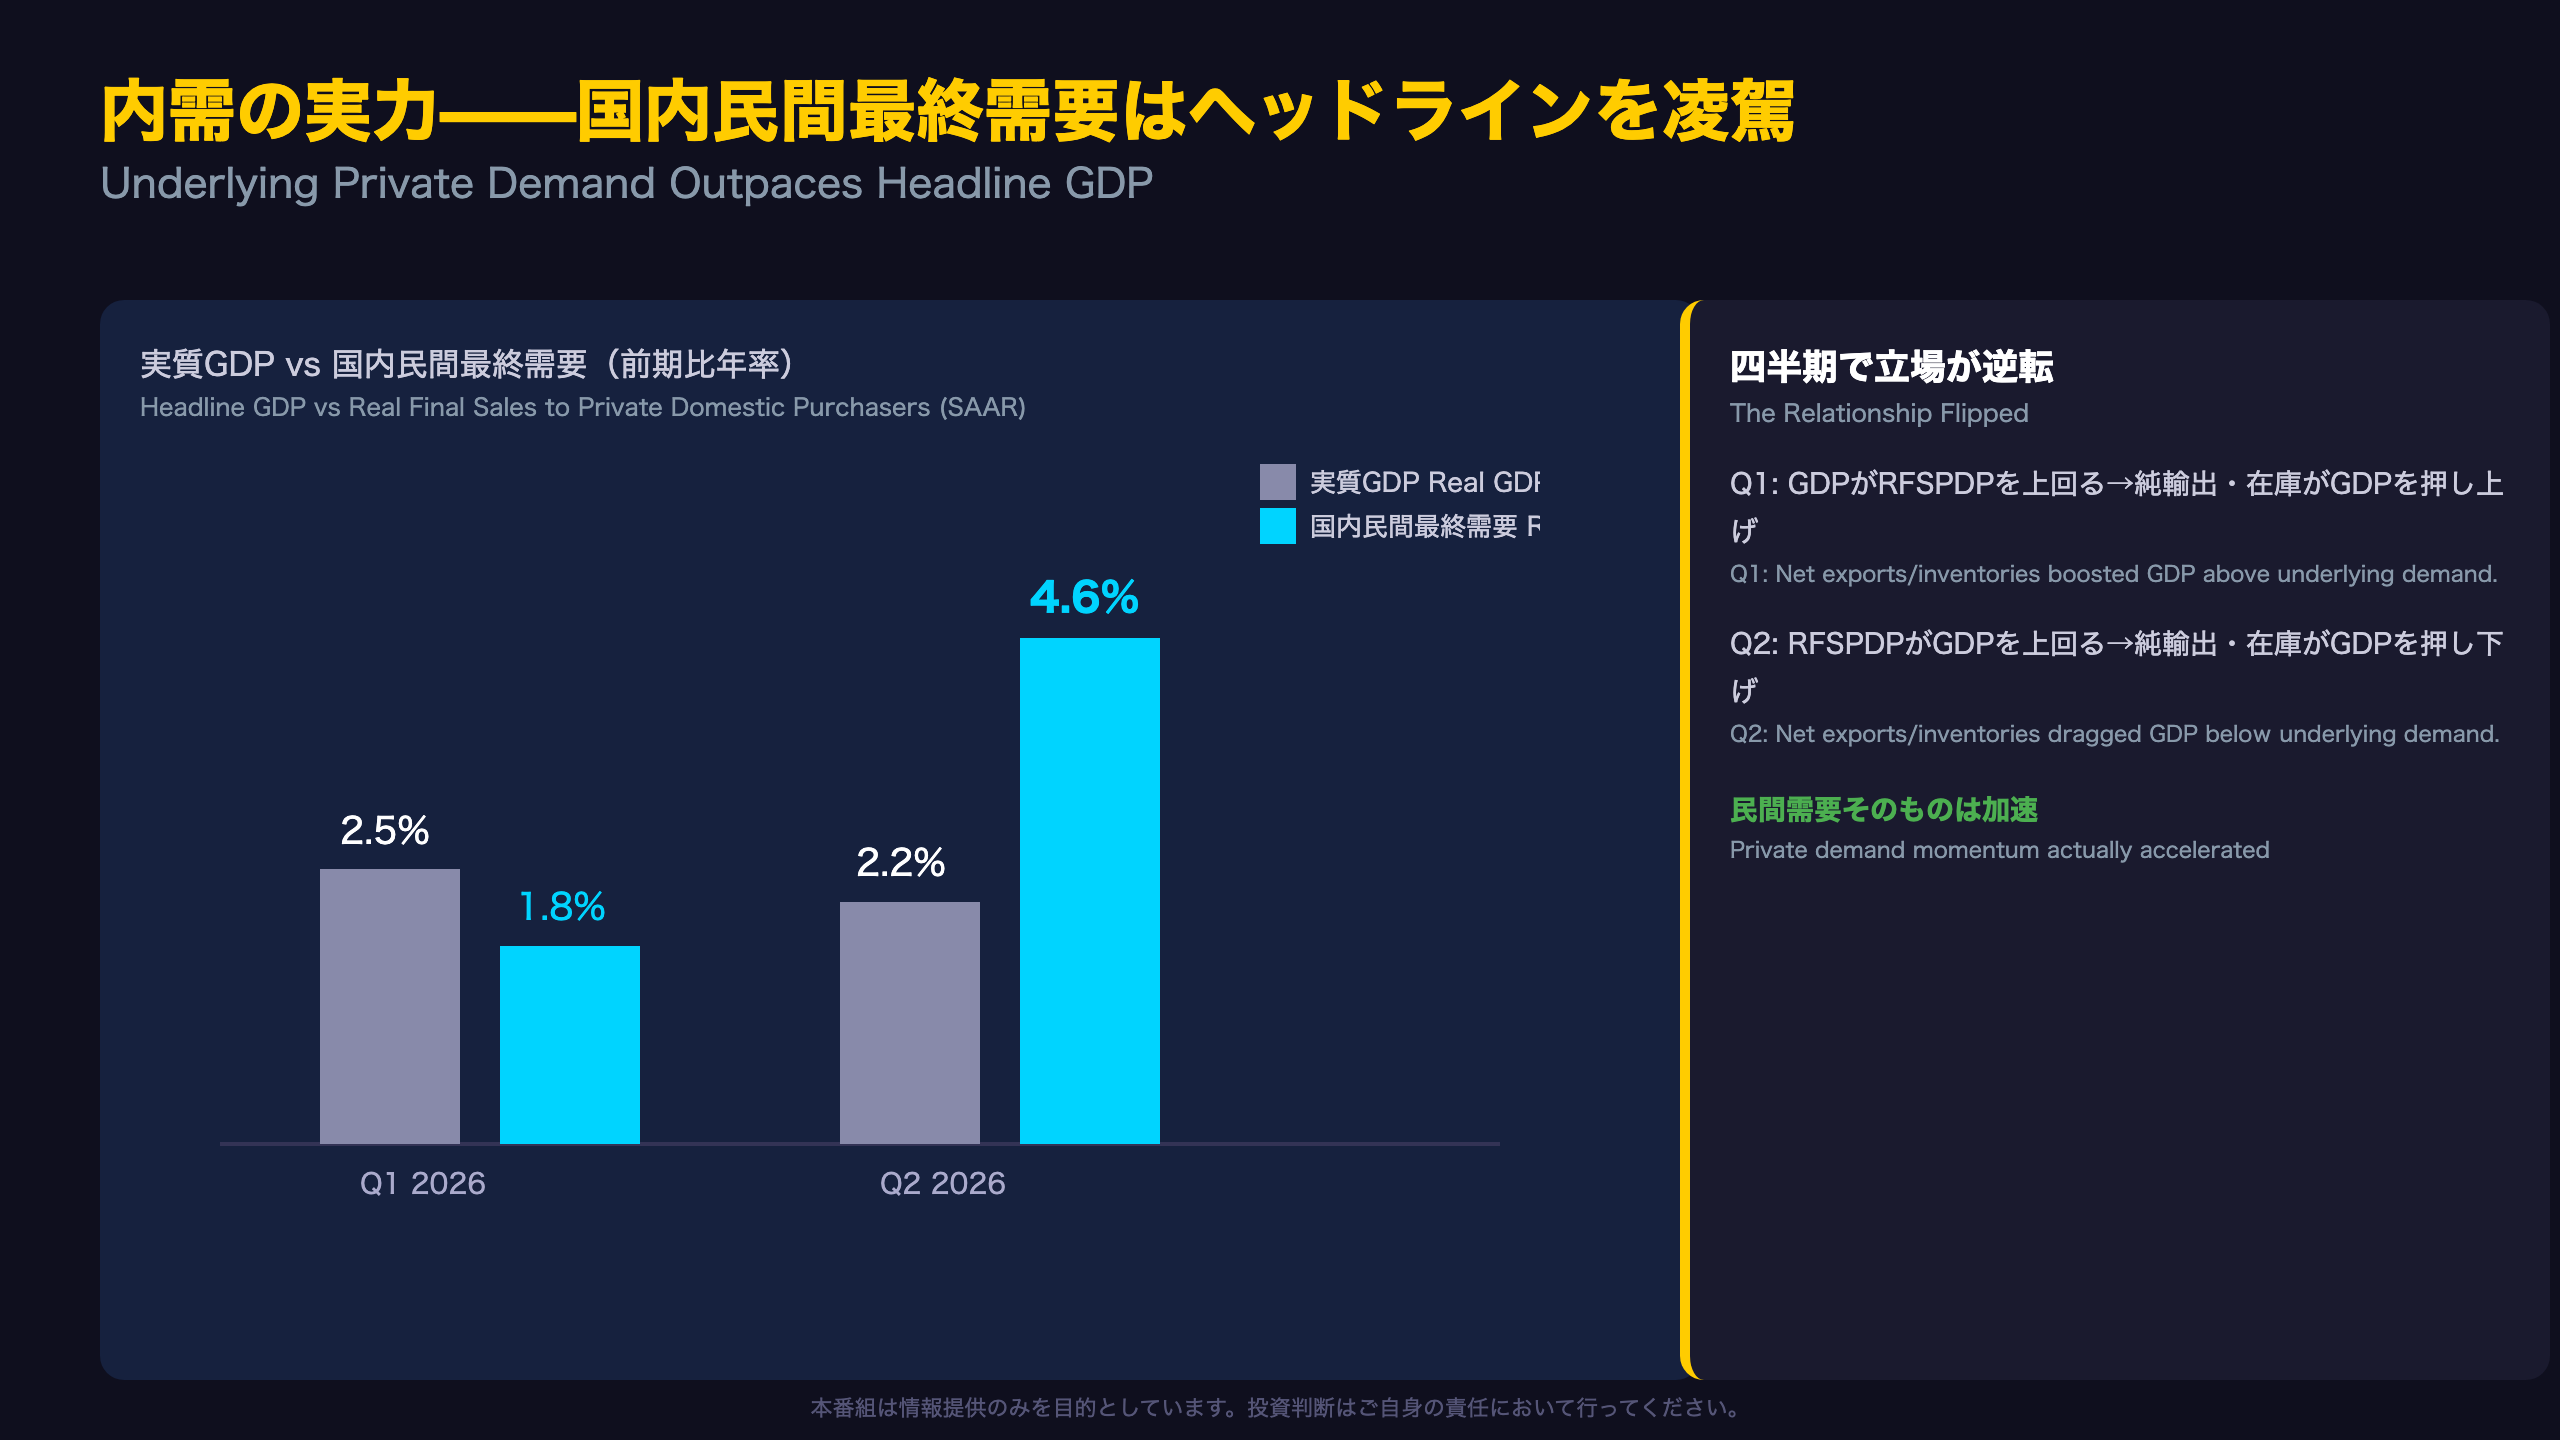
Why Headline GDP and Underlying Demand Diverged
A subtle but important detail: the relationship between headline GDP and Real Final Sales to Private Domestic Purchasers (RFSPDP) flipped between Q1 and Q2. In Q1, GDP (2.5%) exceeded RFSPDP (1.8%), implying net exports and inventories were adding to growth. In Q2, RFSPDP (4.6%) far exceeded GDP (2.2%), implying inventories and trade were actually a drag on the headline number.
This matters because RFSPDP — consumer spending plus private fixed investment — is widely regarded by economists as the best single gauge of underlying private demand, stripping out the noisy inventory and trade components. Its acceleration from 1.8% to 4.6% suggests private-sector spending momentum built up through the quarter even as headline GDP growth moderated slightly.
Technical notes reveal residential investment was revised up, led by home improvements, adding another layer of evidence for broad-based household spending strength.
Caveat: RFSPDP itself includes volatile components like residential investment and durable goods, so a single quarter’s surge shouldn’t be read as a permanent trend shift.
産業別寄与度——不動産・情報・金融が牽引
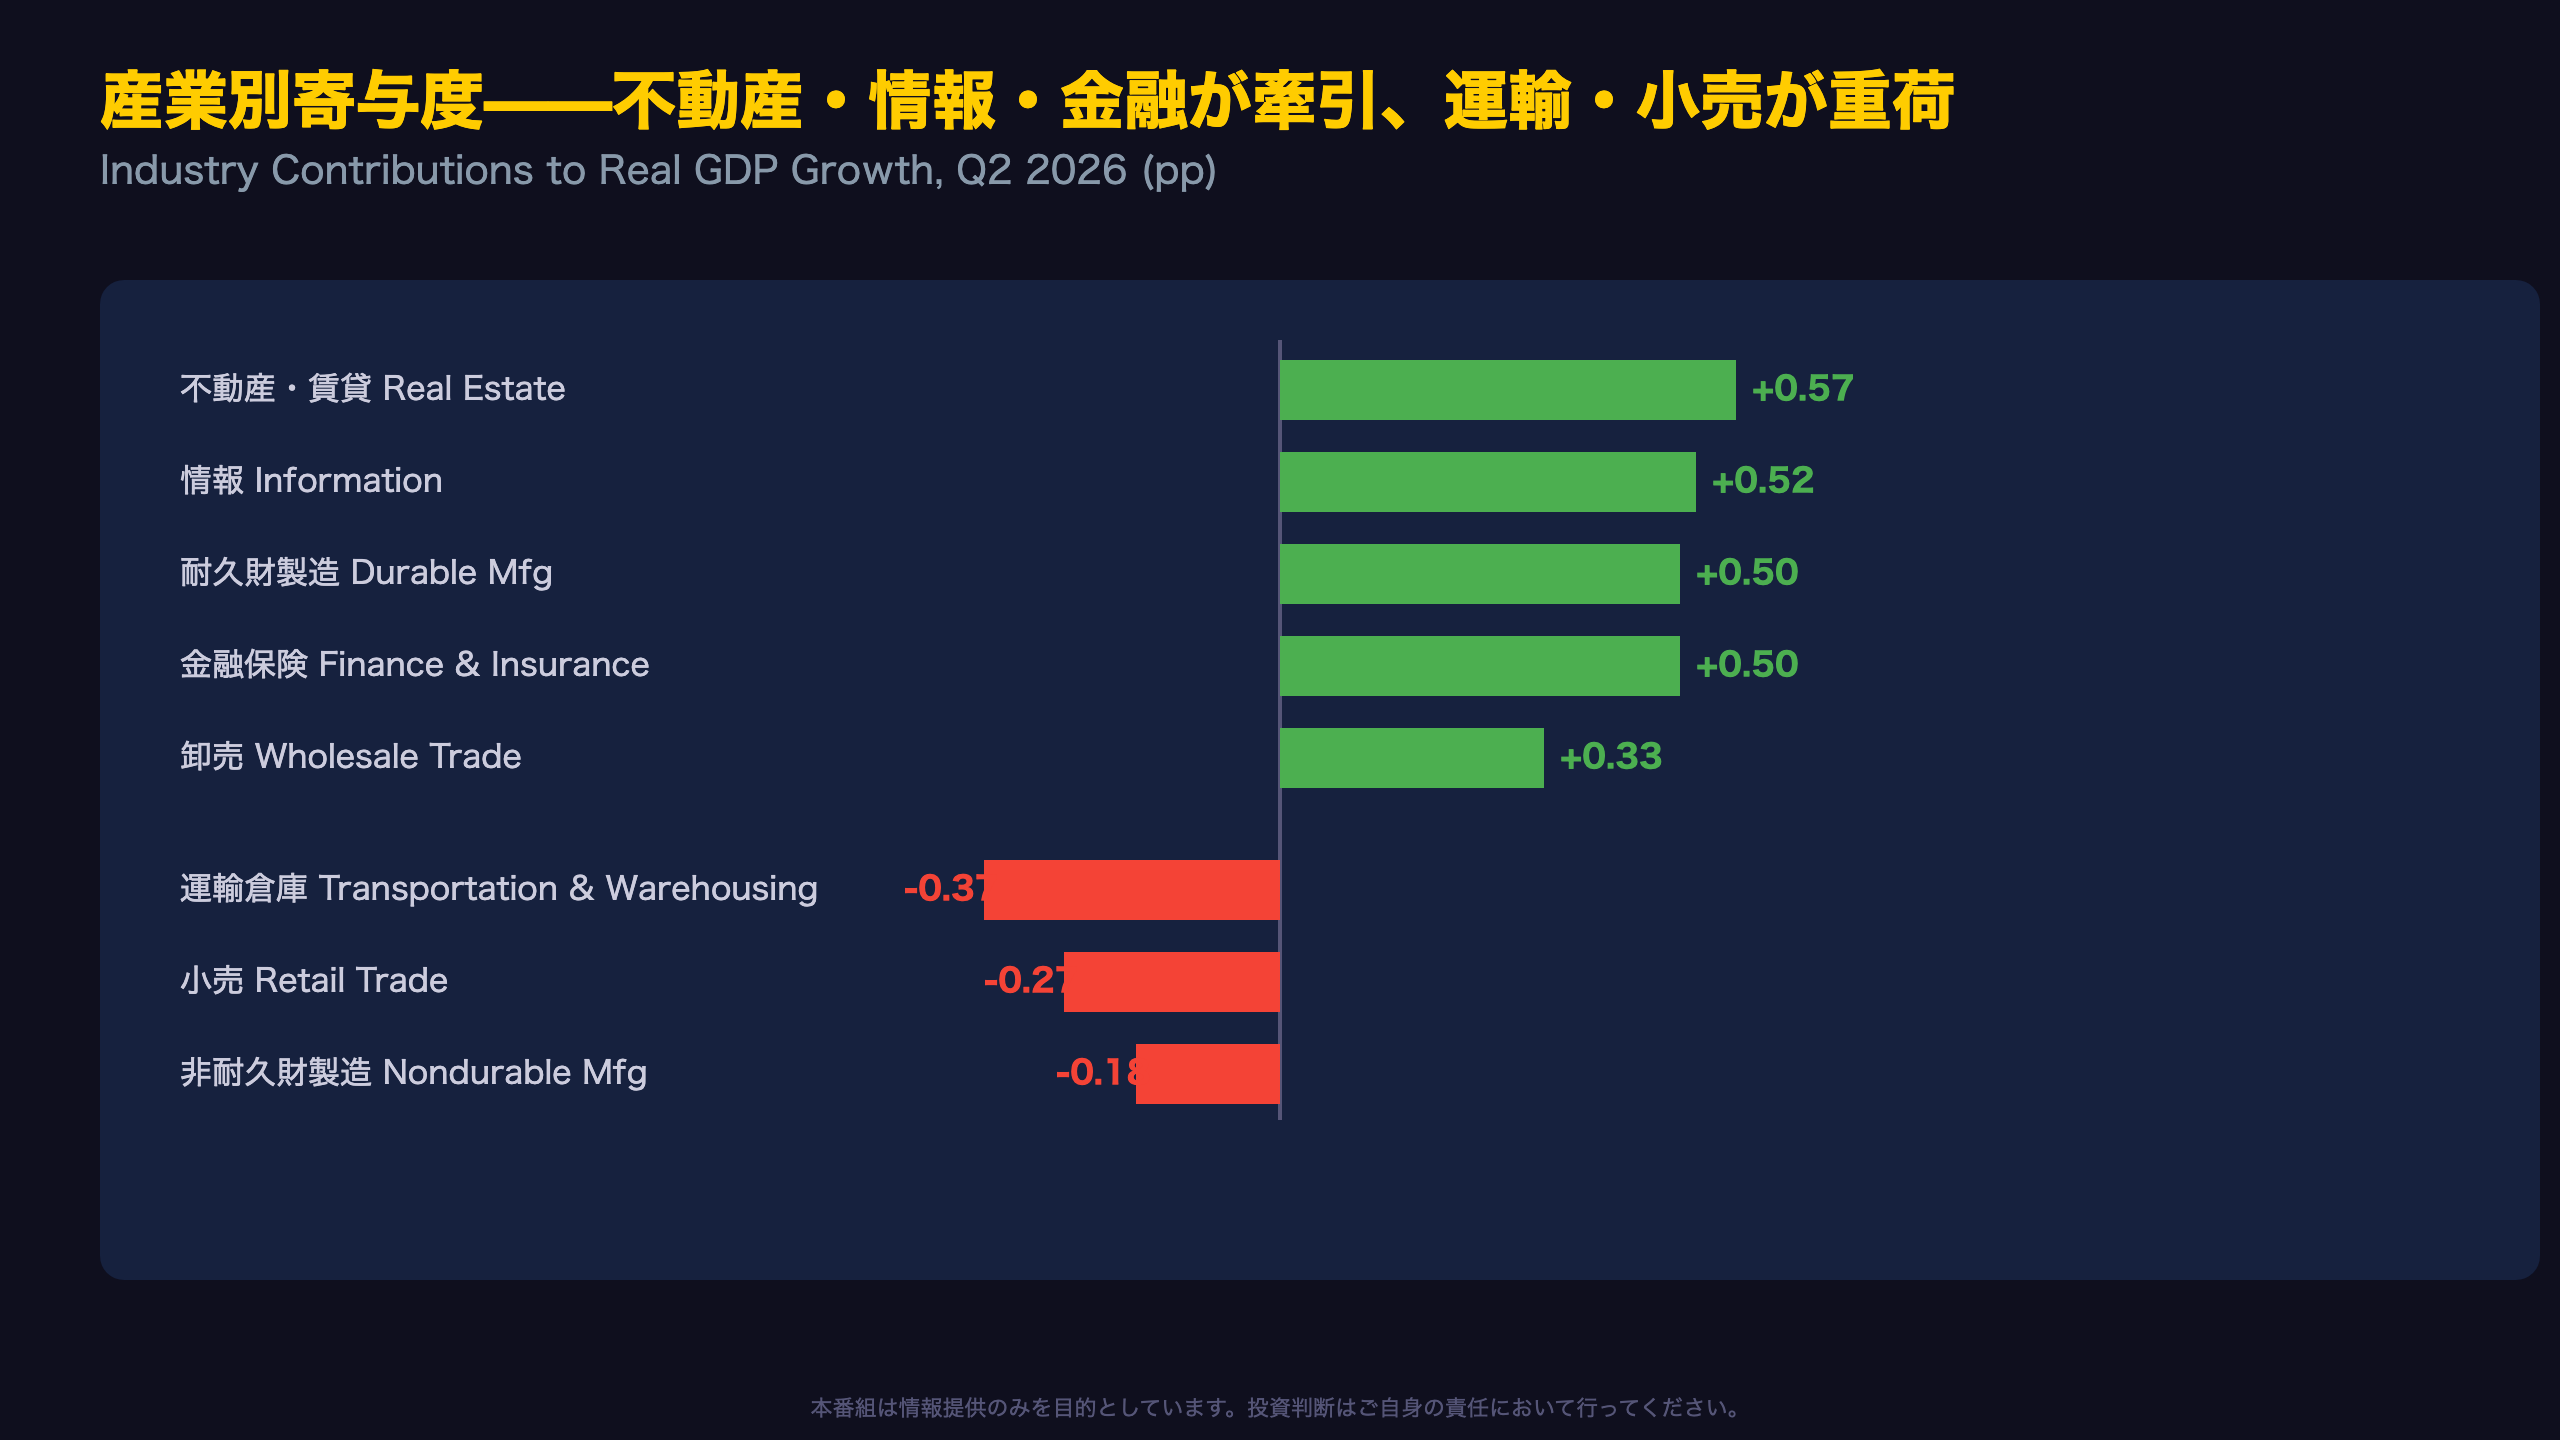
Services vs. Goods: The Real Gross Output Lens
Beyond value-added contributions, BEA’s Real Gross Output measure — which captures total industry sales rather than just value-added — shows the growth gap between sectors even more starkly. Q2 gross output rose 5.0% overall, split between a 6.0% gain in private services-producing industries versus just 3.0% for private goods-producing industries and 2.6% for government.
At the industry-contribution level, real estate/rental (+0.57pp), information (+0.52pp), durable goods manufacturing (+0.50pp), and finance/insurance (+0.50pp) led the advance. On the downside, transportation & warehousing (-0.37pp) and retail trade (-0.27pp) were the biggest drags.
The retail trade detail is particularly notable: overall consumer spending rose in Q2, yet retail trade as an industry saw its value-added shrink. This could reflect a channel shift toward services consumption (health care, recreation) or margin compression at retailers — though a single quarter of data cannot confirm which explanation dominates.
For sector-focused investors, this data reinforces the narrative of a services-and-tech-led U.S. economy, with traditional goods-handling industries lagging behind finance, real estate, and information/tech.
物価は高止まり、企業収益は急拡大
The GDI Revision Nobody’s Talking About
Buried in the Annual Update is a remarkable revision: Q1 2026 Real Gross Domestic Income (GDI) — a measure of the economy from the income side rather than the spending side — was revised from just 1.2% to 2.5%, a 1.3 percentage point jump. The primary driver was newly available first-quarter wage and salary data from the BLS Quarterly Census of Employment and Wages (QCEW), a comprehensive payroll-tax-based dataset considered highly reliable.
In theory, GDP and GDI should be identical, since one measures spending and the other measures income on the same economic activity. In practice, they diverge due to measurement error (the “statistical discrepancy”). In Q2, GDI (2.6%) modestly exceeds GDP (2.2%) — a gap economists consider within normal range — and BEA’s own “average of GDP and GDI” metric, often viewed as a cleaner growth signal, came in at 2.4%.
Corporate profits jumped to +$384.0 billion in Q2 from just +$63.4 billion in Q1 (itself revised down $11.0 billion). This profit surge is consistent with strong nominal GDP growth (8.5%) and suggests companies retained pricing power even as the broader price index stayed elevated.
州別で見る成長のばらつきと、FRBへの示唆
State-Level PCE: Health Care and Housing Lead Consumption
BEA’s state-level data reveals that 2025 state Personal Consumption Expenditures (PCE) rose 5.3% nationally, with increases in all 50 states and D.C. Florida topped the list at +7.0%, while California posted the smallest gain at +4.2%.
Per BEA: “Health care and housing and utilities were the leading contributors to the increases in PCE in most states, including Florida.” This pattern — necessity-driven spending outpacing discretionary categories — could reflect both price effects (inflation in these sticky-price categories) and structural factors (aging demographics, elevated housing costs). A single year of data cannot isolate which factor dominates.
On the income side, personal income rose in 49 states plus D.C., ranging from +6.4% in Wisconsin to -4.2% in North Dakota (the only state to decline). The state-level dispersion in GDP growth — New York’s +4.0% (finance-led) versus West Virginia’s -2.3% (mining-led) — underscores how uneven the composition of U.S. growth remains beneath the strong national headline.
Looking ahead: the Q3 Advance GDP Estimate arrives October 29, 2026. Key questions include whether import growth persists (a drag on headline GDP) and whether the data-center-driven investment boom continues.
Disclaimer: This article is for informational purposes only. All investment decisions are made solely at your own risk.







