📺 Watch the Full Video Analysis
This article was automatically generated by the NFC Market Live AI analysis system. (Updated: 2026-09-30 10:38 JST)
📄 Primary Source
Australian Bureau of Statistics
https://www.abs.gov.au/statistics/economy/price-indexes-and-inflation/consumer-price-index-australia/aug-2026
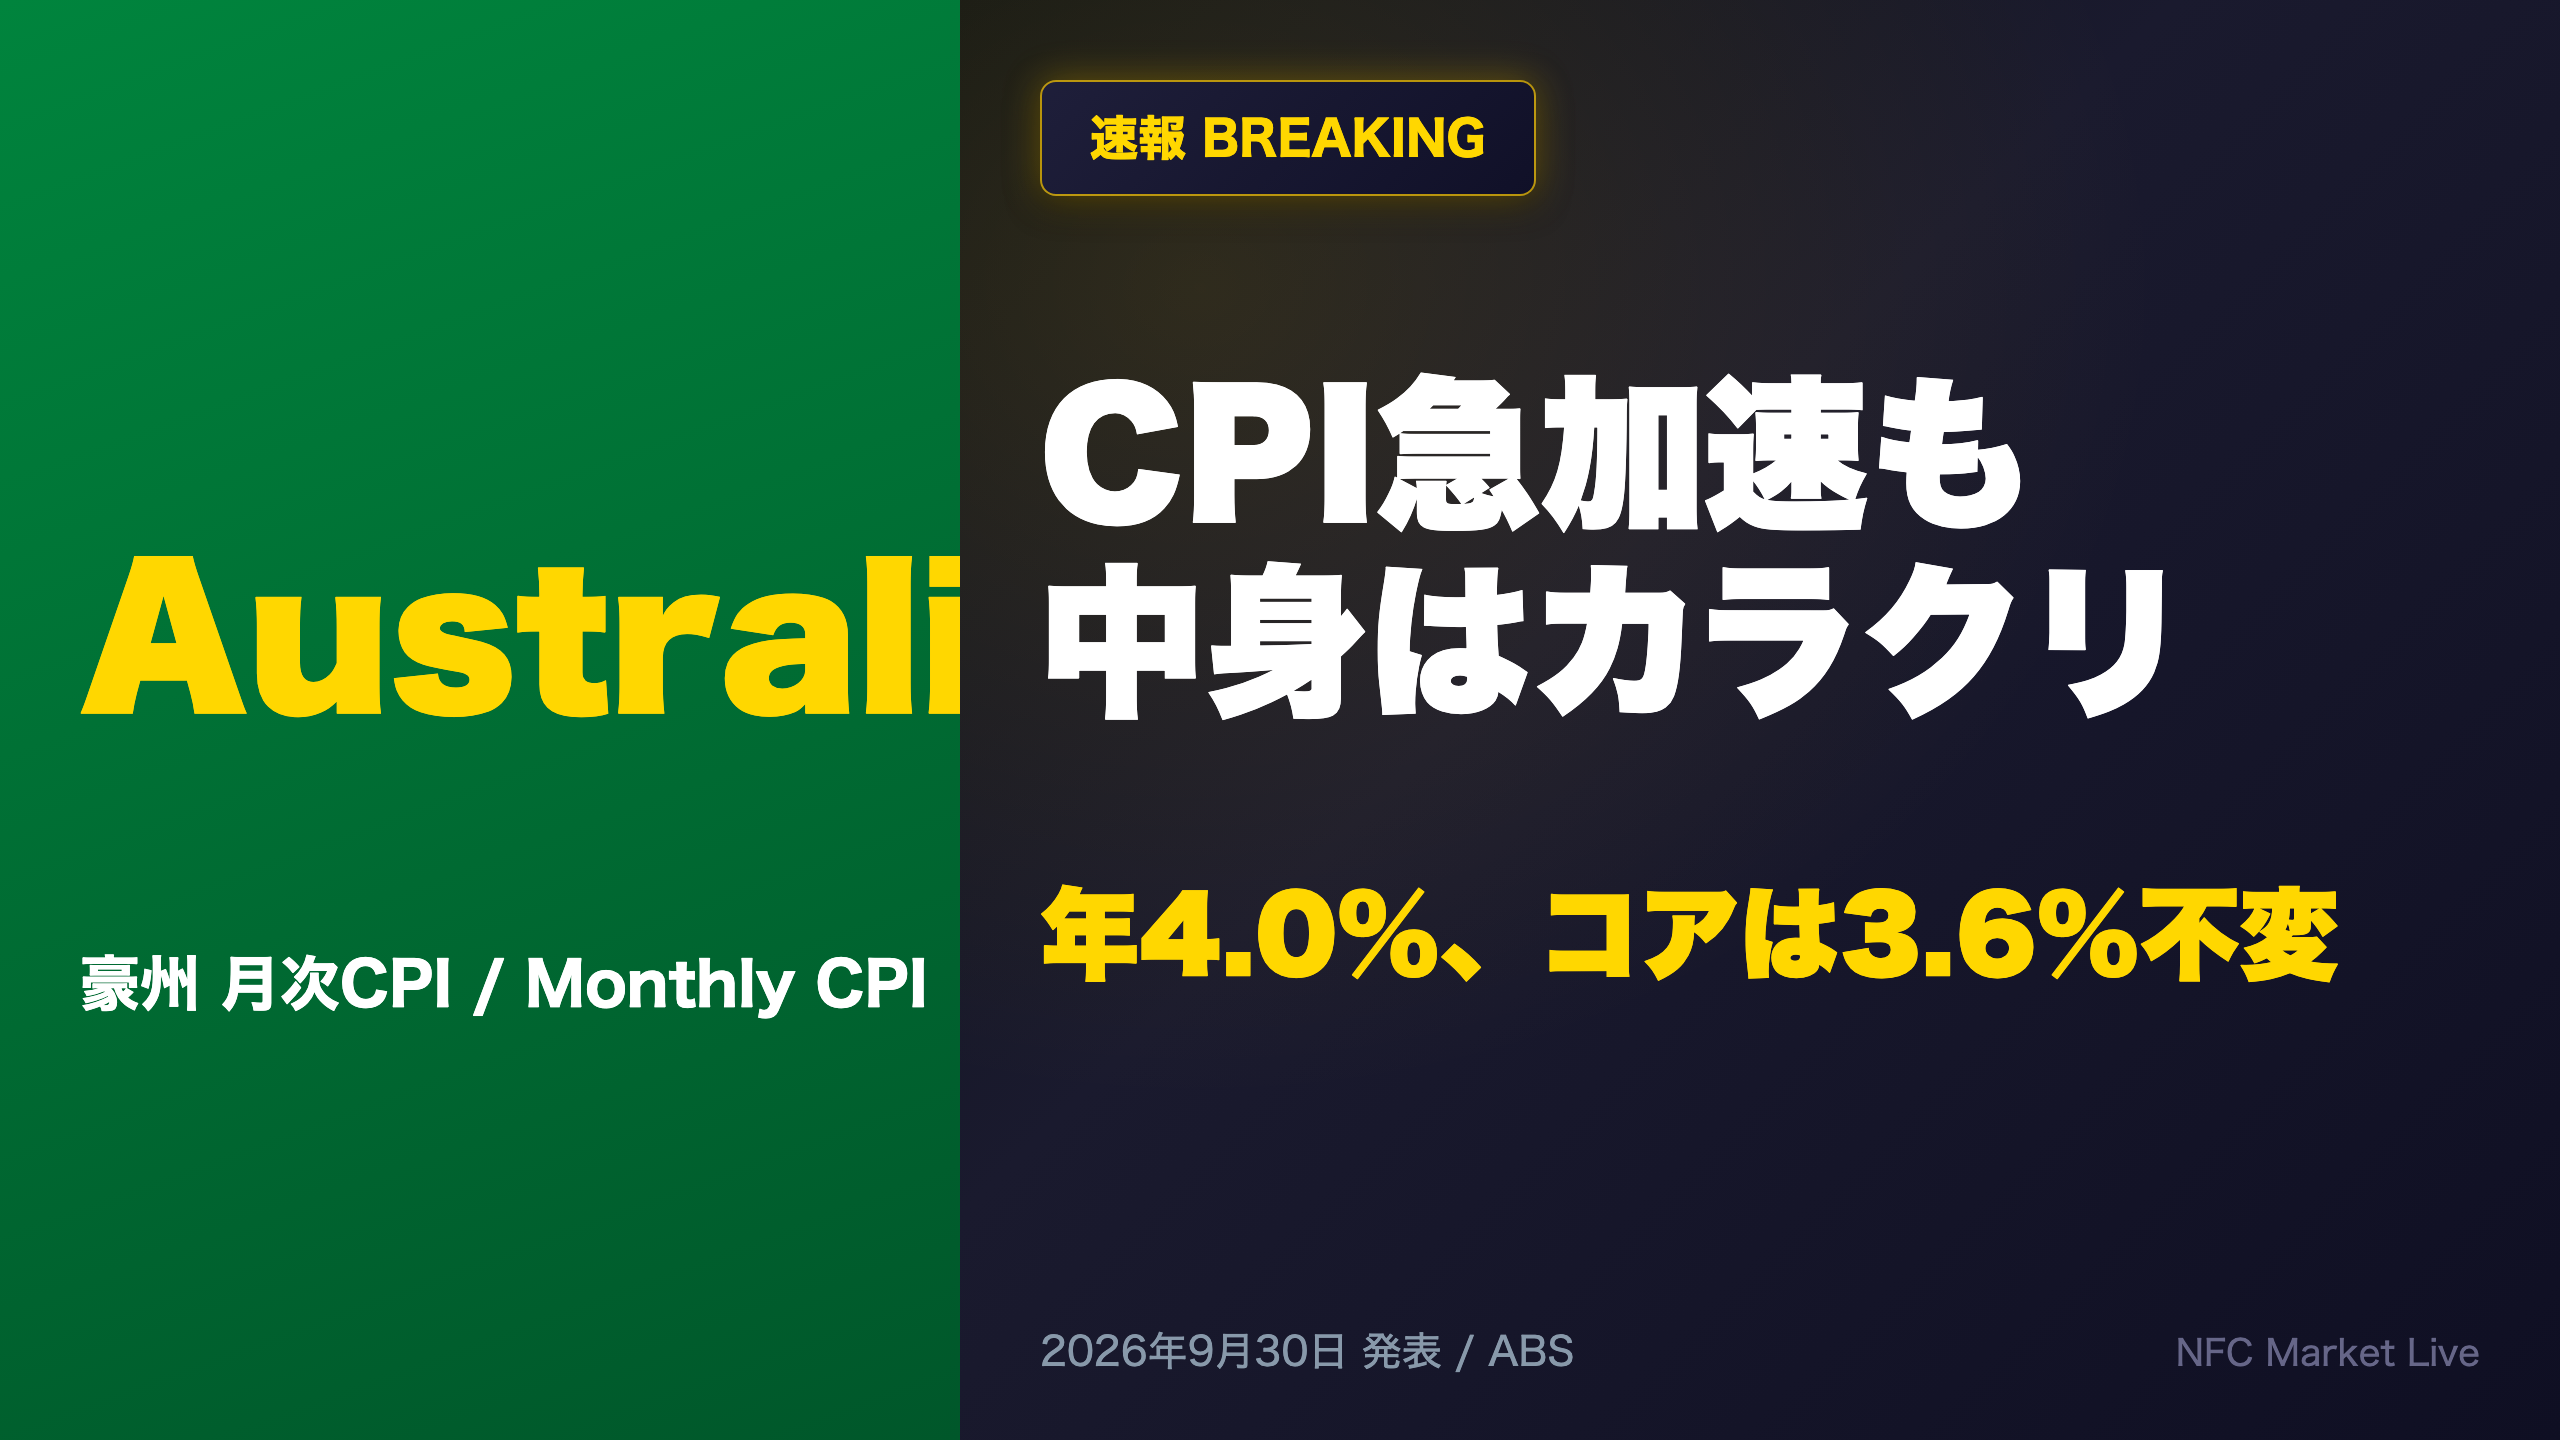
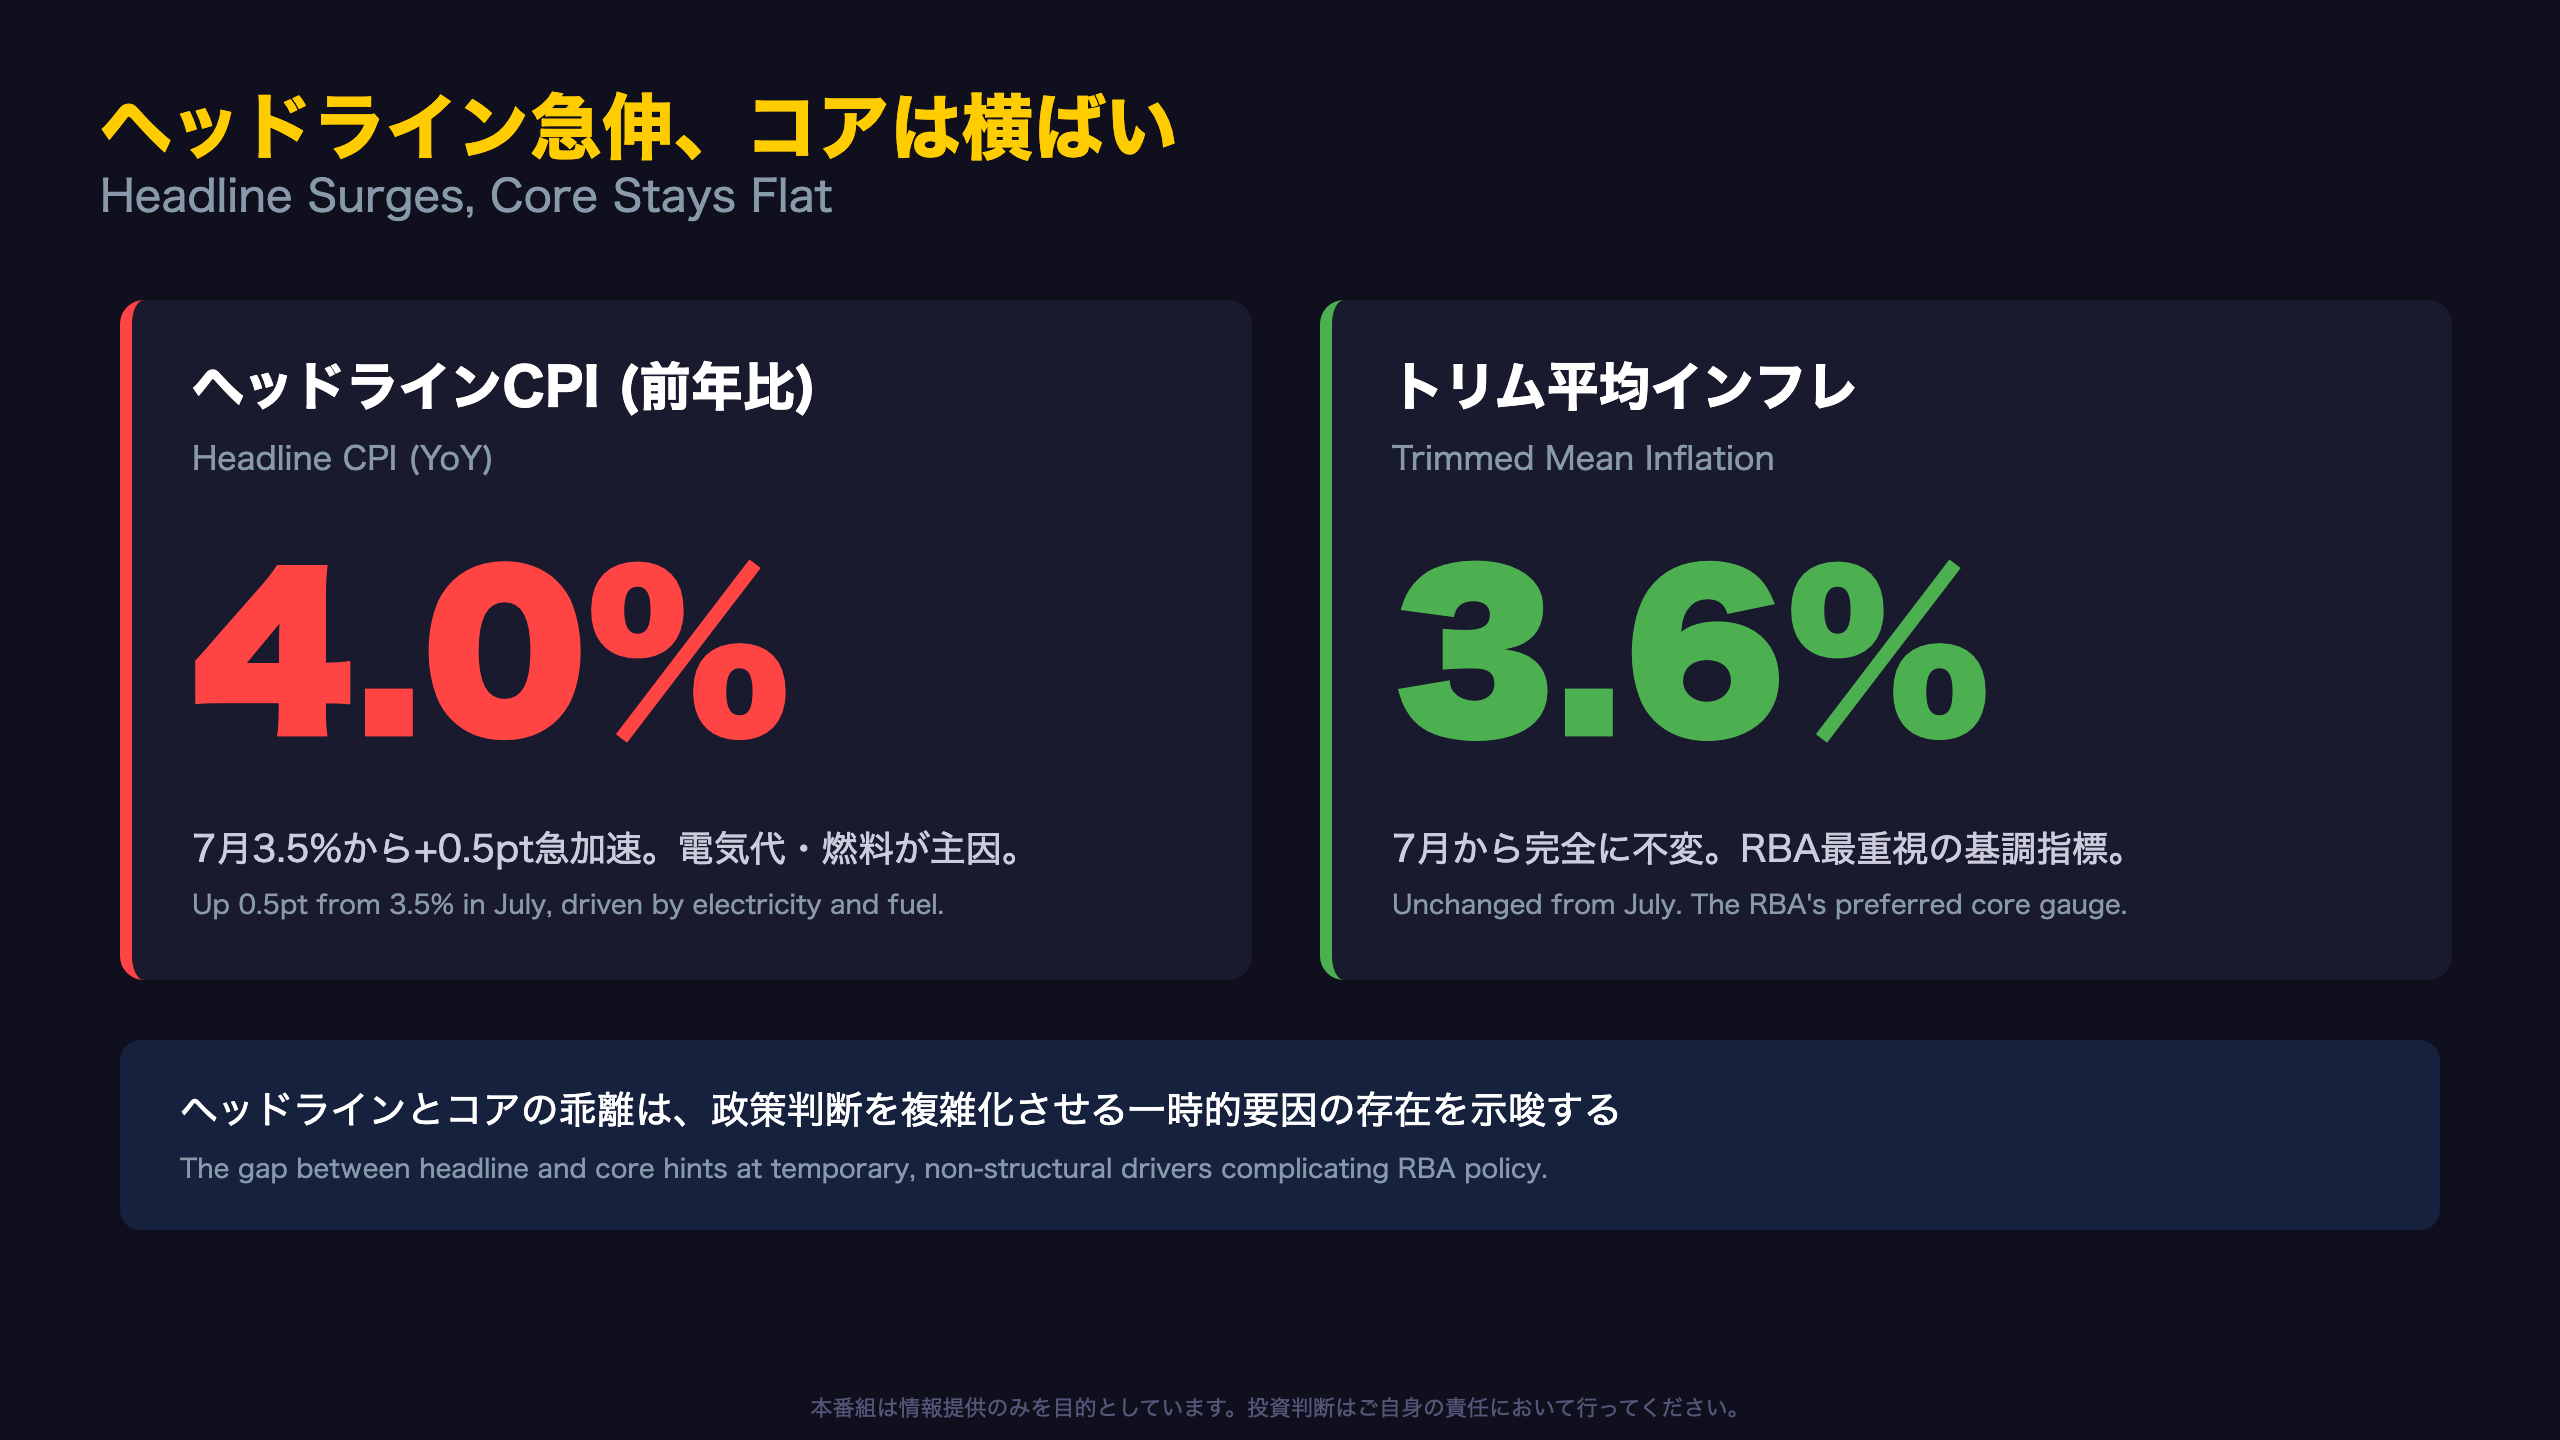
📊 Australia’s August CPI just landed. Headline inflation jumped from 3.5% to 4.0% year-on-year.
⚡ But the driver was temporary: electricity prices surged 13.2% YoY as rebates ended, and fuel prices spiked 13.5% as excise relief was unwound.
💡 The RBA’s preferred gauge, trimmed mean inflation, held steady at 3.6% for a second straight month — suggesting underlying price pressure barely moved.
⚠️ Still, non-discretionary inflation jumped from 3.7% to 4.7%, squeezing household budgets. Next release: October 28.
The Ultimate Summary:ヘッドライン急伸、コア横ばい
Headline vs. Core: A Widening Gap
Australia’s CPI peaked at 7.9% in December 2022 and cooled to around 2% by late 2024, only to re-accelerate through 2025-26, hitting 4.6% in March 2026. The pattern has been volatile month to month. August’s reading of 4.0% year-on-year, up 0.5 points from July’s 3.5%, is the latest swing in that pattern.
The ABS stated: “CPI rose 4.0% in the year to August 2026, up from 3.5% in the 12 months to July 2026.”
For context, U.S. and Eurozone readers should note the RBA (Reserve Bank of Australia) targets 2-3% inflation, similar to the Fed’s 2% PCE goal but expressed as a band rather than a point target. The RBA’s preferred core gauge — the trimmed mean, which strips out the most volatile price movements — held at 3.6%, unchanged from July and still above the target band.
That stability in the trimmed mean is the crucial signal: it suggests the headline jump reflects temporary, item-specific shocks rather than a broad-based re-acceleration of price pressure. Regional divergence adds nuance — Hobart (4.8%) and Adelaide (4.7%) ran hotter than Sydney (3.9%) and Melbourne (3.5%), hinting at localized housing and utility cost pressures rather than a uniform national trend. The next release lands October 28, with markets watching whether the trimmed mean holds at 3.6% or resumes climbing.
月次データの内訳:原数値と季節調整値
Reading Inflation Through Multiple Lenses
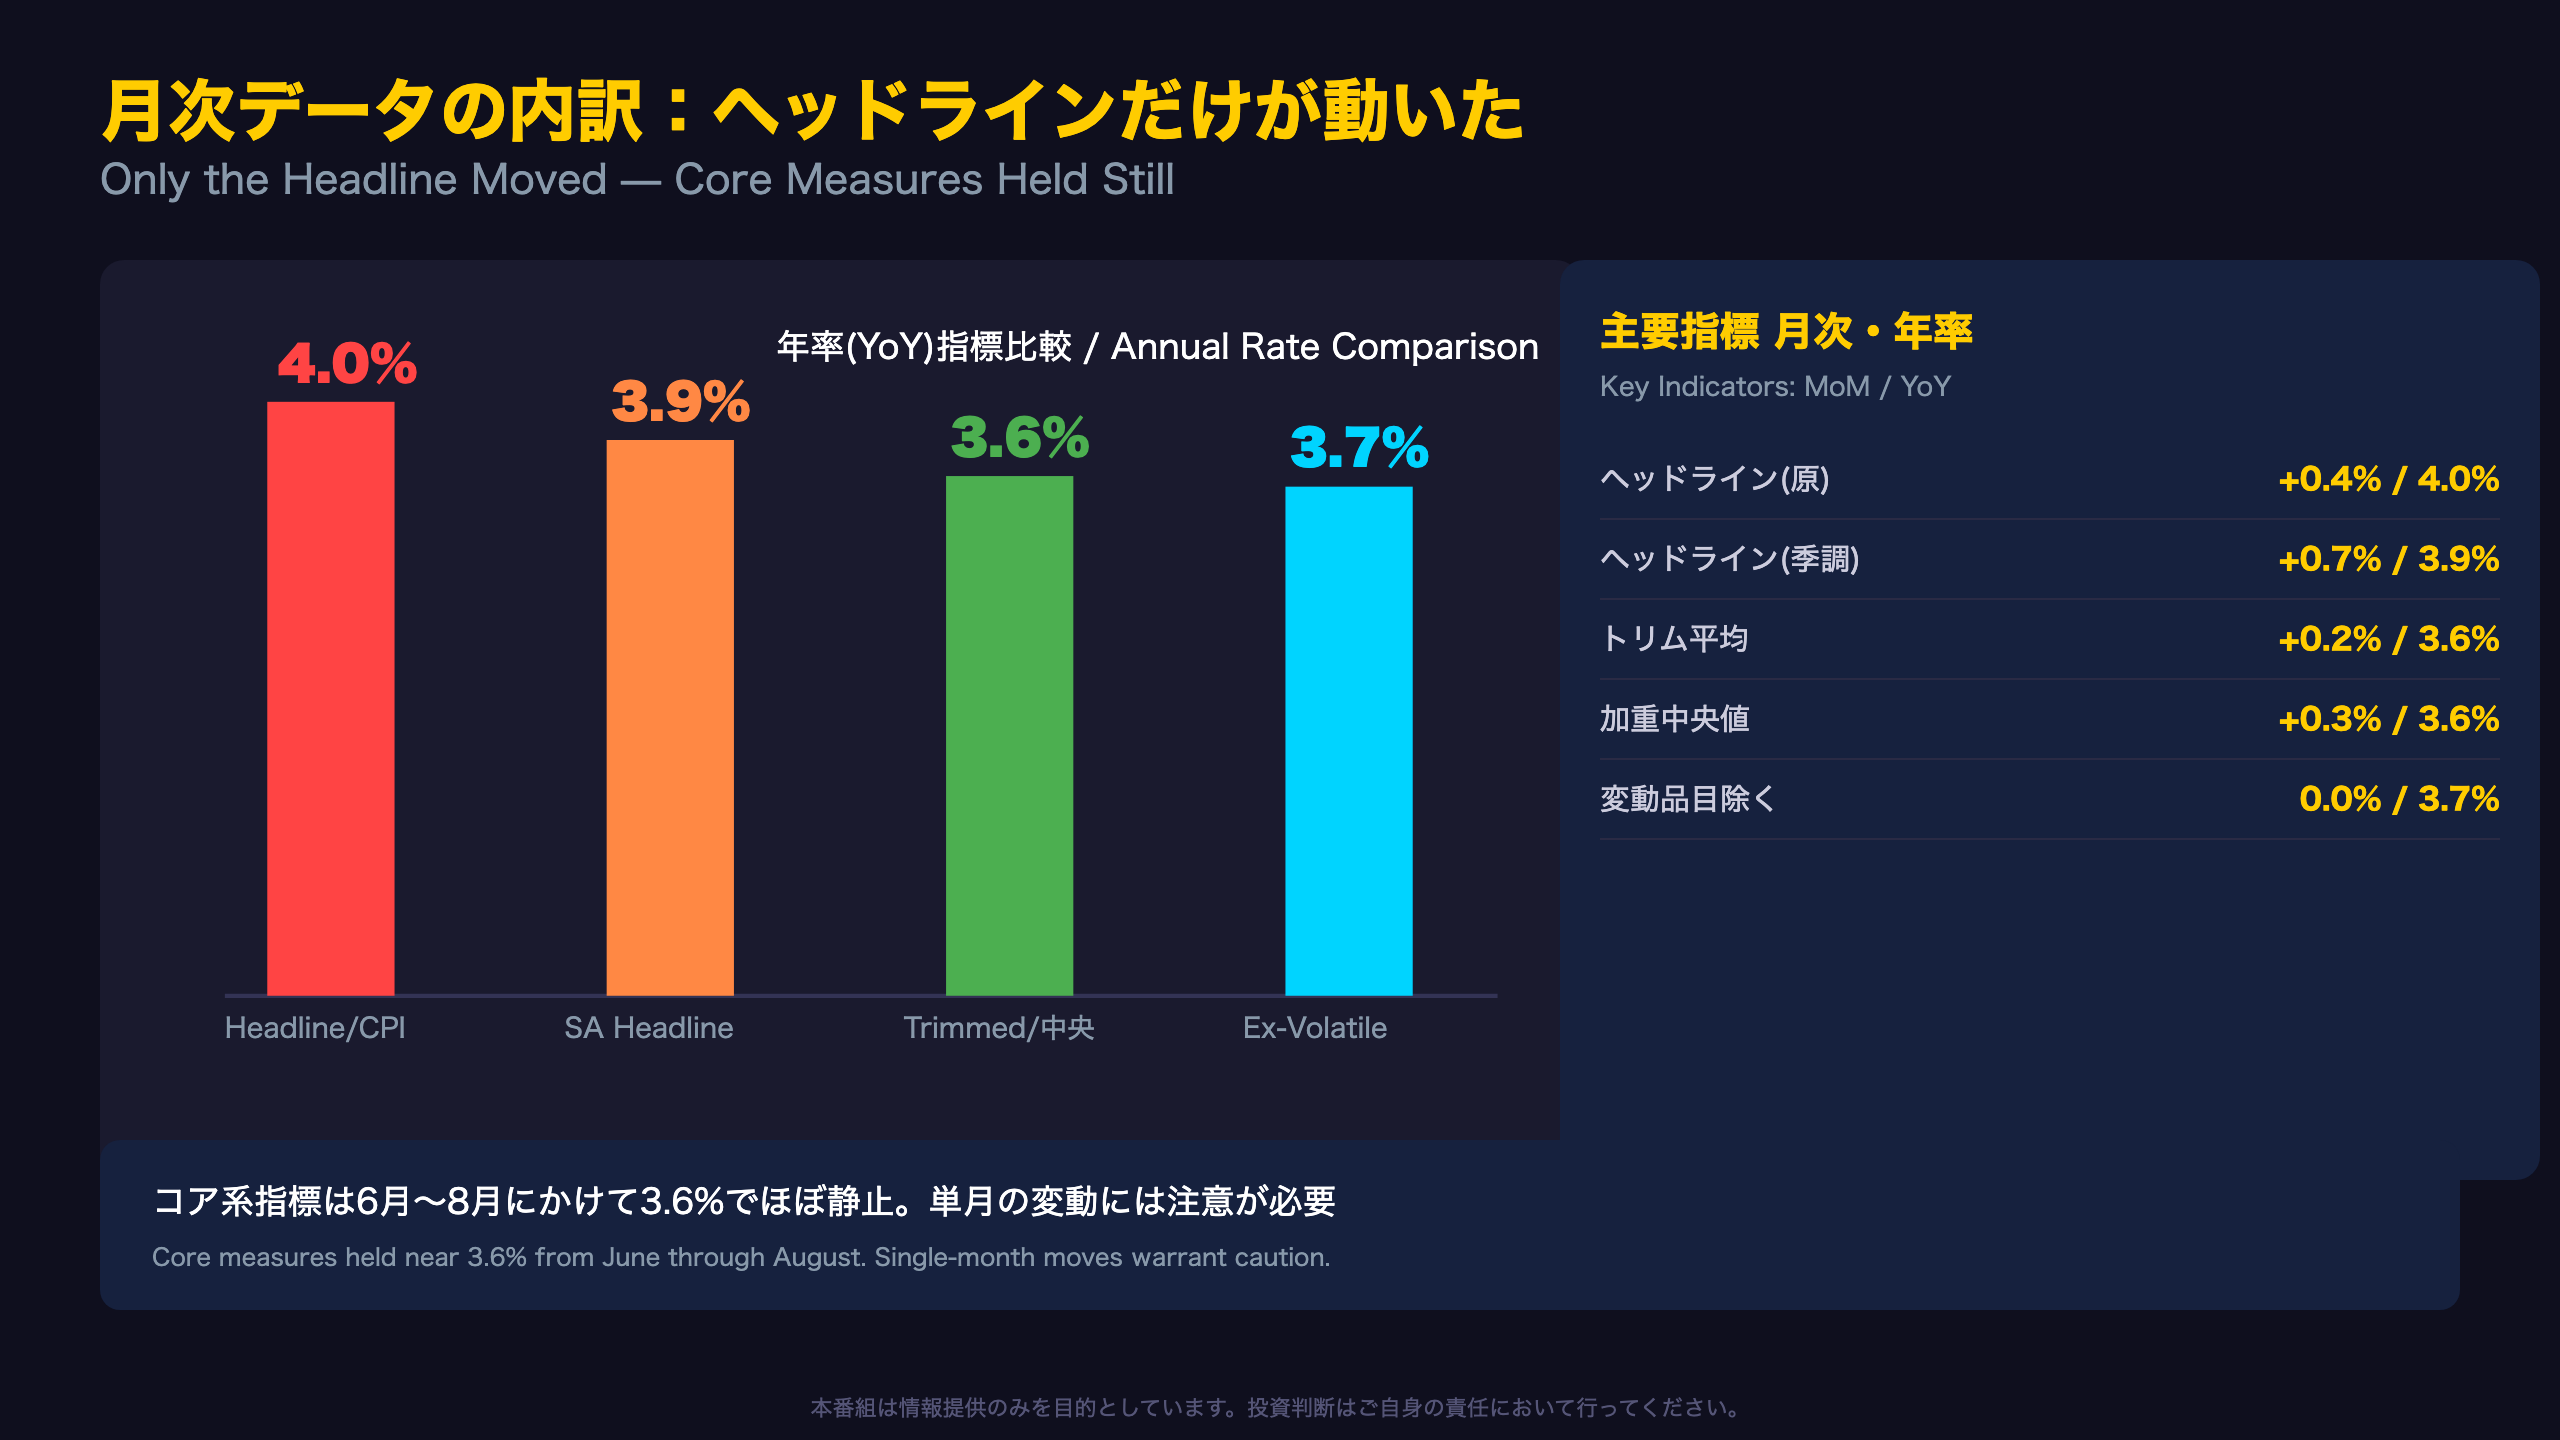
Unlike the U.S. CPI, which markets typically watch as a single headline print, the ABS (Australian Bureau of Statistics) publishes a suite of analytical series designed to separate signal from noise. This month’s key readings:
| Measure | MoM | YoY | Prior YoY |
|---|---|---|---|
| Headline CPI (original) | +0.4% | 4.0% | 3.5% |
| Headline CPI (seasonally adj.) | +0.7% | 3.9% | 3.5% |
| Trimmed mean | +0.2% | 3.6% | 3.6% |
| Weighted median | +0.3% | 3.6% | 3.6% |
| Ex-volatile items | 0.0% | 3.7% | 3.7% |
The table makes the divergence explicit: only the headline moved meaningfully in a single month, while every core measure was essentially frozen. The “ex-volatile items” series — which strips out fruit, vegetables, and fuel, similar in spirit to U.S. core CPI excluding food and energy — printed a flat 0.0% monthly change, reinforcing that underlying momentum hasn’t shifted.
Still, a seasonally adjusted +0.7% monthly print isn’t trivial in isolation; annualized, that alone would suggest inflation running near 8-9% if sustained. Investors should track the 3-month trend in the trimmed mean (3.6% → 3.6% → 3.6% over June-August) rather than react to single-month noise — a distinction analogous to how Fed watchers treat U.S. core PCE trends versus any one CPI print.
住宅グループ:電気代急騰のカラクリ
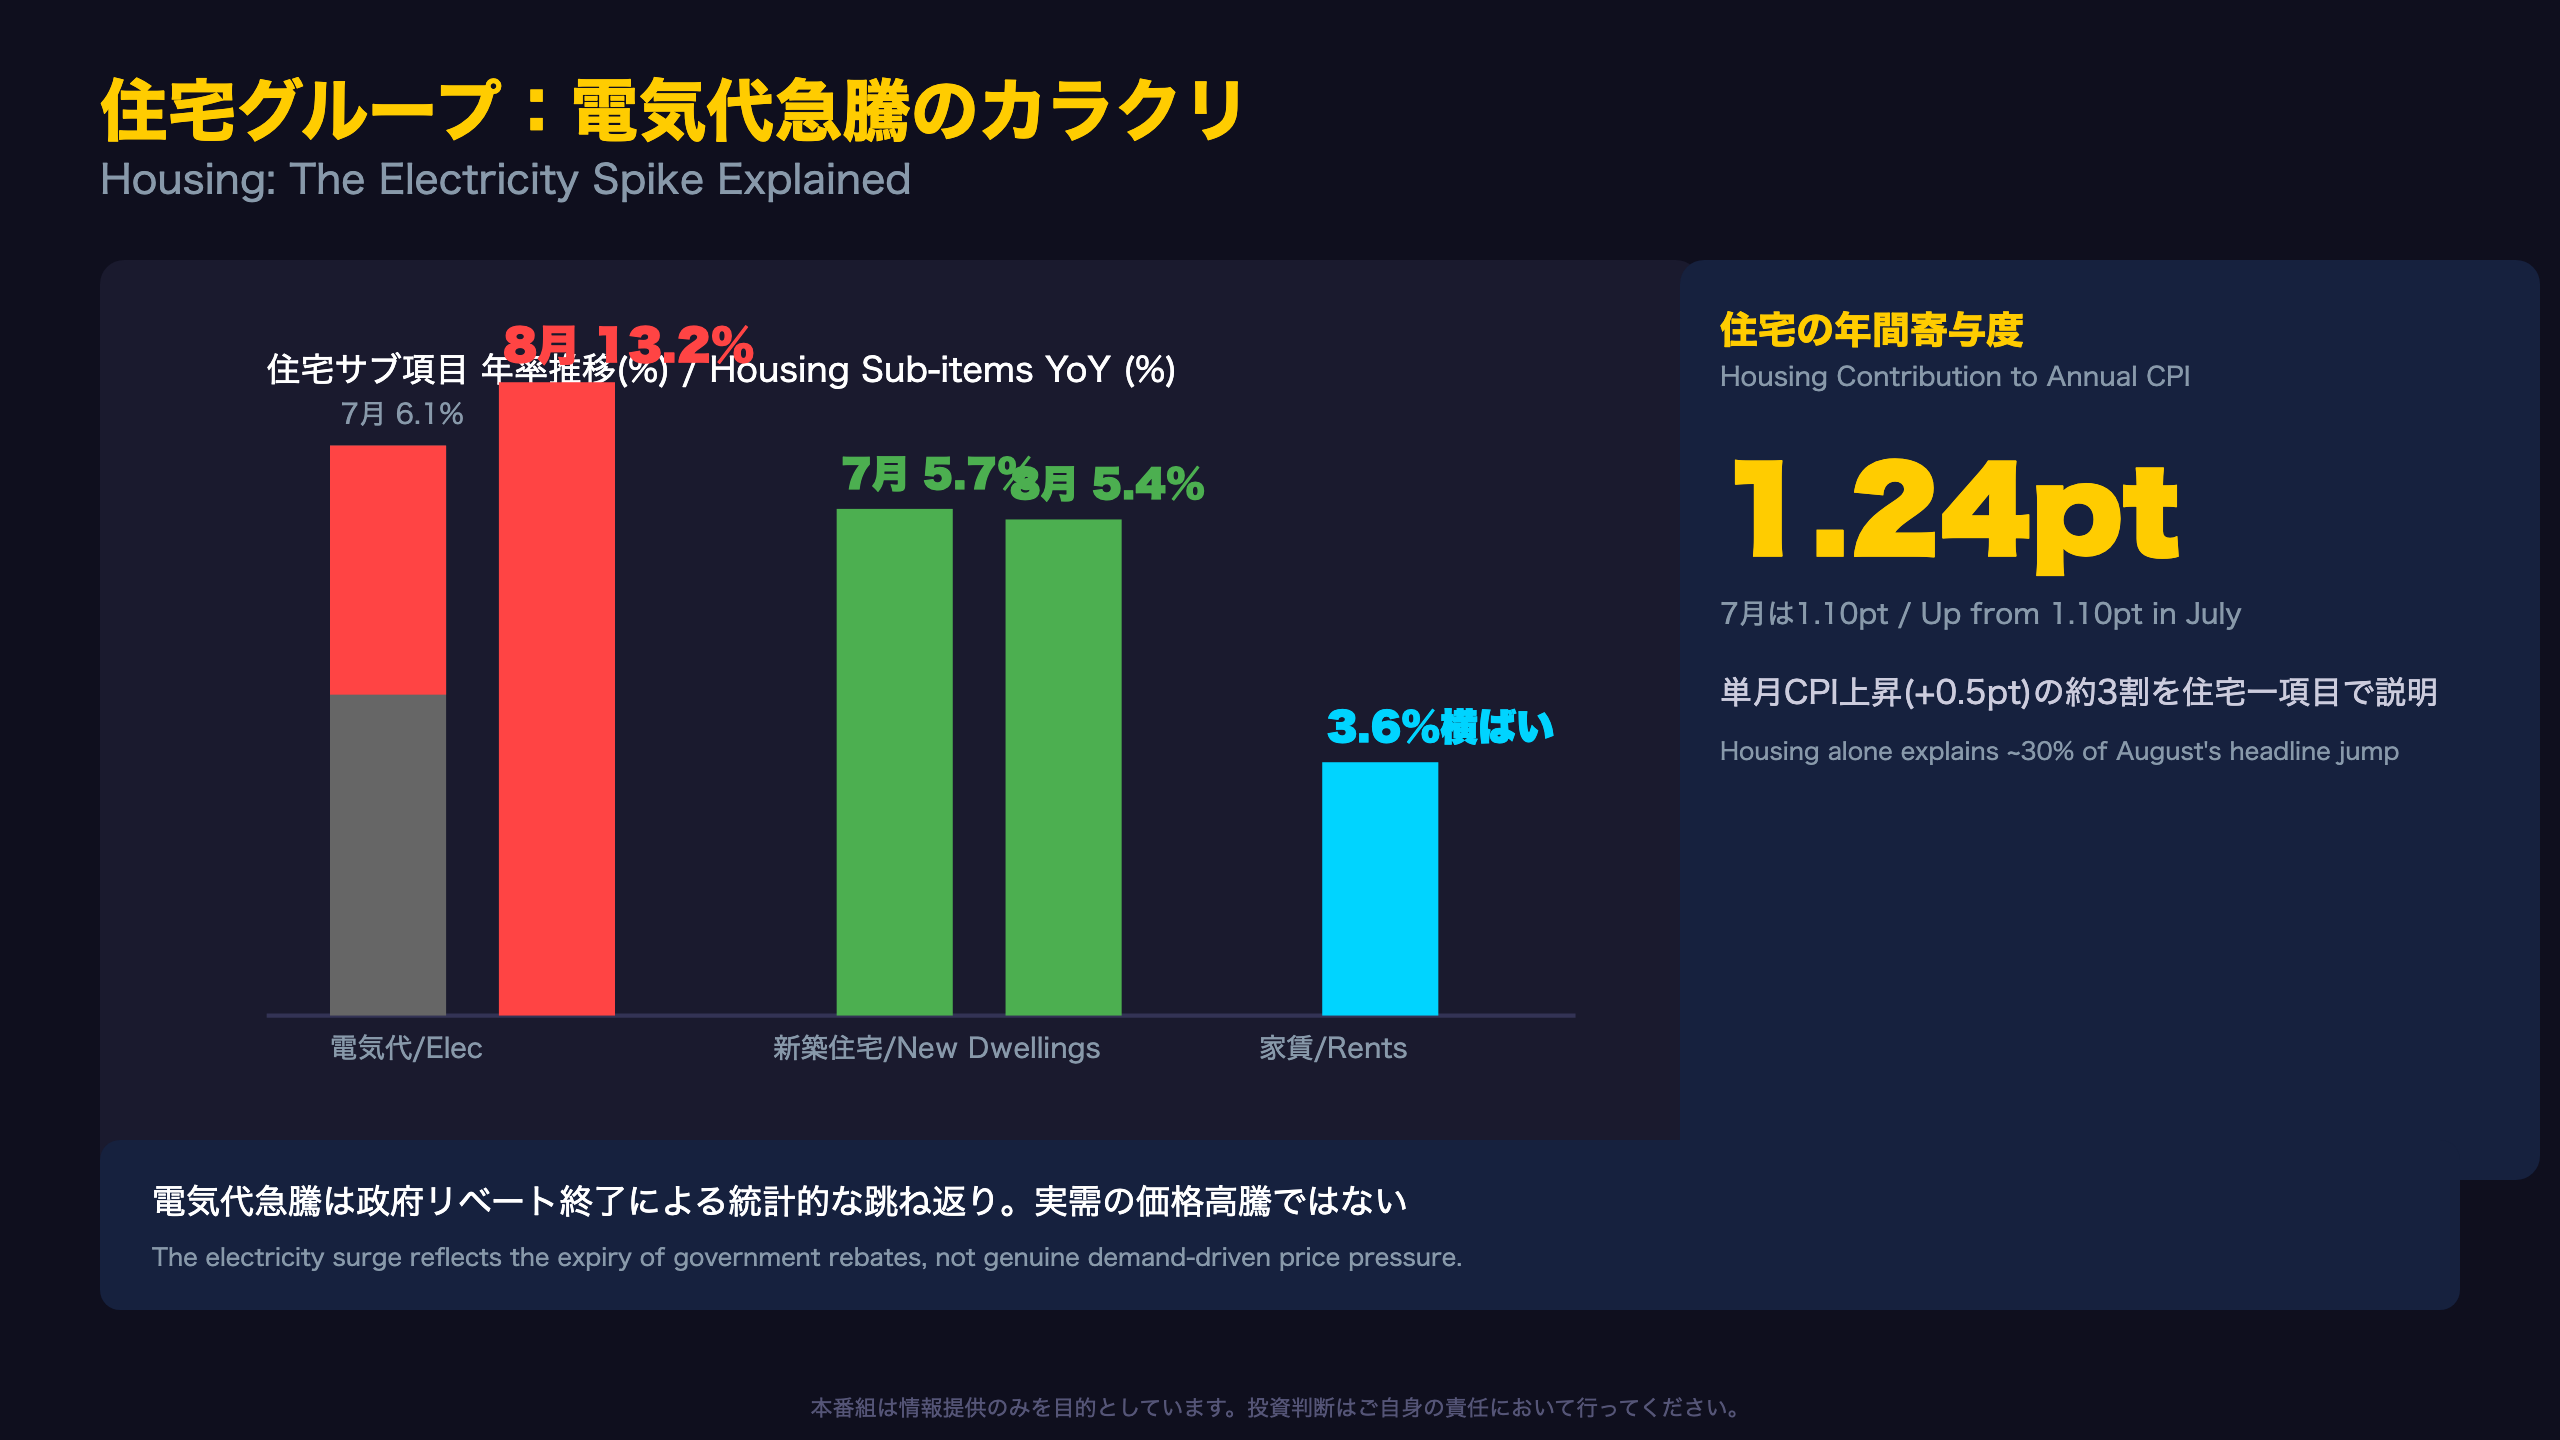
The Institutional Story Behind the Electricity Spike
A 13.2% annual rise in electricity costs sounds alarming in isolation, but the driver isn’t market-based demand pressure — it’s the unwind of government subsidy programs. Since 2023, Australia’s federal and state governments have run intermittent electricity rebate schemes for households. Due to the timing of 2025 rebate payments, the annual comparison spiked as high as 22.4% back in June 2026; August’s 13.2% still reflects a residual base-effect distortion from that program’s expiry.
As the ABS explained: “The annual rise of 13.2% in electricity costs is largely due to the ending of Commonwealth electricity rebates.”
For context, this mirrors how Japan’s energy subsidy rollback or various European energy relief program expirations have produced similar statistical “echo” spikes in CPI — a base-effect phenomenon distinct from genuine demand-driven inflation, and one that fades from the annual comparison within 12 months.
Meanwhile, new dwelling prices actually decelerated from 5.7% to 5.4%, hinting that builders’ pass-through of higher labor and materials costs may be losing momentum. Rents held flat at 3.6% for a third consecutive month — still elevated versus pre-pandemic norms but no longer accelerating, suggesting rental market tightness, while persistent, isn’t intensifying further.
Contribution data underscores housing’s outsized role: its share of annual CPI rose from 1.10 to 1.24 percentage points month-over-month, meaning housing alone explains roughly 30% of August’s total 0.5-point headline jump — a concentration risk investors should watch closely heading into the next print.
輸送グループ:燃料税巻き戻しの衝撃
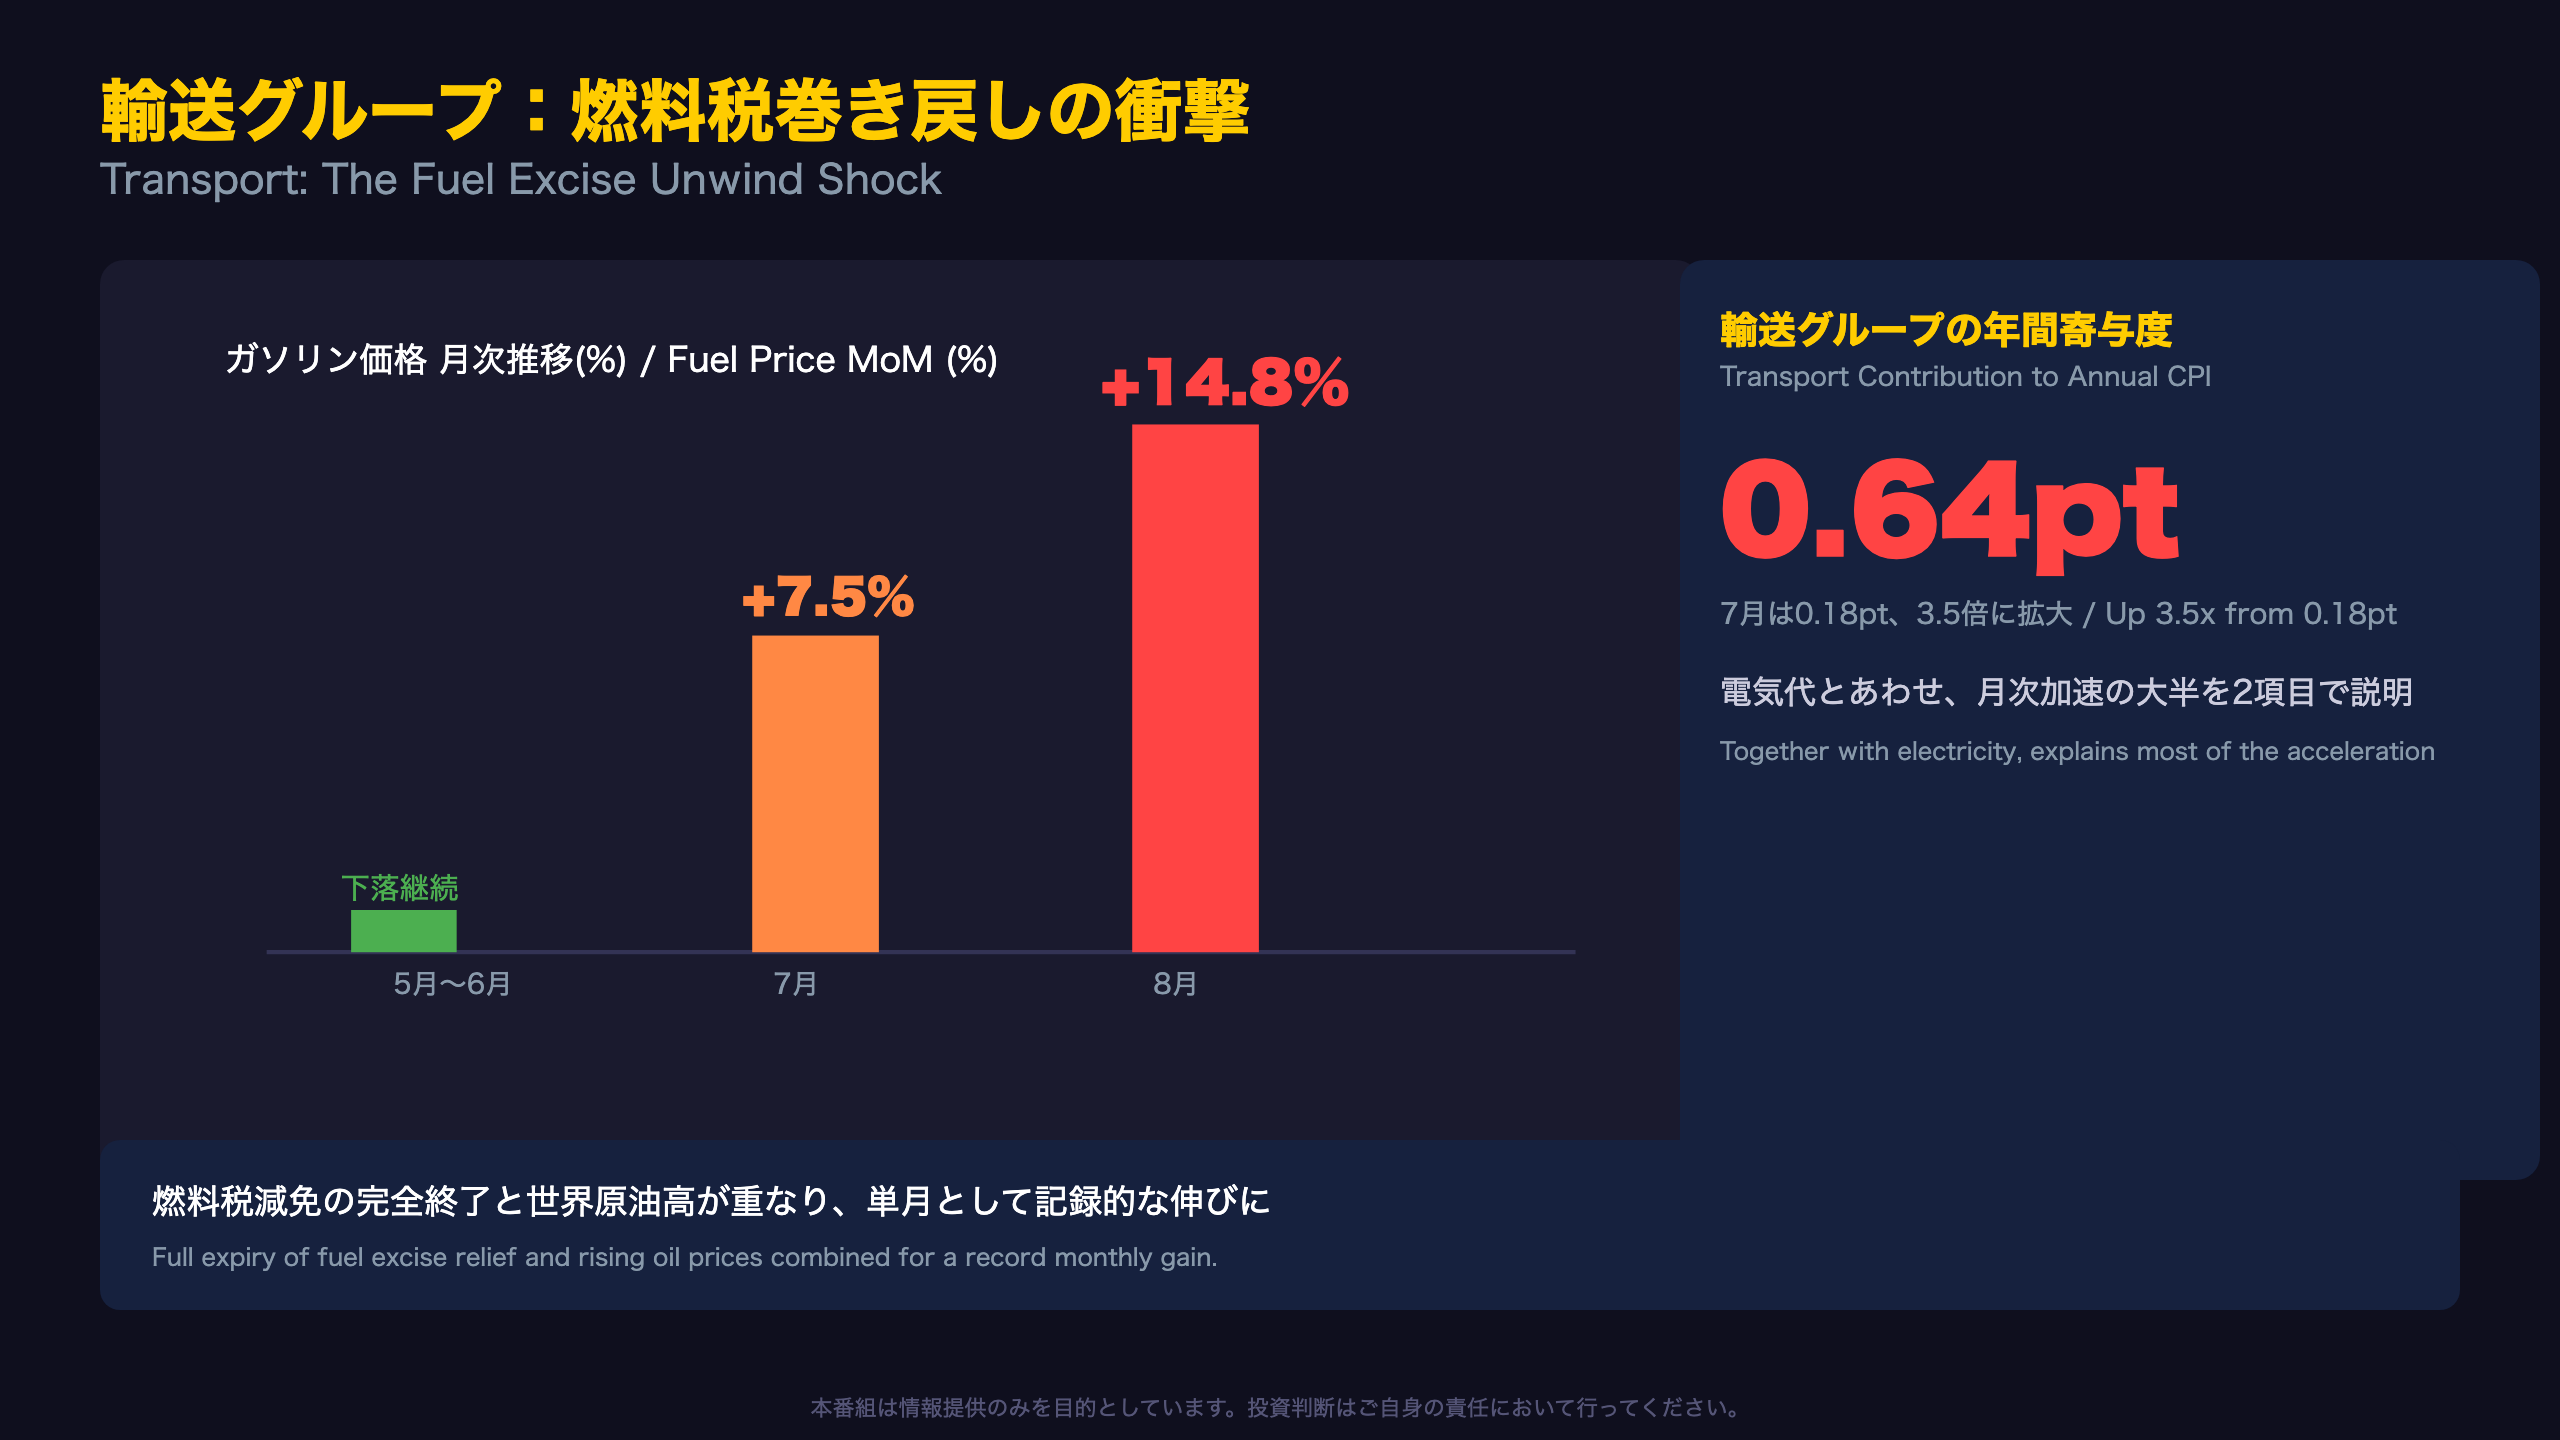
The Fuel Excise Unwind: A Timeline
Australia had implemented a phased reduction in its fuel excise (a federal fuel tax) relief measure starting in 2025, and that program was fully phased out by August 2026. As the ABS noted: “prices for Automotive fuel were up 14.8% in August 2026, driven by higher world oil prices and the unwinding of the remainder of the federal government’s fuel excise relief measures” — a record monthly increase for the series.
For context, this functions similarly to how a temporary U.S. federal or state gas tax holiday would cause CPI energy components to spike sharply once it expires — a mechanical, policy-timed distortion rather than an organic demand shock. July had already posted a 7.5% monthly rise (reversing three straight months of declines), meaning transport costs were pushed up by policy factors over two consecutive months.
As a result, transport’s contribution to annual CPI ballooned from 0.18 percentage points in July to 0.64 in August — a 3.5x jump. Combined with electricity’s expanded contribution (+0.14pt), these two categories alone account for +0.59 points of the total +0.5 point headline acceleration — meaning almost the entirety of August’s CPI surprise traces back to just two line items.
Notably, Games, toys and hobbies (+12.7%) also reflected semiconductor and memory component price pass-through, showing some genuine global supply-chain inflation exists beyond the policy-driven categories.
Since the fuel excise base effect rolls off the annual comparison from September onward, transport’s year-on-year growth rate is likely to moderate in the coming releases — a key variable for the RBA’s October assessment.
家計負担と政策インプリケーション
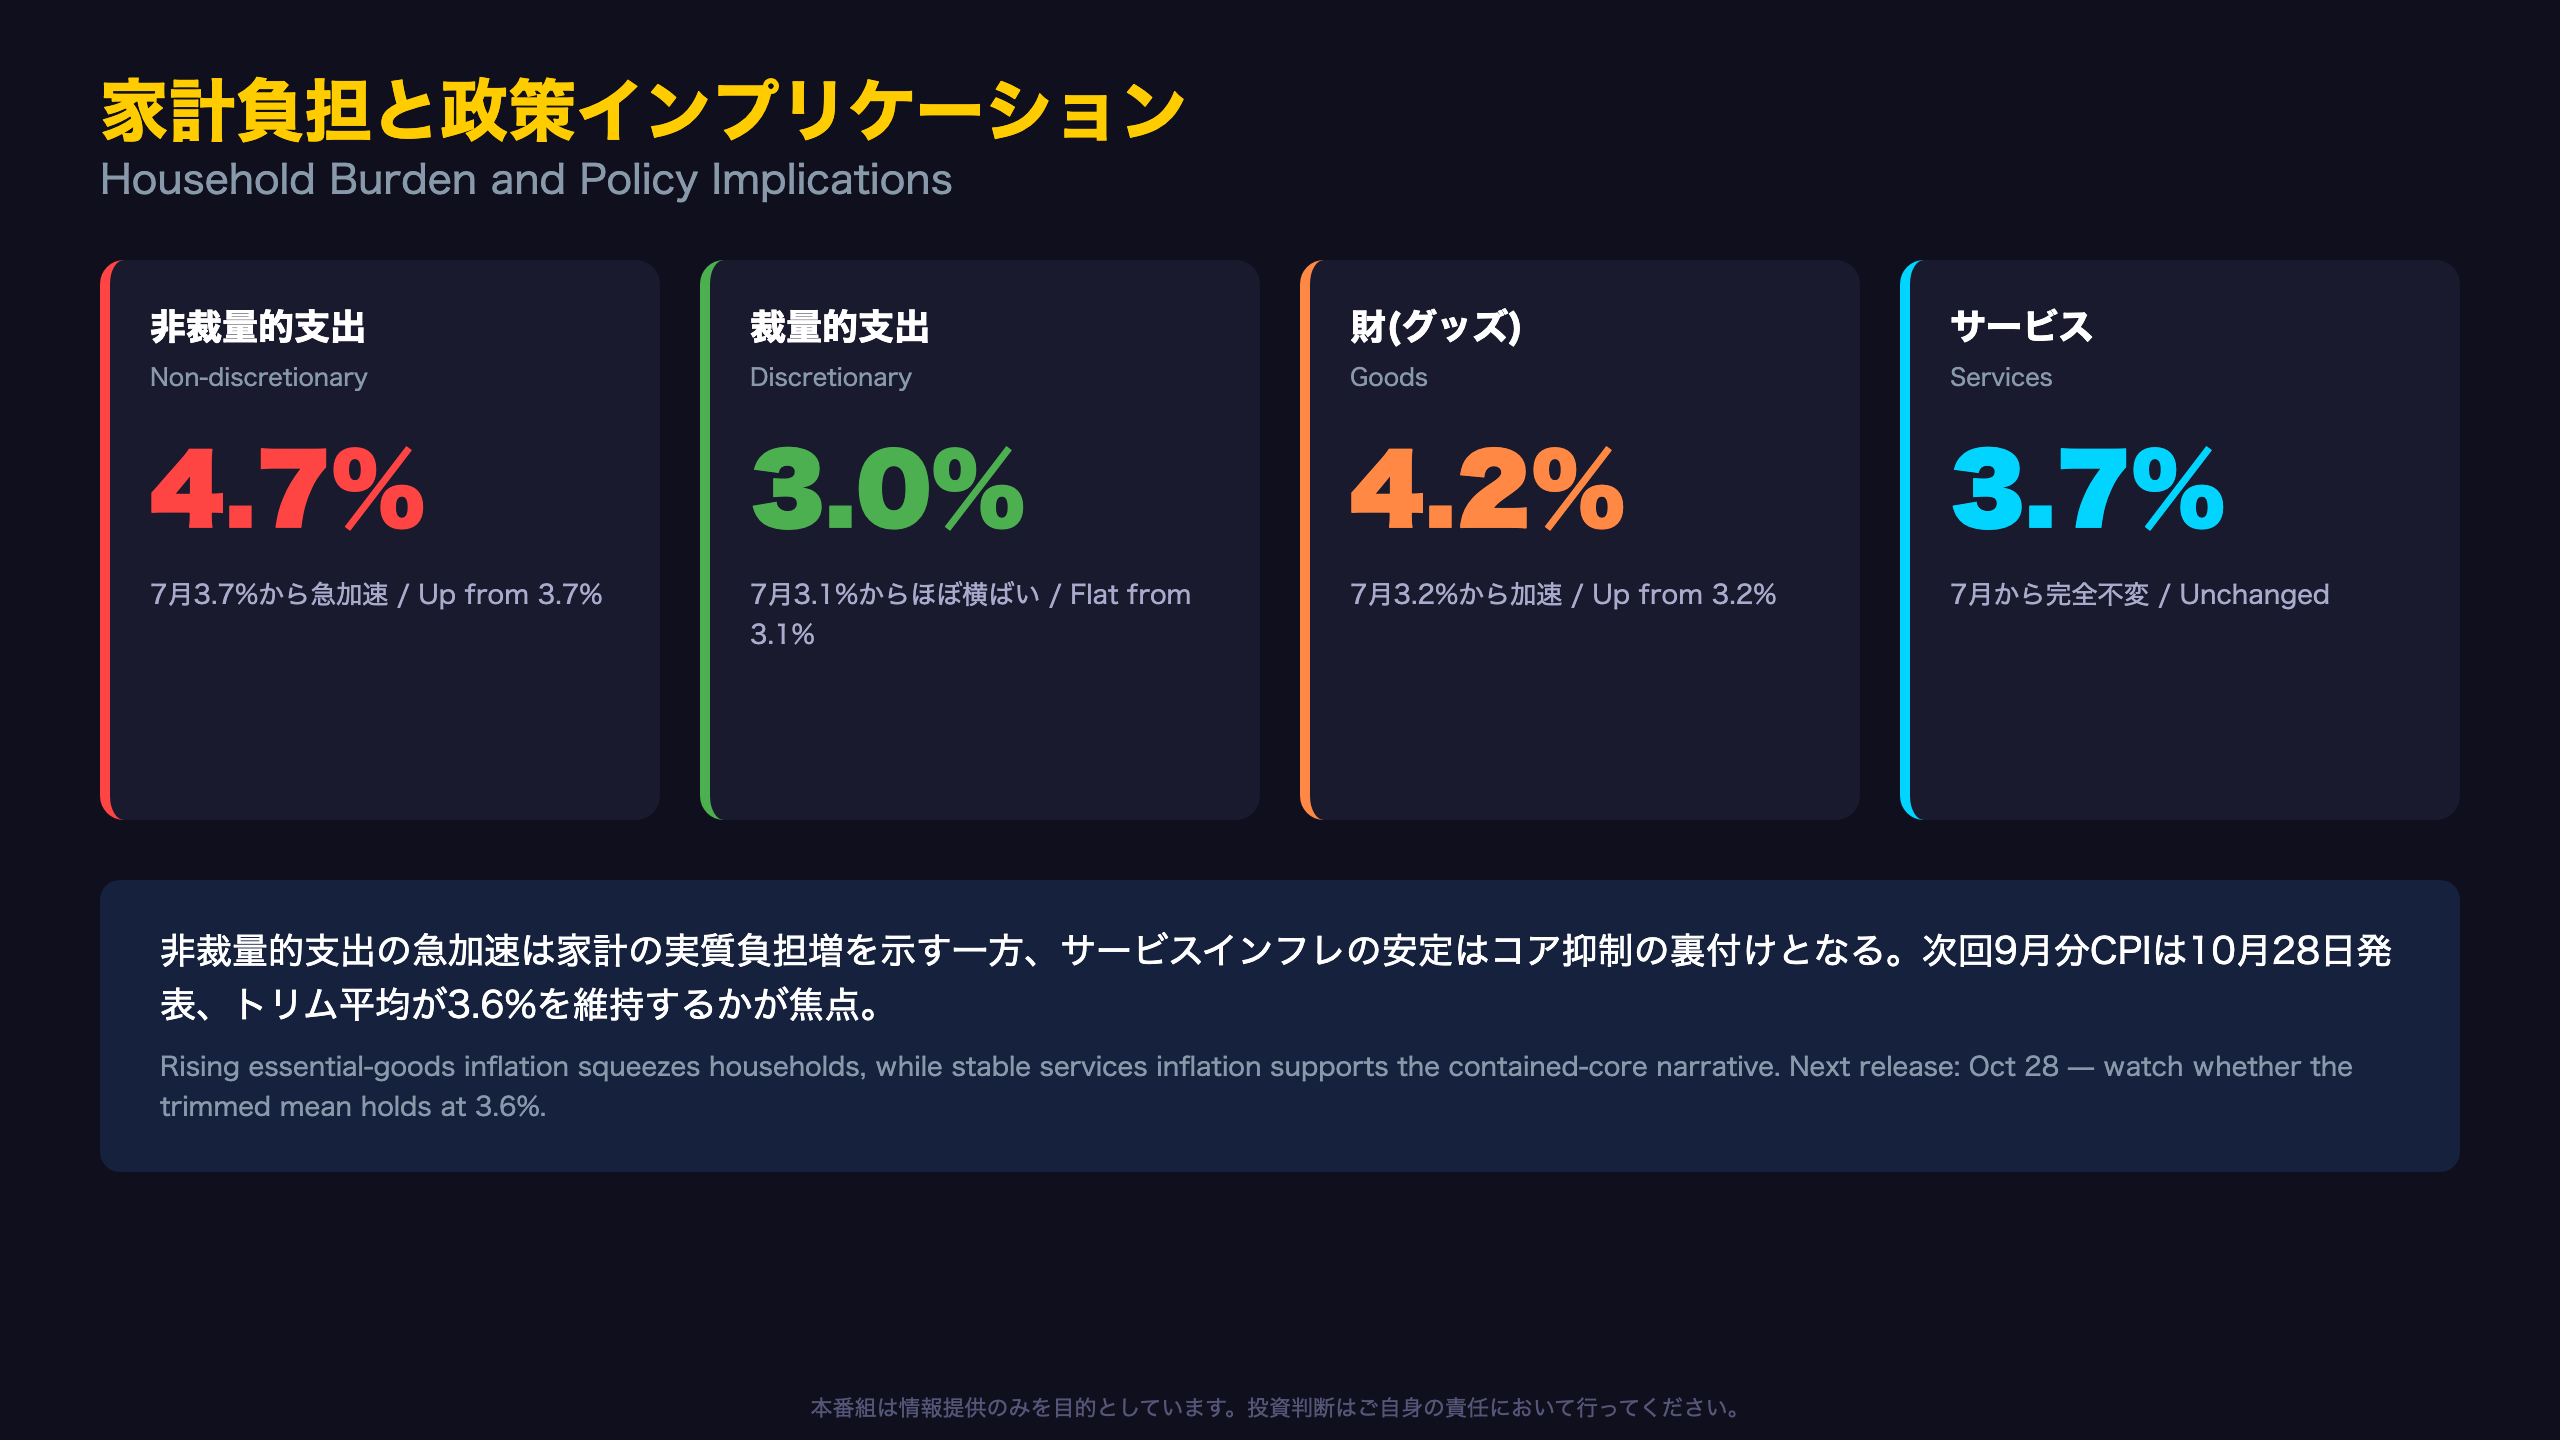
The Goods-vs-Services, Essential-vs-Discretionary Split
One of the most telling cuts of this data is by spending category:
| Category | Aug YoY | Jul YoY | Change |
|---|---|---|---|
| Non-discretionary | 4.7% | 3.7% | +1.0pt |
| Discretionary | 3.0% | 3.1% | -0.1pt |
| Goods | 4.2% | 3.2% | +1.0pt |
| Services | 3.7% | 3.7% | 0.0pt |
Non-discretionary inflation — spending households can’t easily avoid, like housing, food, utilities, and insurance — jumped to 4.7%, while discretionary spending on entertainment and clothing actually cooled slightly to 3.0%. This split matters for consumer sentiment: households are feeling squeezed on unavoidable costs even as “nice-to-have” spending inflation eases, a dynamic that could weigh on discretionary retail demand in coming quarters.
Goods inflation’s jump to 4.2% is a direct mechanical reflection of the fuel and electricity price shocks, both classified as goods in the CPI basket. Critically, services inflation — which tends to track wage growth more closely and is generally viewed by central banks (including the Fed and ECB) as the stickier, more persistent inflation component — held flat at 3.7%. That stability, alongside the frozen trimmed mean, supports the case that underlying, wage-driven inflation pressure hasn’t intensified.
For the RBA’s policy calculus, stable services inflation combined with an unchanged trimmed mean provides a reasonable basis to argue that core inflation remains under control, even as the headline print alarms at first glance.
The next CPI release is scheduled for October 28, 2026. Two things to watch: whether the headline pulls back as the electricity and fuel base effects roll off the annual comparison, and whether the trimmed mean holds at 3.6% or begins climbing again — the latter would be the more consequential signal for RBA policy.
Disclaimer: This article is for informational purposes only. All investment decisions are made solely at your own risk.