📺 Watch the Full Video Analysis
This article was automatically generated by the NFC Market Live AI analysis system. (Updated: 2026-09-28 07:09 JST)
📊 A full breakdown of global bond market data as of September 28, 2026.
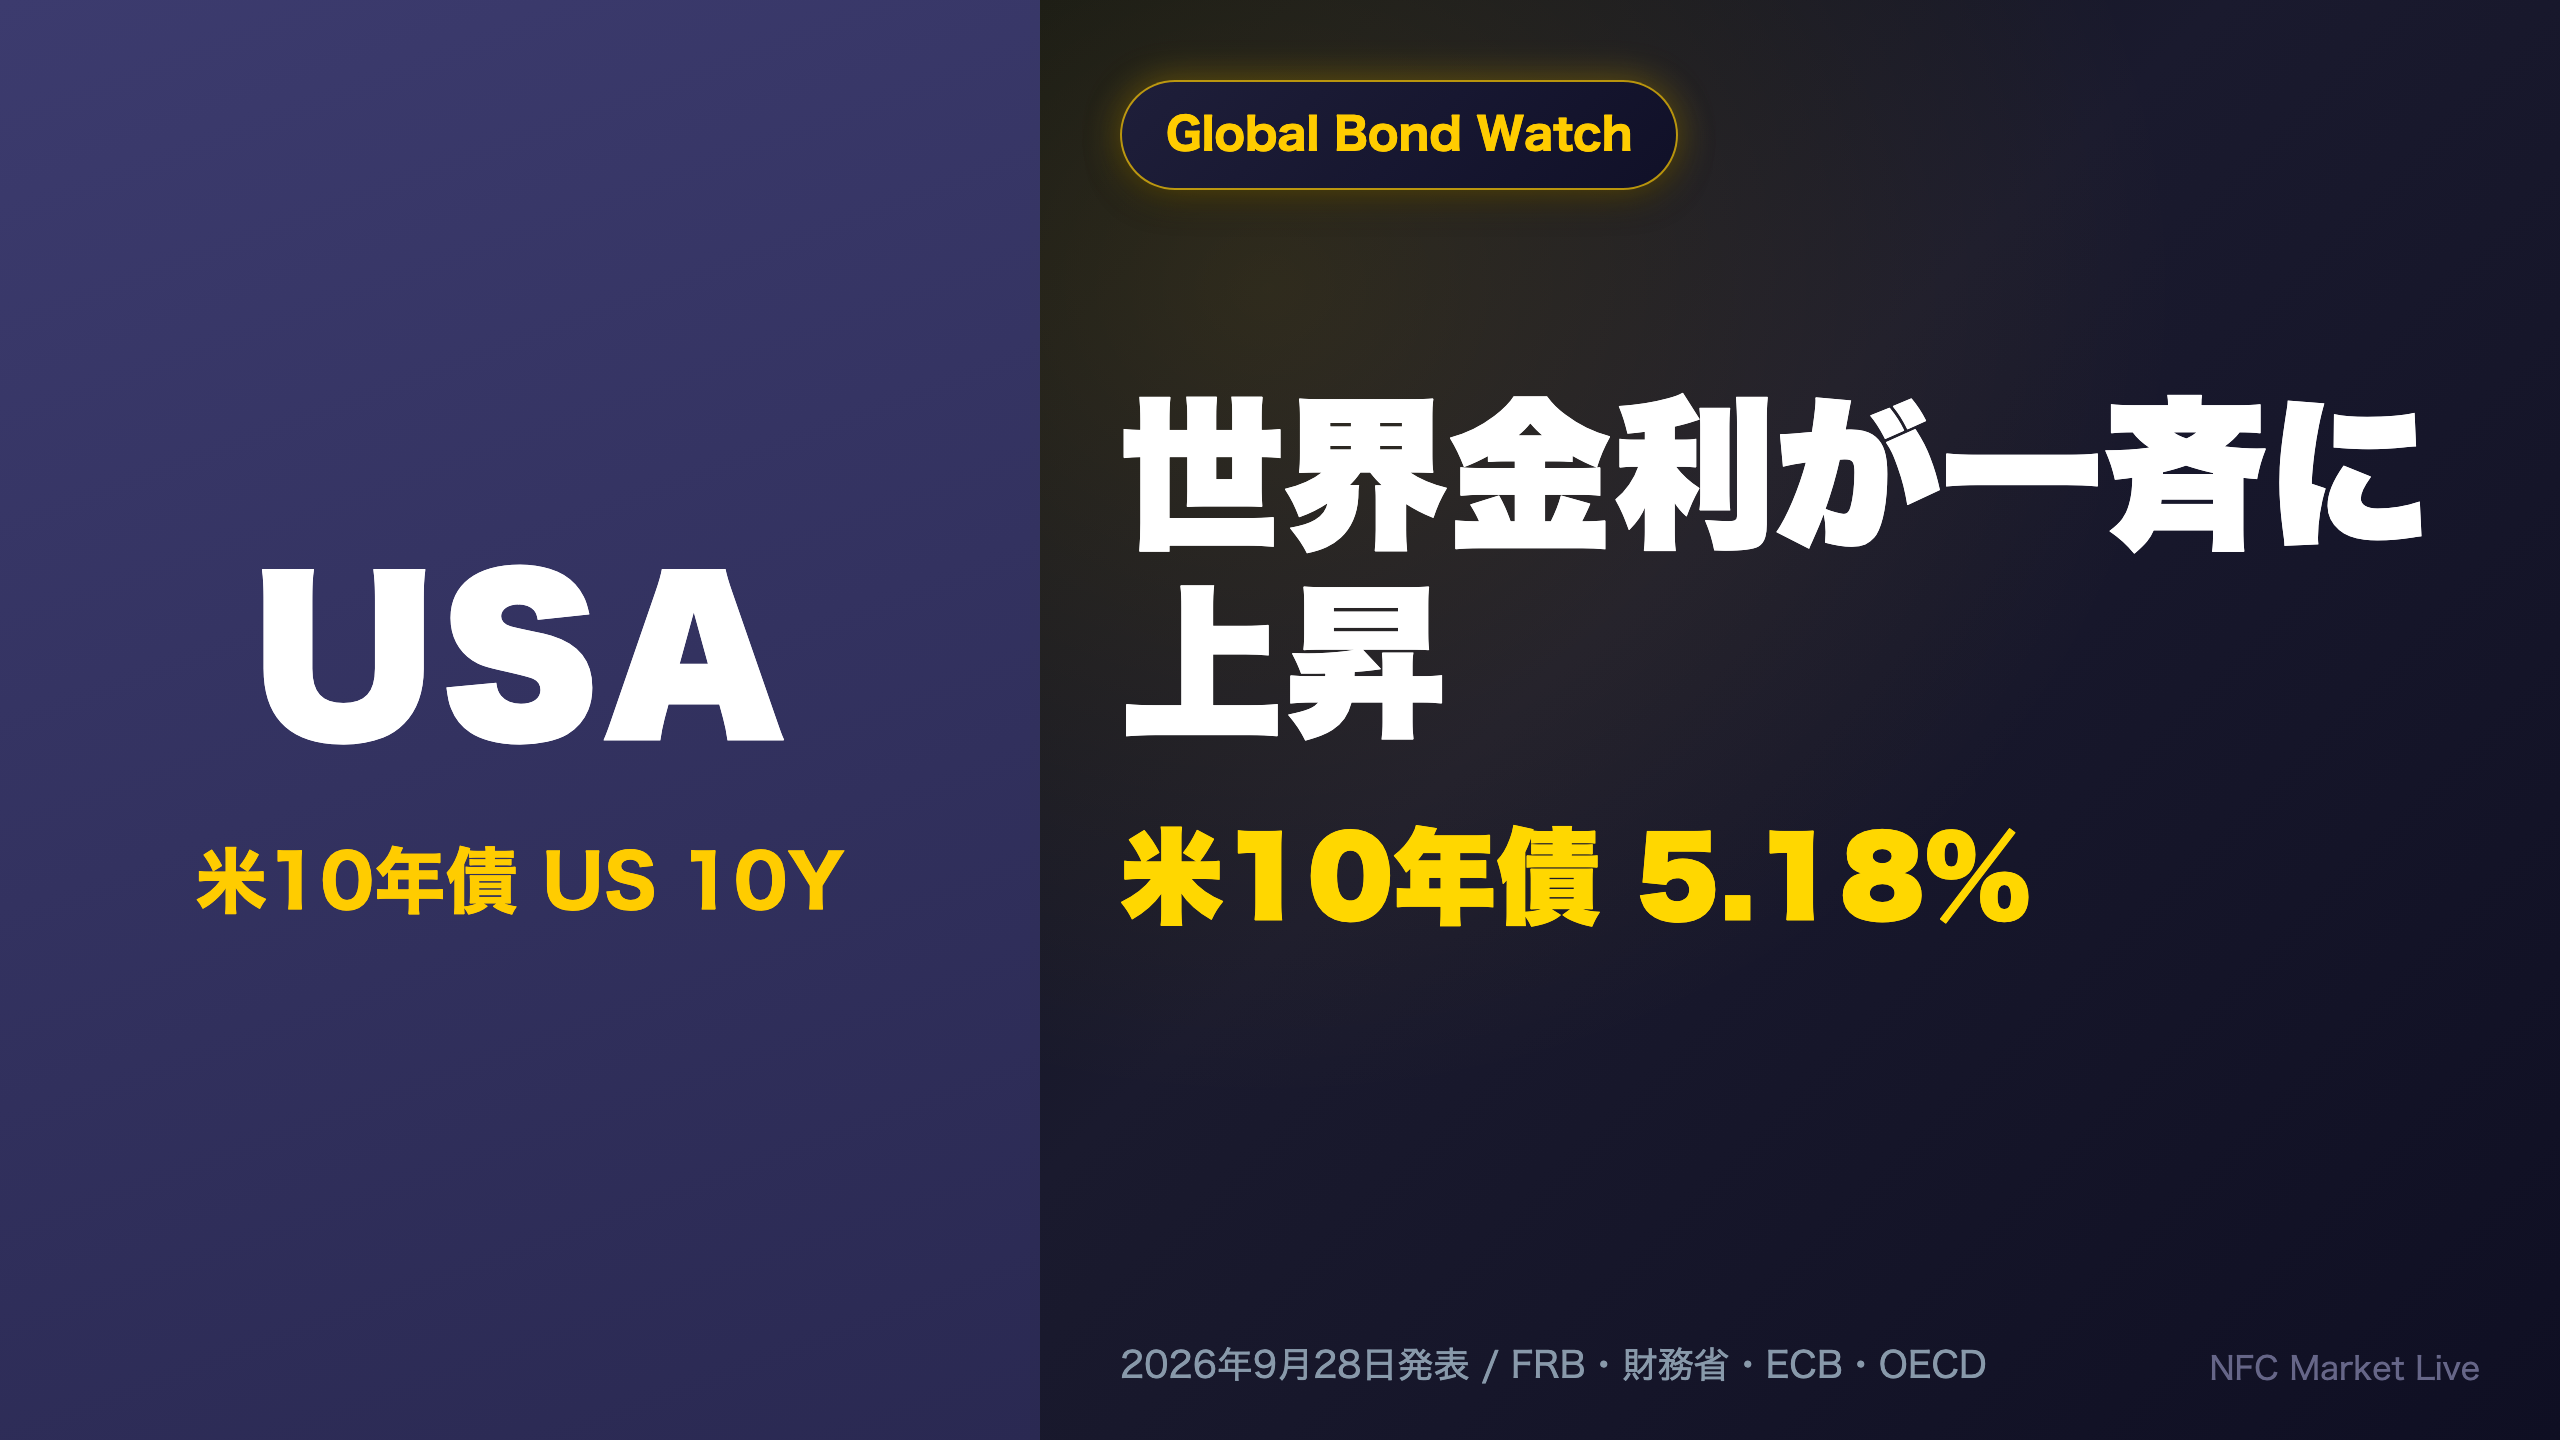
The US 10-year Treasury yield surged to 5.18%, gaining +0.24pp over five sessions — the largest move among major sovereigns. The US 2s10s spread widened to +0.31pp, confirming continued curve steepening.
📈 Meanwhile, German Bunds, UK Gilts, and Japanese JGBs showed no fresh update versus the prior release — a quiet week for European and Japanese benchmarks.
💡 Japan’s JGB auctions revealed a split picture: strong improvement at the 10-year point, but widening tails at the 30-year and 5-year points.
⚠️ All NFC HMM regime models remained unchanged. We break down what widening US-Japan and US-Germany spreads mean for FX, alongside our proprietary regime analysis.
グローバル金利スナップショット / Global Rate Snapshot
Global Rates: US Treasury Yields Lead the Rise
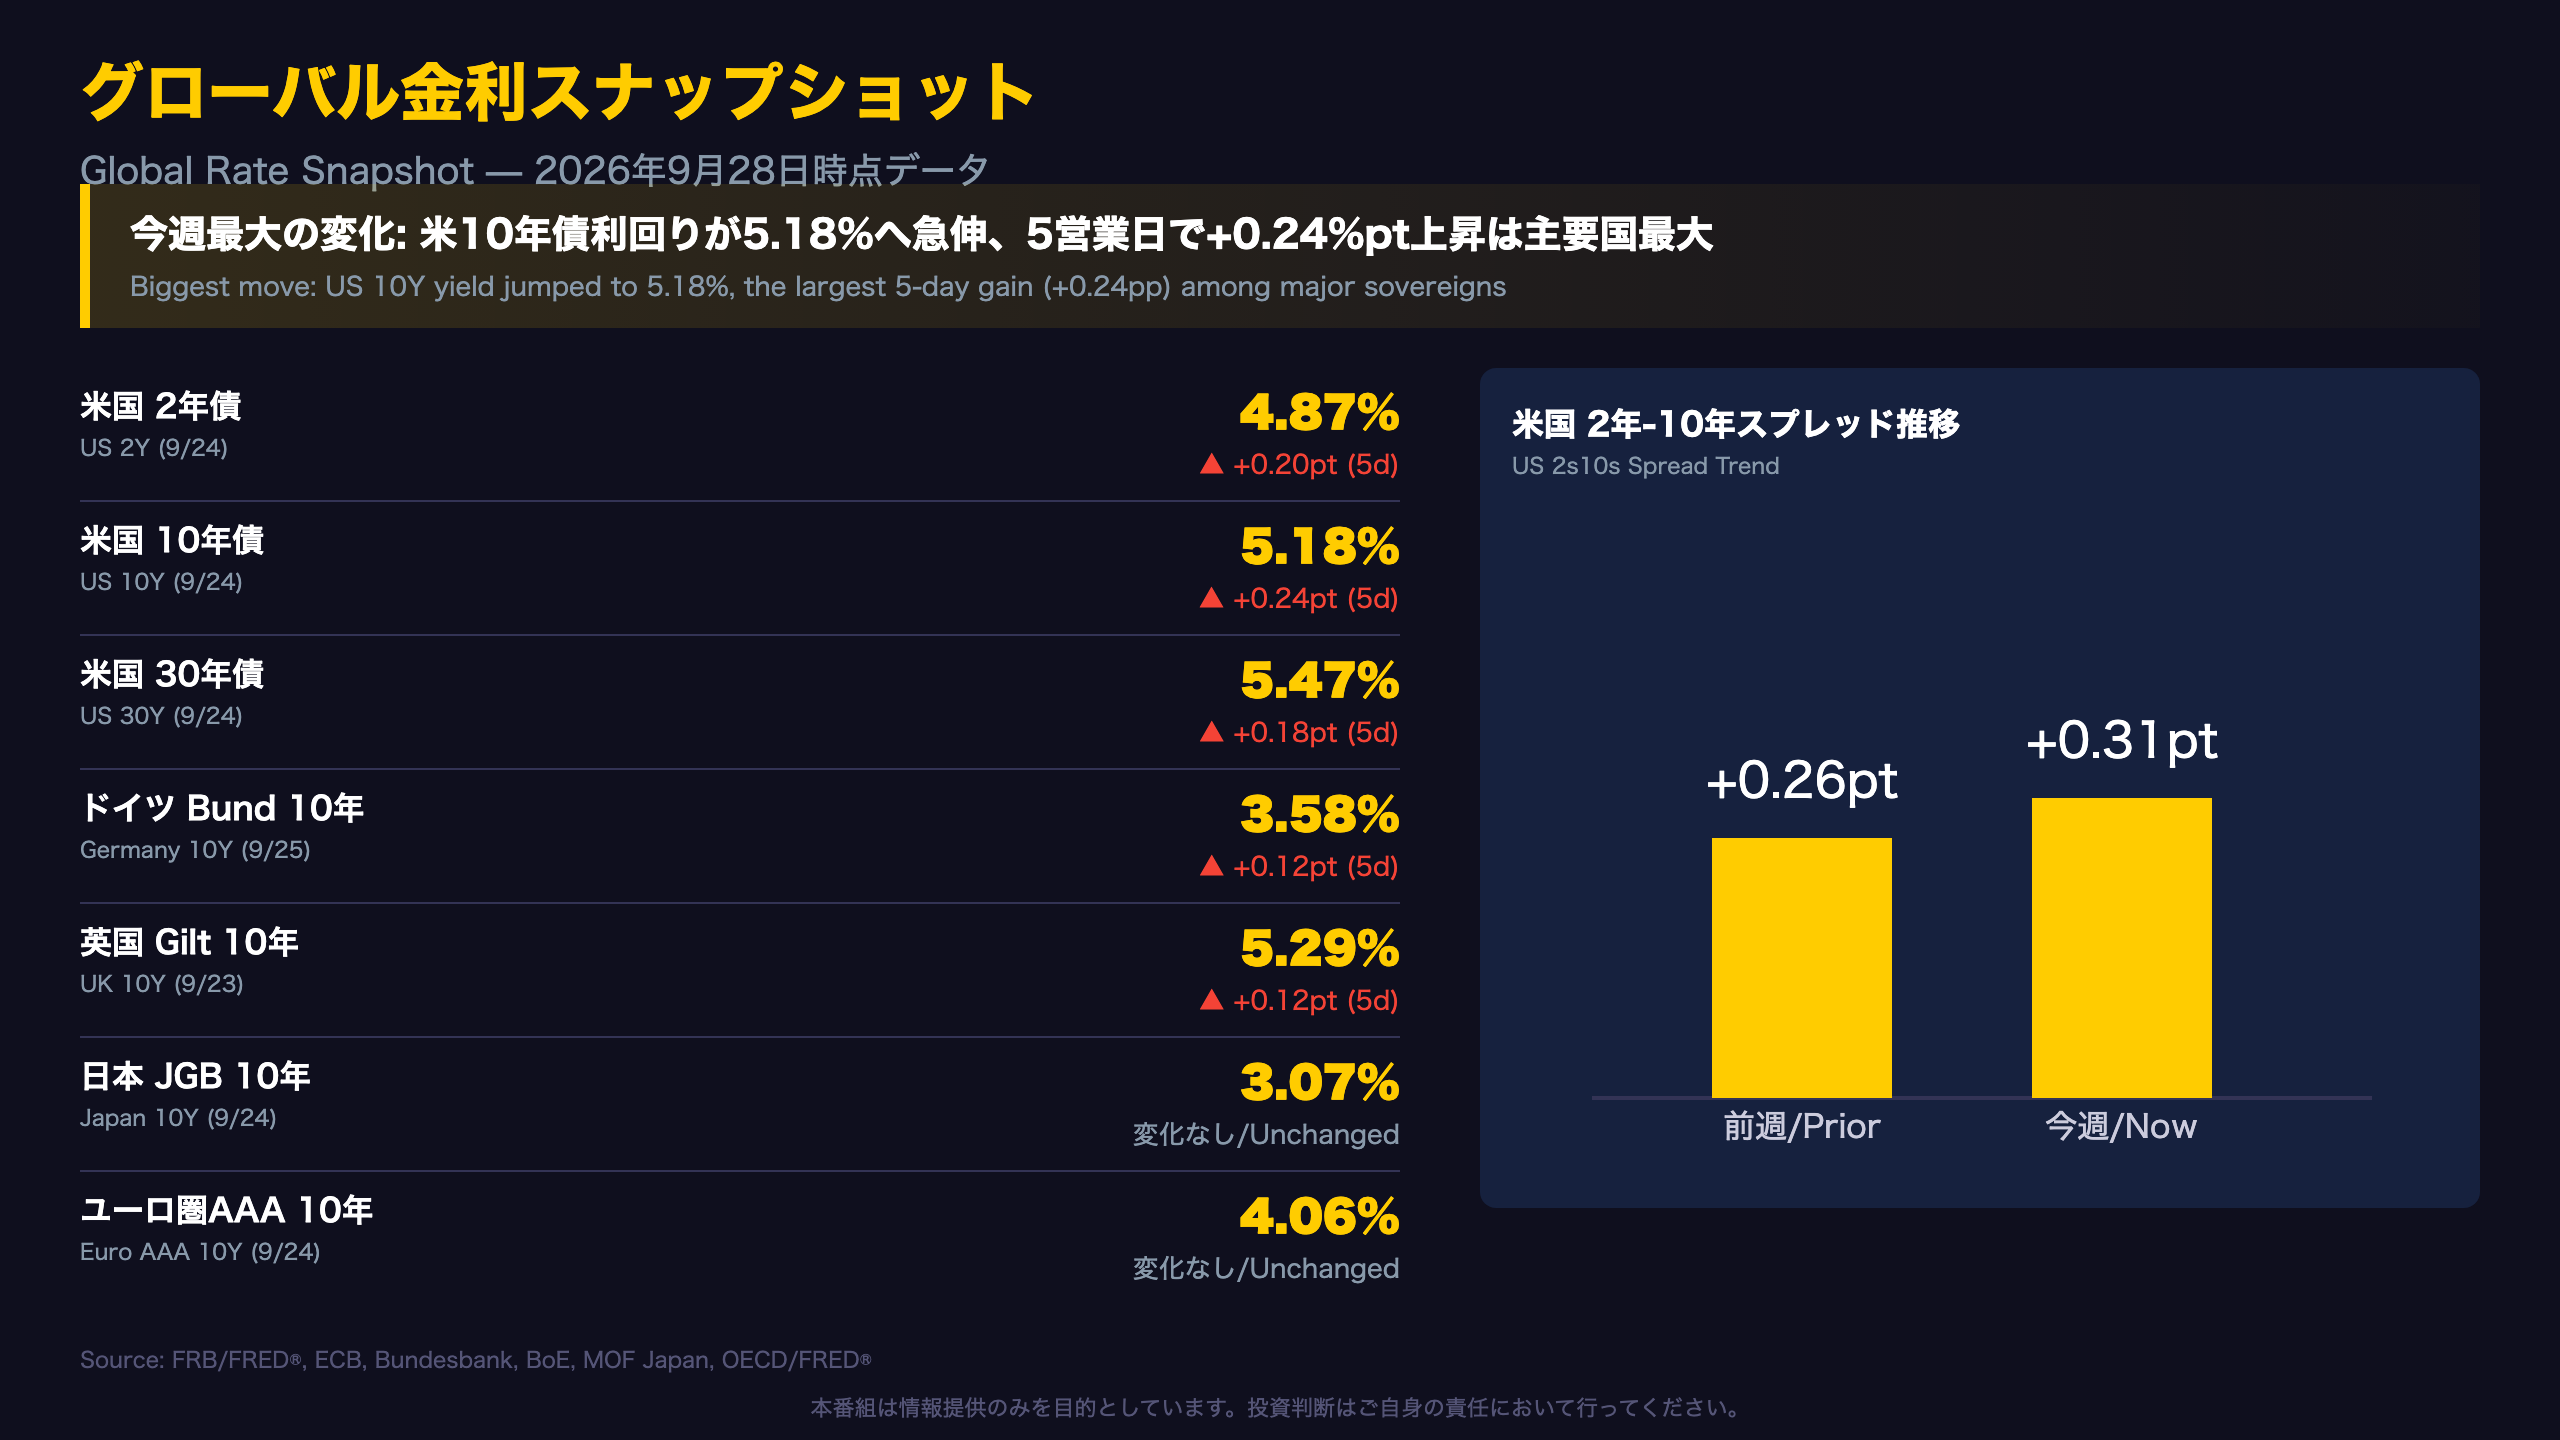
As of September 24, 2026, the US 10-year Treasury yield climbed to 5.18%, gaining +0.24 percentage points (pp) over the prior five trading sessions — the largest five-day move among the major yield curve points tracked (2-year: +0.20pp, 30-year: +0.18pp).
The Steepening Signal
The US 2s10s spread widened to +0.31pp from +0.26pp the prior week. For fixed income investors, a widening term spread in a positively-sloped curve environment typically reflects either receding recession risk or a rising term premium tied to fiscal and inflation concerns — this data cannot distinguish between the two, and confirmation would require several more weeks of observation.
By comparison, Japan’s 10-year JGB yield held at 3.07% (Sept 24), identical to the prior release — as did Germany’s 10-year Bund (3.58%) and the UK’s 10-year Gilt (5.29%). This is a data-freshness artifact (no new business-day print between releases) rather than evidence of market stagnation.
Why This Matters for International Investors
For US Treasury holders, the acceleration in long-end yields alongside curve steepening bears watching as a signal of shifting growth and inflation expectations. For JGB and Bund watchers, the flat week-over-week reading is a reminder to check the underlying data vintage before drawing conclusions.
米国債入札 Deep Dive / US Treasury Auction
US Treasury Auctions: Demand Holds, But Unevenly
As the report’s data-pull date (Sept 28) fell on a Sunday, no new auctions were conducted since the September 24 seven-year note and 4-week bill sales.
Bid-to-Cover and Indirect Bidder Comparison
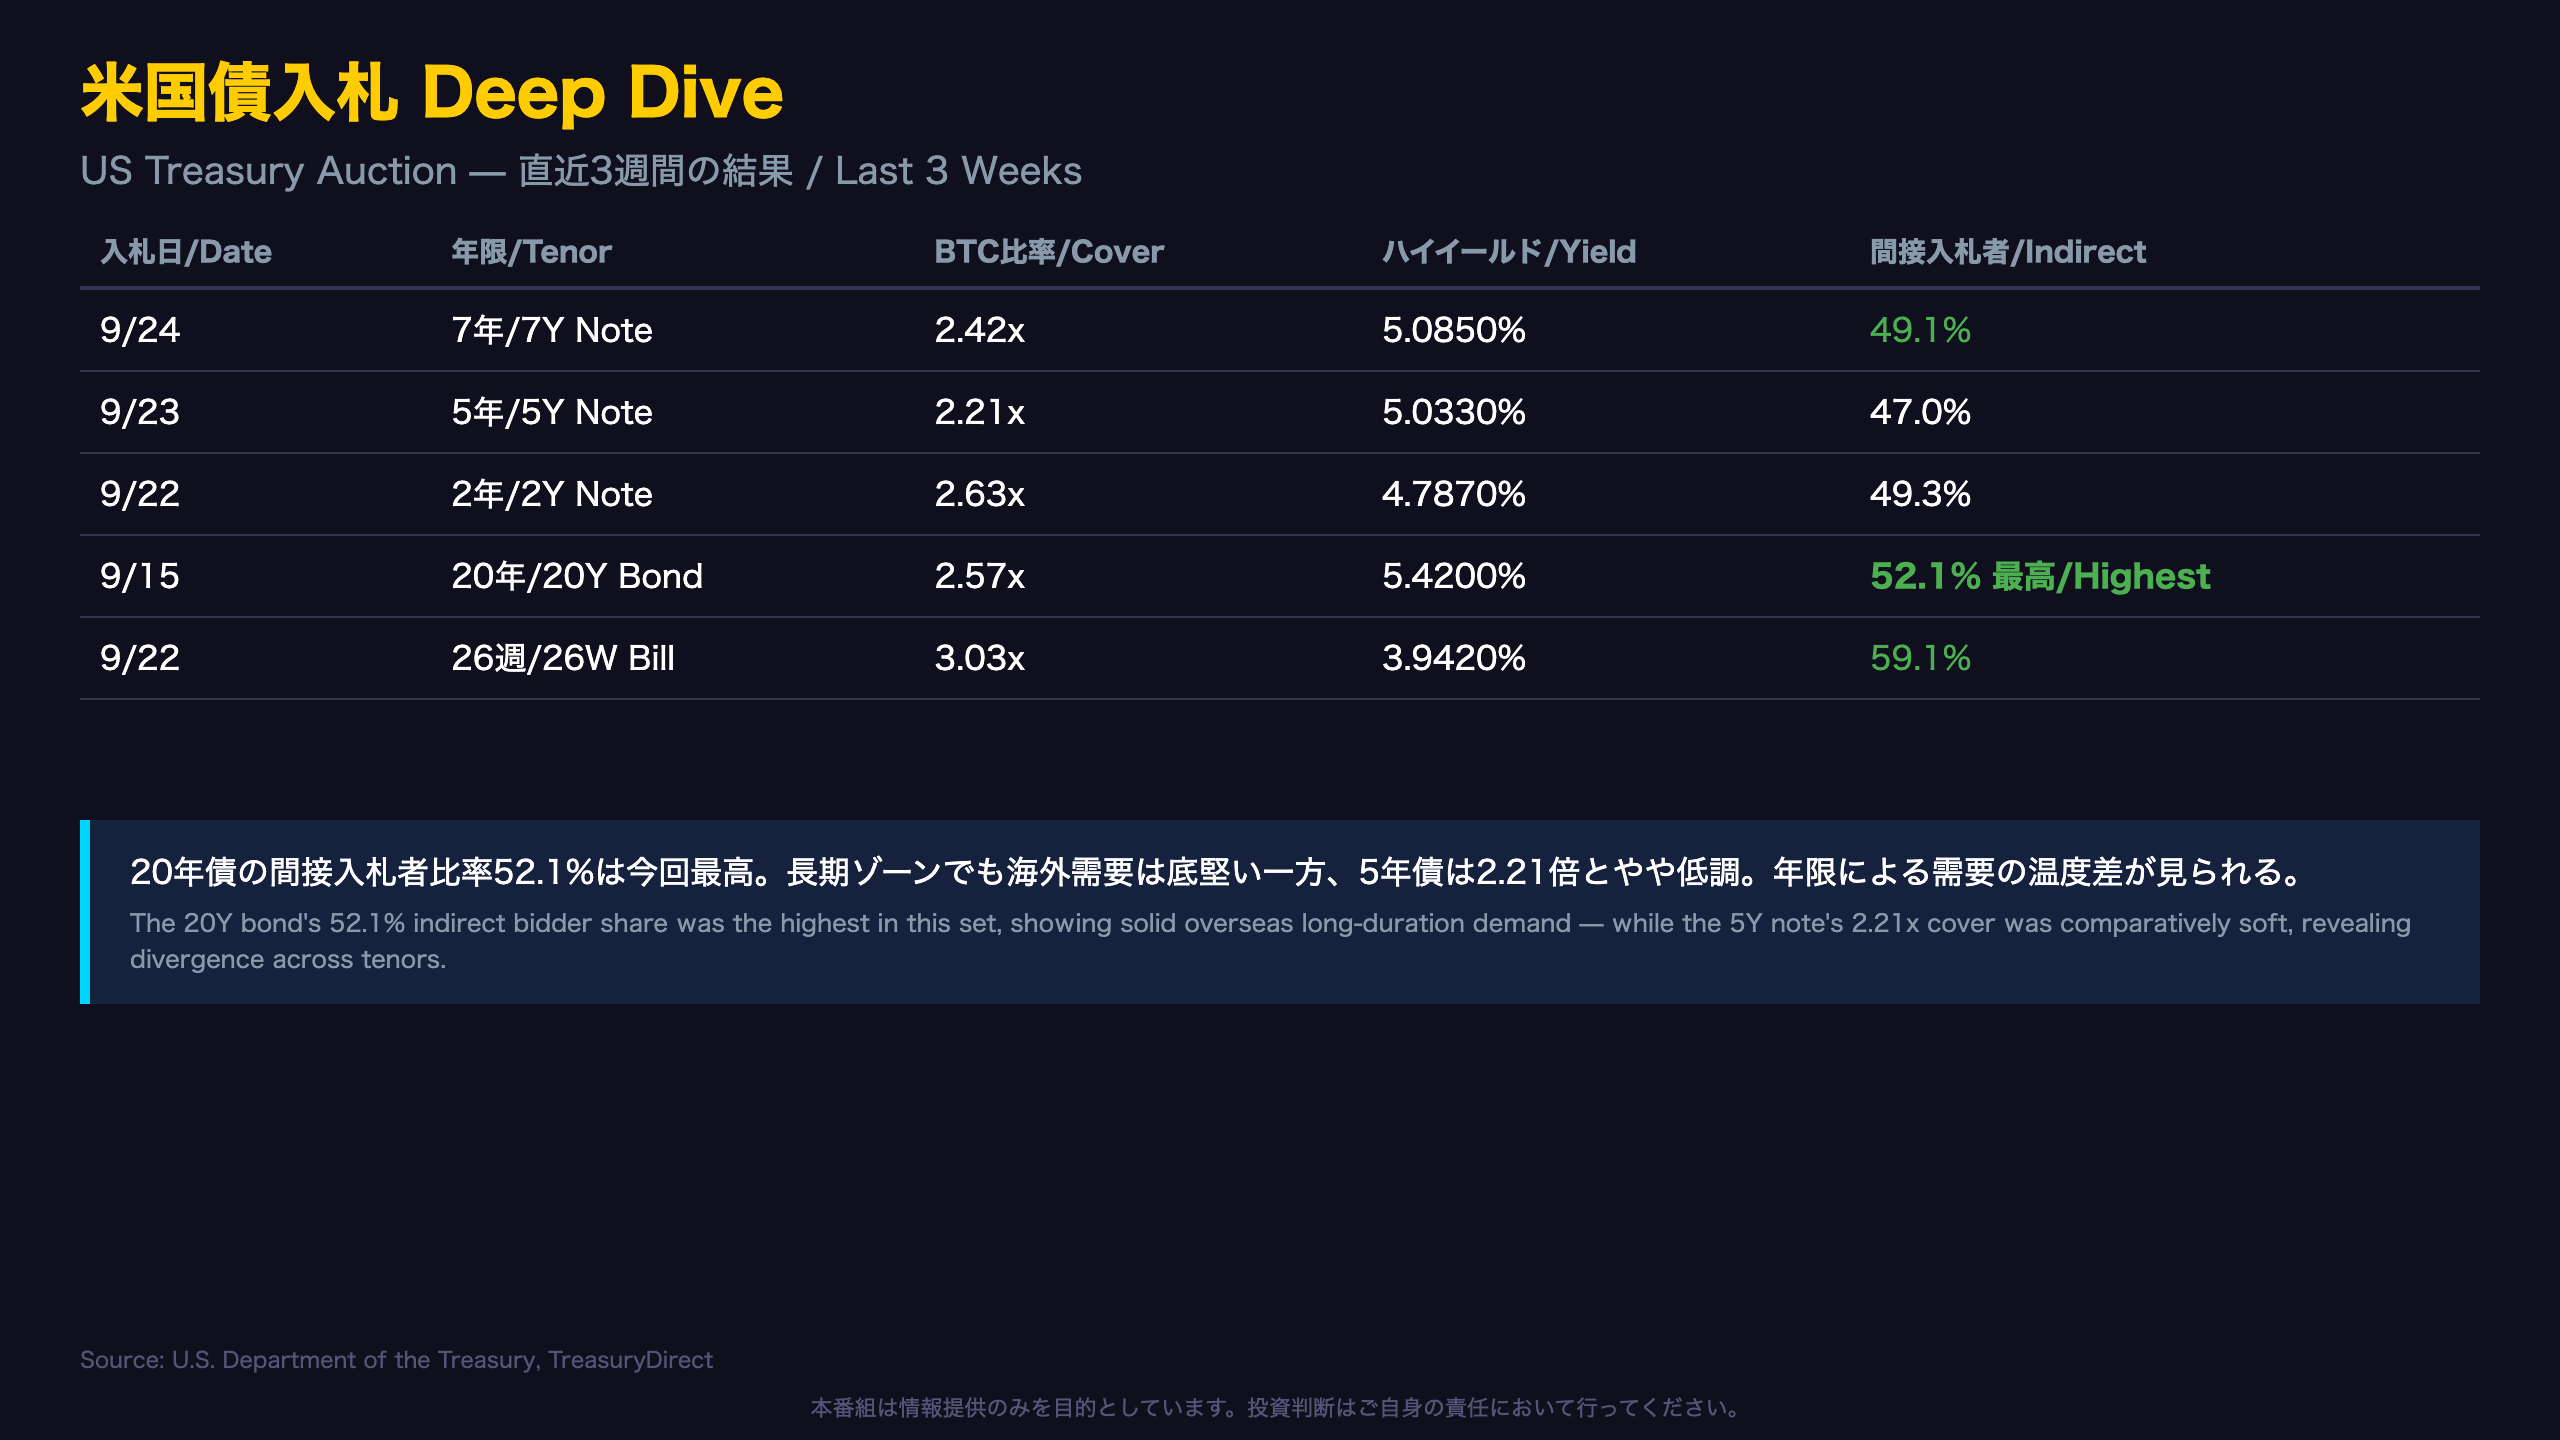
| Tenor | Auction Date | Bid-to-Cover | Indirect Bidders |
|---|---|---|---|
| 7-Year | 9/24 | 2.42x | 49.1% |
| 5-Year | 9/23 | 2.21x | 47.0% |
| 2-Year | 9/22 | 2.63x | 49.3% |
| 20-Year | 9/15 | 2.57x | 52.1% |
For readers unfamiliar with US Treasury auction mechanics: Bid-to-Cover measures total bids received divided by the amount awarded — a higher ratio signals stronger demand. Indirect bidders (a proxy for foreign central banks and sovereign entities) reflect overseas appetite for US paper, closely watched given ongoing fiscal deficit concerns.
The 20-year bond’s 52.1% indirect bidder share, the highest in this set, suggests overseas demand for long-duration Treasuries remains resilient despite persistent fiscal sustainability debates. The 5-year note’s comparatively lower 2.21x cover ratio suggests softer mid-curve appetite, though a cover ratio above 2.0x is still considered a clean auction by historical standards.
Market Implication
Unlike periods of acute fiscal stress, current US auction metrics do not show overt signs of buyer’s strike. Next week’s 10-year and 30-year auctions will be key data points to confirm whether long-end demand holds.
ヨーロッパ債券市場 / European Bond Markets
European Bonds: A Data Lag Worth Understanding
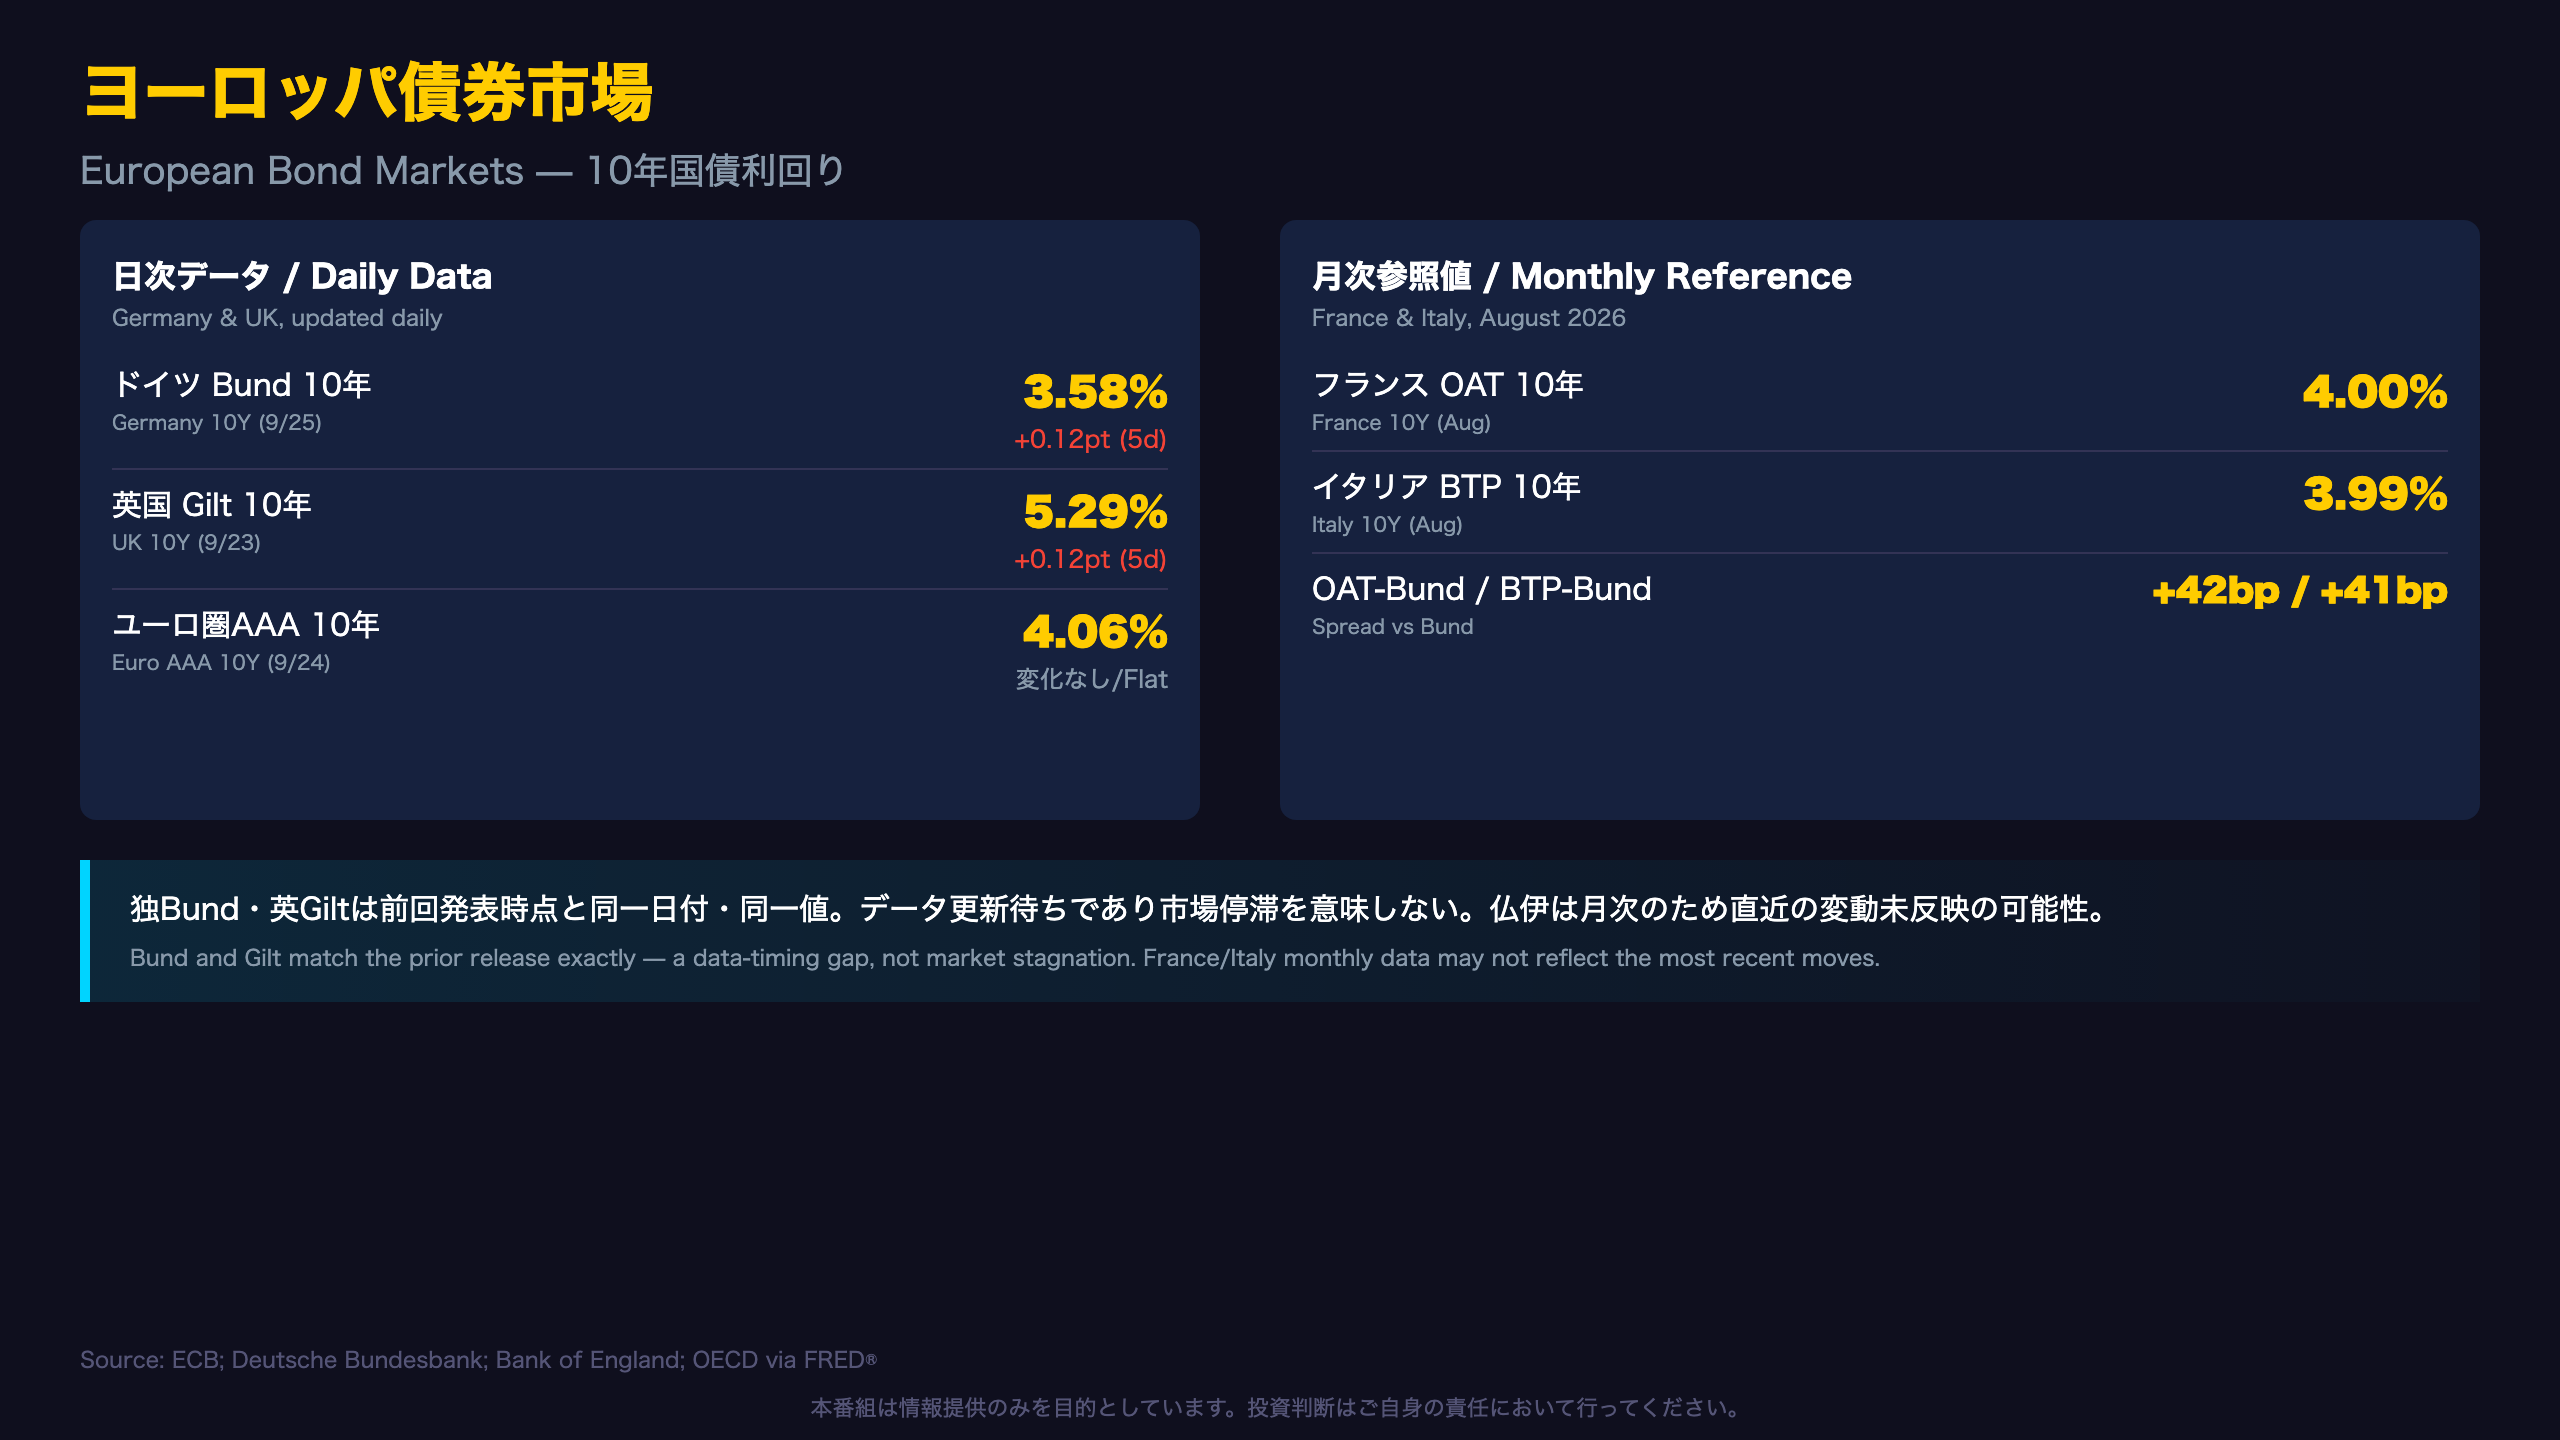
Germany’s 10-year Bund (3.58%, as of Sept 25) and the UK’s 10-year Gilt (5.29%, as of Sept 23) show identical figures, and identical five-day changes (+0.12pp), to the prior week’s release. This reflects a data vintage overlap rather than necessarily market stagnation.
Institutional Context
For readers unfamiliar with these sources: the Deutsche Bundesbank and Bank of England publish daily benchmark yields, while French OAT and Italian BTP 10-year yields sourced via the OECD are only available monthly, introducing a data lag of up to one month versus the daily German, UK, US and Japan series.
OAT-Bund spread: +42.0bps (France fiscal and political risk gauge)
BTP-Bund spread: +41.0bps (Italy sovereign risk and ECB policy expectations gauge)
Both spreads are little-changed from the prior reading. For US and Japanese investors accustomed to Fed and BOJ-driven narratives, these euro-area periphery spreads serve as a proxy for eurozone political risk, comparable in spirit to how EM sovereign spreads are read against US Treasuries.
The UK’s 5.29% Gilt yield remains among the highest of major sovereigns tracked here, consistent with the NFC HMM system’s Restrictive Hold regime classification for the BOE model, suggesting the market continues to price a prolonged period of elevated UK policy rates.
日本国債・日銀政策金利 / JGB & BOJ
JGB Auctions: A Structural Yield Climb With Uneven Demand
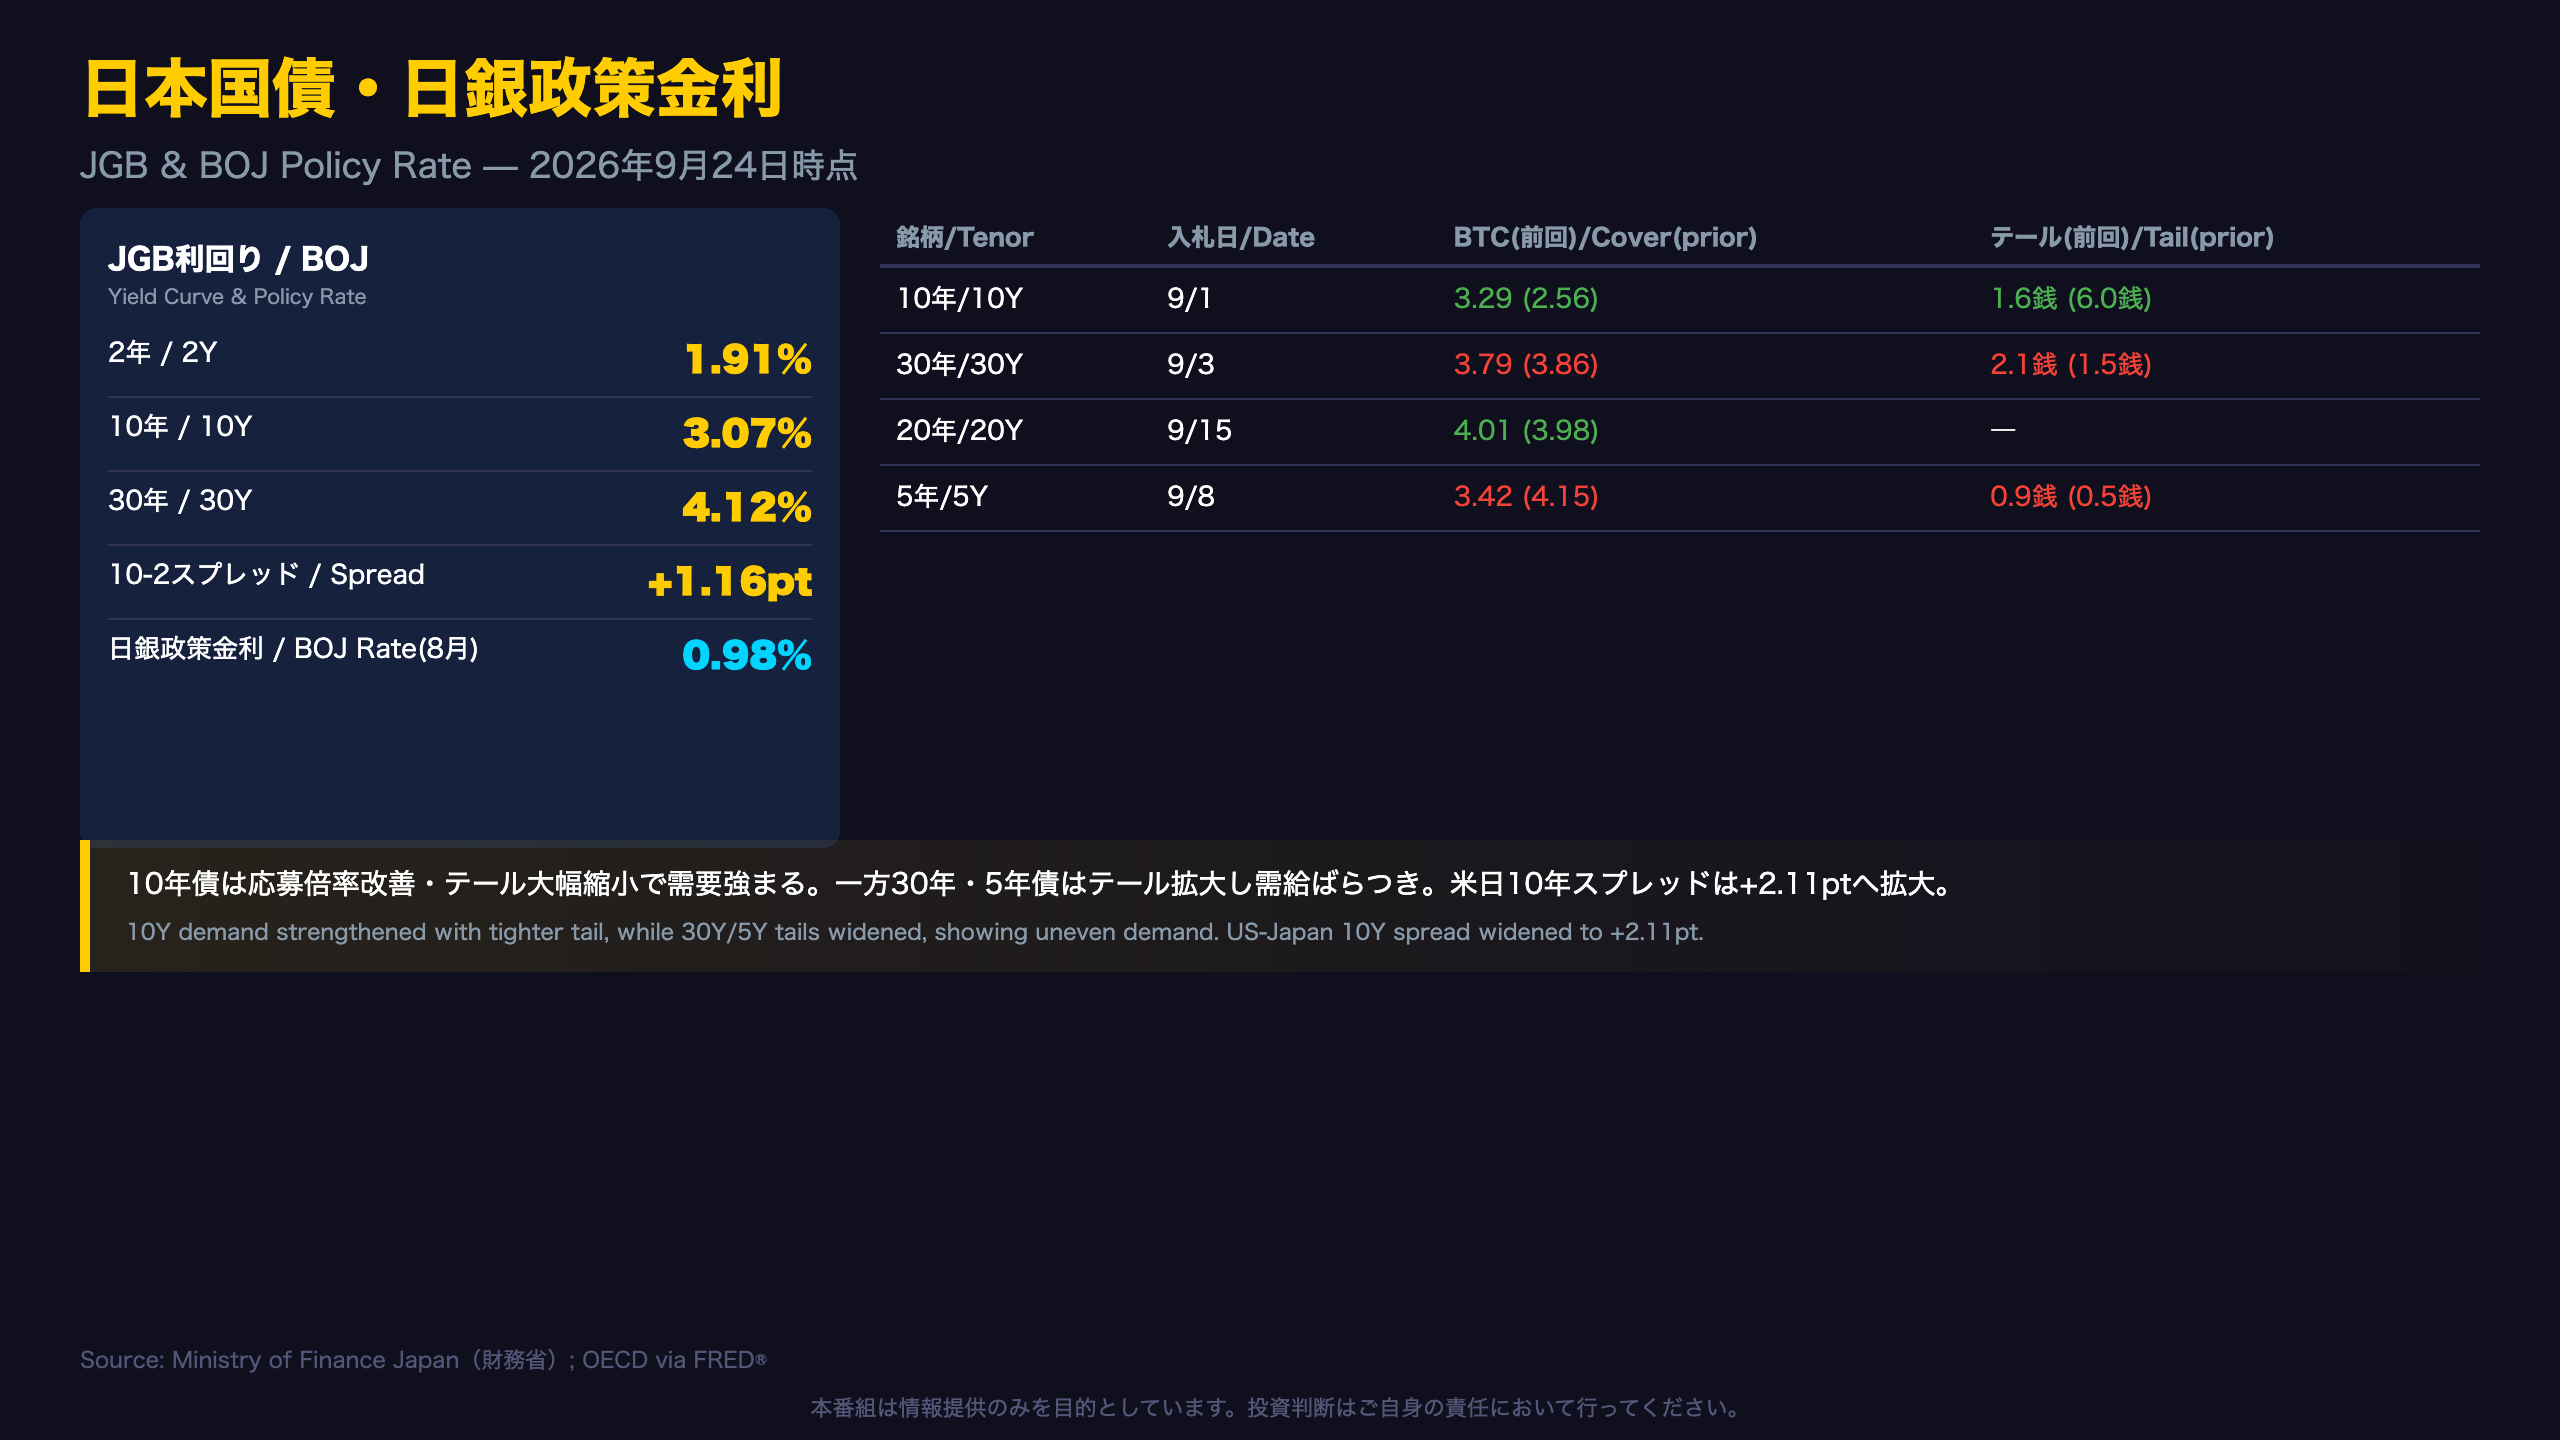
Tracing Japanese Government Bond auction results over the past six months reveals a clear upward yield trend: the 10-year JGB average auction yield rose from 2.540% in April to 2.995% in September, roughly +45.5bp over five months. The 30-year climbed from 3.697% to 4.079% (+38.2bp) over the same window. This aligns with the Bank of Japan’s continued Hawkish policy stance under the NFC HMM regime classification.
Bid-to-Cover and Tail Comparison (in Sen)
| Tenor | Auction Date | BTC (prior) | Tail (prior) |
|---|---|---|---|
| 10Y | 9/1 | 3.29x (2.56x on 8/4) | 1.6 sen (6.0 sen on 8/4) |
| 30Y | 9/3 | 3.79x (3.86x on 8/6) | 2.1 sen (1.5 sen on 8/6) |
| 5Y | 9/8 | 3.42x (4.15x on 8/18) | 0.9 sen (0.5 sen on 8/18) |
For readers new to JGB auction mechanics: the tail (stop-out yield minus average yield) measures dispersion among winning bids, a widening tail signals less uniform demand, conceptually similar to a widening tail in US Treasury auctions.
The 10-year auction showed clear improvement, both stronger cover and a sharply narrower tail, while the 30-year and 5-year auctions saw modestly weaker metrics. This divergence suggests demand for JGBs is not uniformly deteriorating despite the broader yield uptrend, but the long and belly segments show early signs of buyer hesitation.
USD/JPY Carry Context
The US-Japan 10-year spread widened to +2.11pp (from +2.04pp), reinforcing the yield differential that underpins USD/JPY carry trade economics, though causality with spot FX movements cannot be inferred from yield data alone.
FX・CFDへの含意 / Trade Implications
NFC HMM Regimes: Cross-Checking Rate Spreads Against Model States
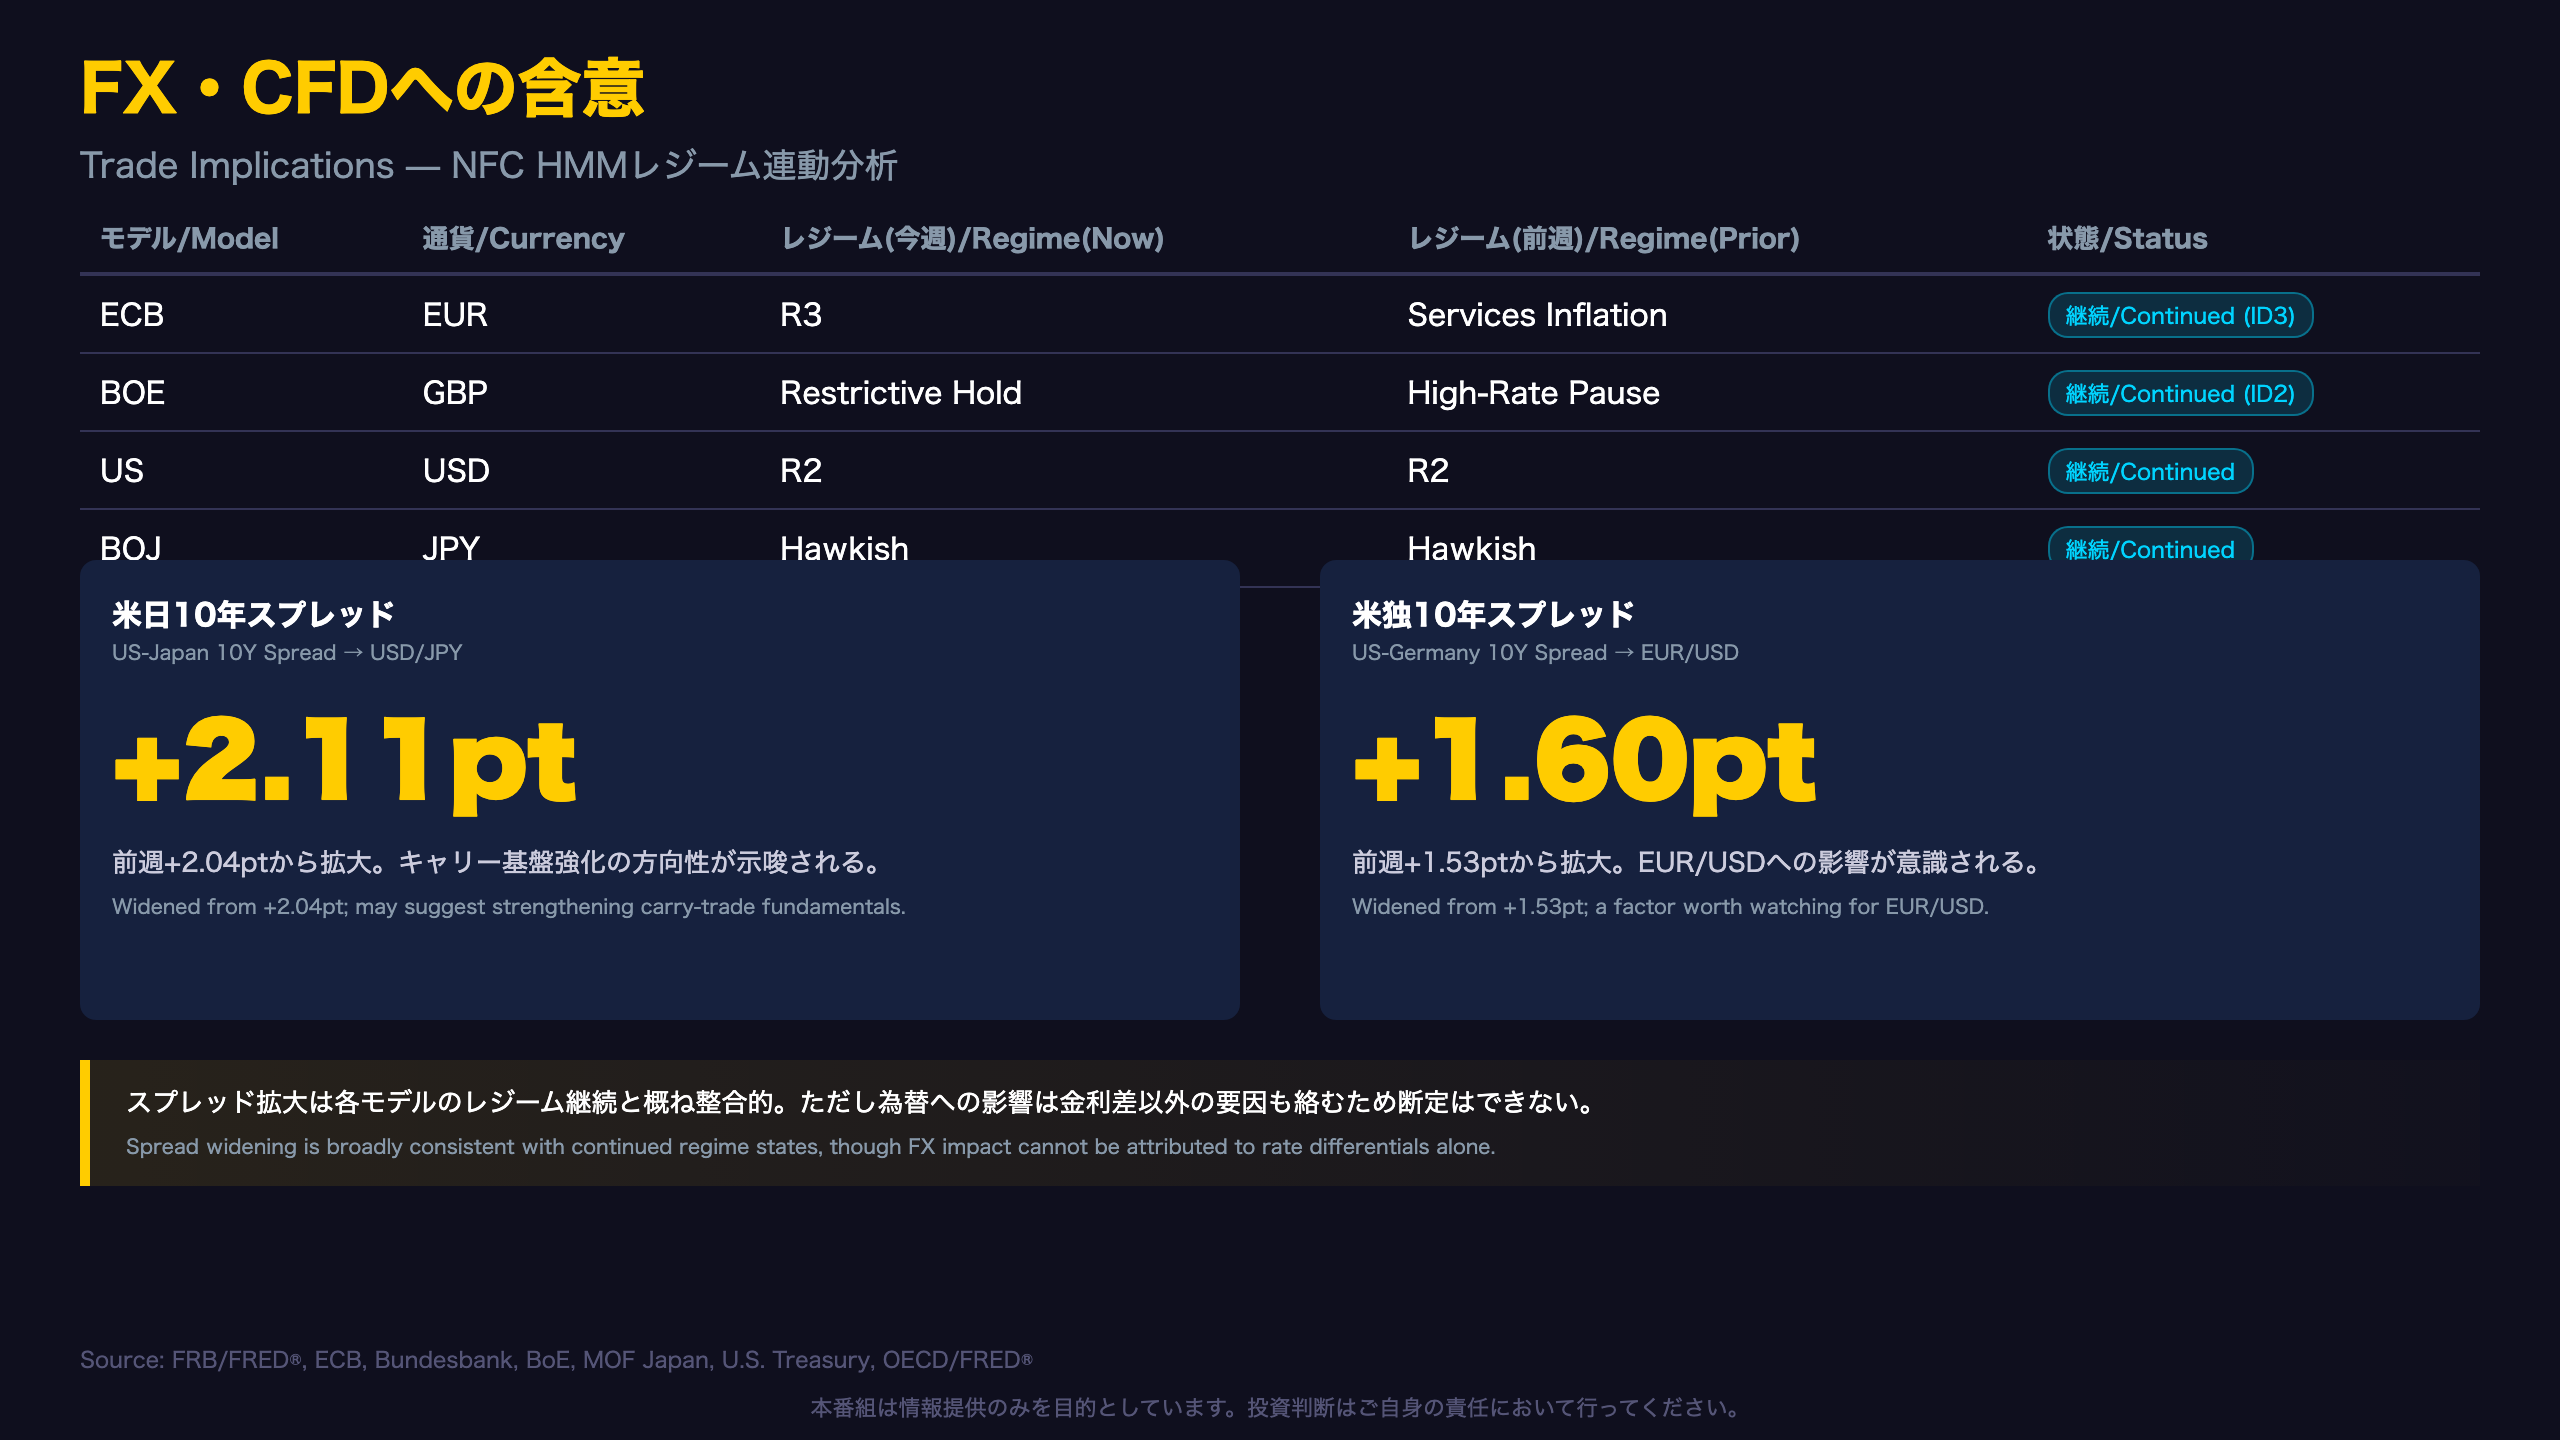
The NFC HMM (Hidden Markov Model) system, NFC Market Live’s proprietary regime-detection framework, currently assigns 100% confidence to the following states.
| Model | Currency | Regime | Regime ID |
|---|---|---|---|
| ECB | EUR | R3 (previously labeled Services Inflation) | 3 |
| BOE | GBP | Restrictive Hold (previously High-Rate Pause) | 2 |
| US | USD | R2 | 2 |
| BOJ | JPY | Hawkish | 2 |
Note that while the ECB and BOE regime labels changed versus the prior week, the underlying regime IDs (3 and 2, respectively) remained constant, indicating continuity of the underlying state rather than a genuine regime shift.
Spread Consistency Check
The widening US-Germany 10-year spread (+1.60pp, up from +1.53pp) is broadly consistent with continued USD-strength dynamics implied by the US model’s R2 regime alongside the ECB’s R3 state. Similarly, the widening US-Japan spread (+2.11pp, up from +2.04pp) is consistent with the BOJ’s Hawkish regime persisting even as US yields rise faster in absolute terms.
For US and European institutional readers: this cross-referencing of yield spreads against proprietary regime models offers a structured, less noise-driven framework than single-data-point FX commentary. That said, yield differentials are one of several drivers of currency pairs like USD/JPY and EUR/USD, geopolitical risk sentiment and intervention risk (particularly for JPY) can override rate-differential logic in the short term.
The next Global Bond Watch release is expected next week; watch for updated French and Italian monthly data and whether JGB long-end demand stabilizes.
Disclaimer: This article is for informational purposes only. All investment decisions are made solely at your own risk.