📺 Watch the Full Video Analysis
This article was automatically generated by the NFC Market Live AI analysis system. (Updated: 2026-09-26 07:17 JST)
📄 Primary Source
米国労働省(DOL)— 新規失業保険申請件数
https://www.dol.gov/newsroom/releases/eta/eta20260924
米国エネルギー情報局(EIA)— 週間石油状況レポート
https://www.eia.gov/petroleum/supply/weekly/pdf/highlights.pdf
連邦準備制度理事会(FRB)— H.4.1 バランスシート
https://www.federalreserve.gov/releases/h41/current/h41.htm
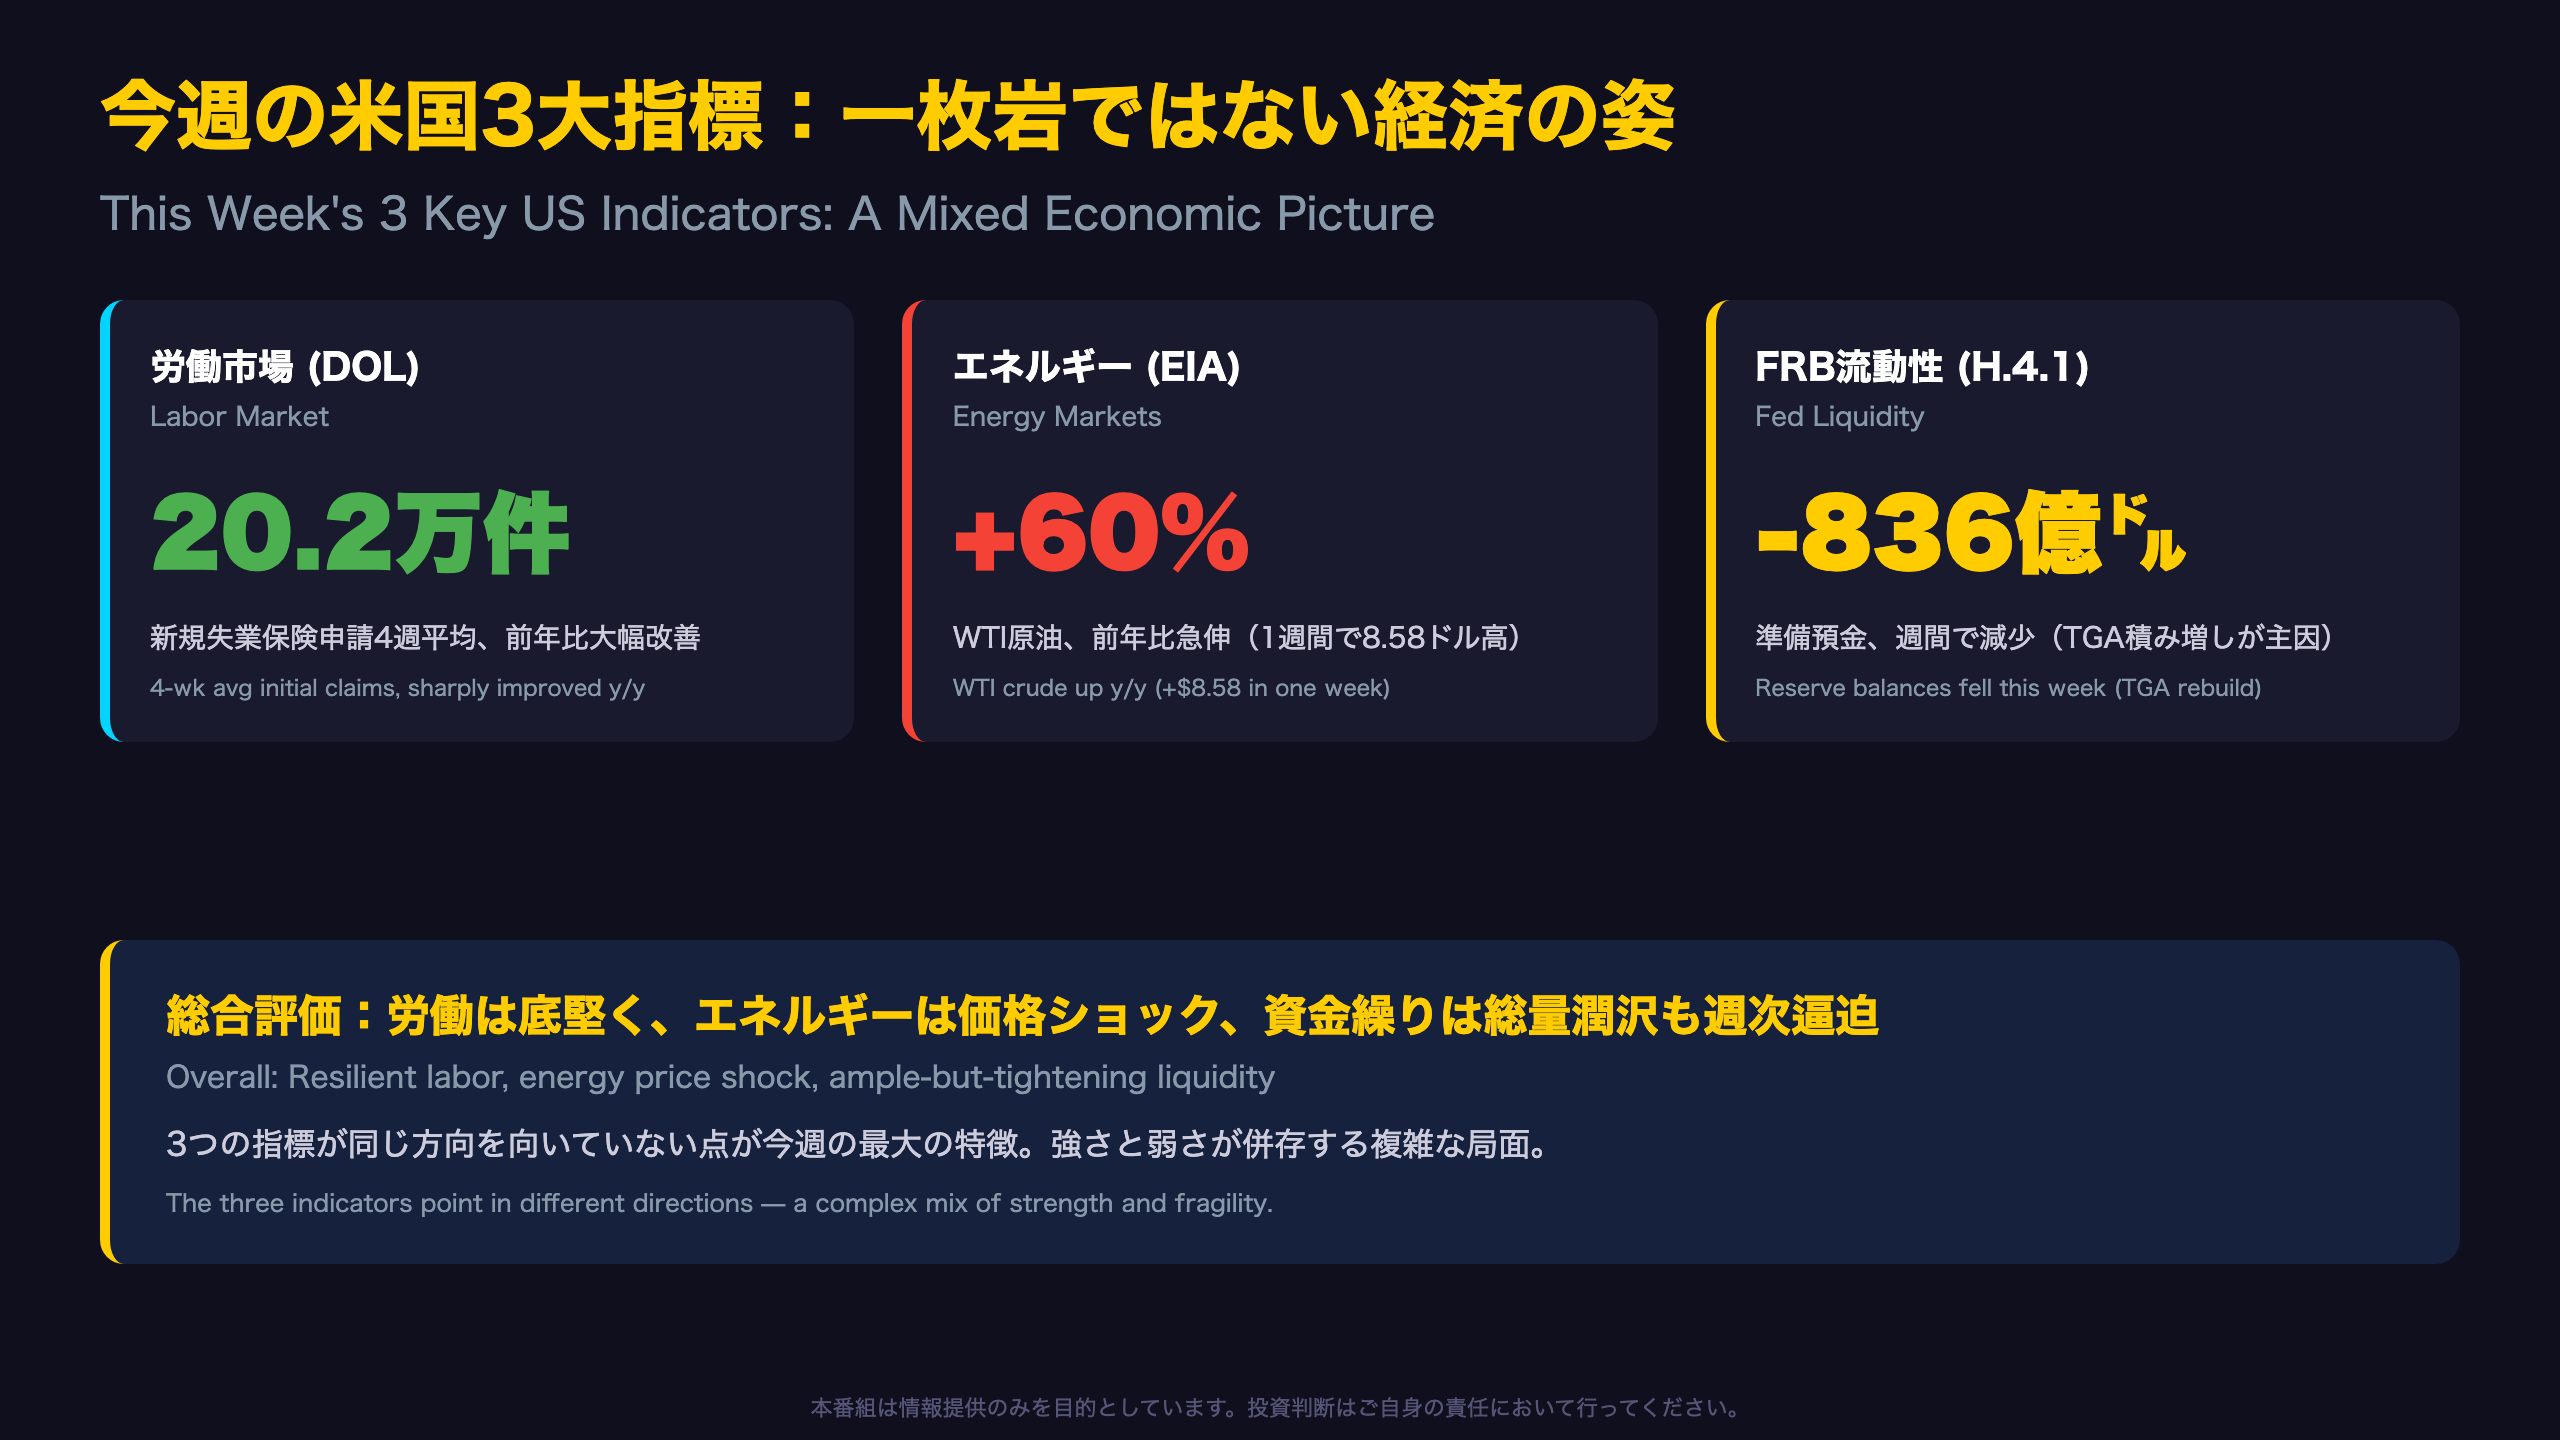
📊 A deep dive into this week’s 3 key US macro releases.
🧑💼 DOL initial jobless claims held near historic lows (4-wk avg 202,250), signaling labor market resilience.
⛽ EIA data showed WTI crude jump $8.58 in a week to $101.27 — up 60% year-over-year, a fresh energy price shock.
🏦 The Fed’s H.4.1 showed reserve balances fall $83.6B in a week as the Treasury General Account rebuilt, while the reverse repo buffer keeps shrinking.
💡 We break down what resilient jobs plus hot energy prices could mean for the Fed’s rate-cut path.
今週のアルティメット・サマリー
For readers unfamiliar with the format, this program layers a proprietary Hidden Markov Model (HMM) regime-detection framework on top of the official US data releases discussed below (DOL, EIA, and the Fed’s H.4.1). This week’s model places the US economy in \”Regime R0\” with 100% confidence for a fifth consecutive week, and projects a 99.8% probability of remaining in R0 next week — statistically, no abrupt regime shift is currently signaled.
The model’s \”centroid distance\” metric, which measures how closely current data matches the historical center of this regime, drifted from 1.8238 (Aug 28) to a temporary high of 1.8678 (Sep 4) before settling back to 1.8331 for three straight weeks — suggesting convergence toward the regime’s typical pattern rather than divergence.
Still, several sub-indicators outside the core HMM inputs are flashing \”yellow\” anomalies (Z-scores above 2.0, though below the 3.0 \”red\” threshold that historically precedes regime transitions). Notably, total petroleum products supplied is running low relative to typical levels (Z=2.73), while gasoline CPI is up 27.4% year-over-year (Z=2.15) and currency in circulation is elevated (Z=2.27) — a cost-push inflation signature building beneath the surface. None have yet crossed the critical threshold, but they bear watching as the sections below unpack labor, energy, and Fed liquidity data in detail.
労働市場の現在地(DOL詳細)
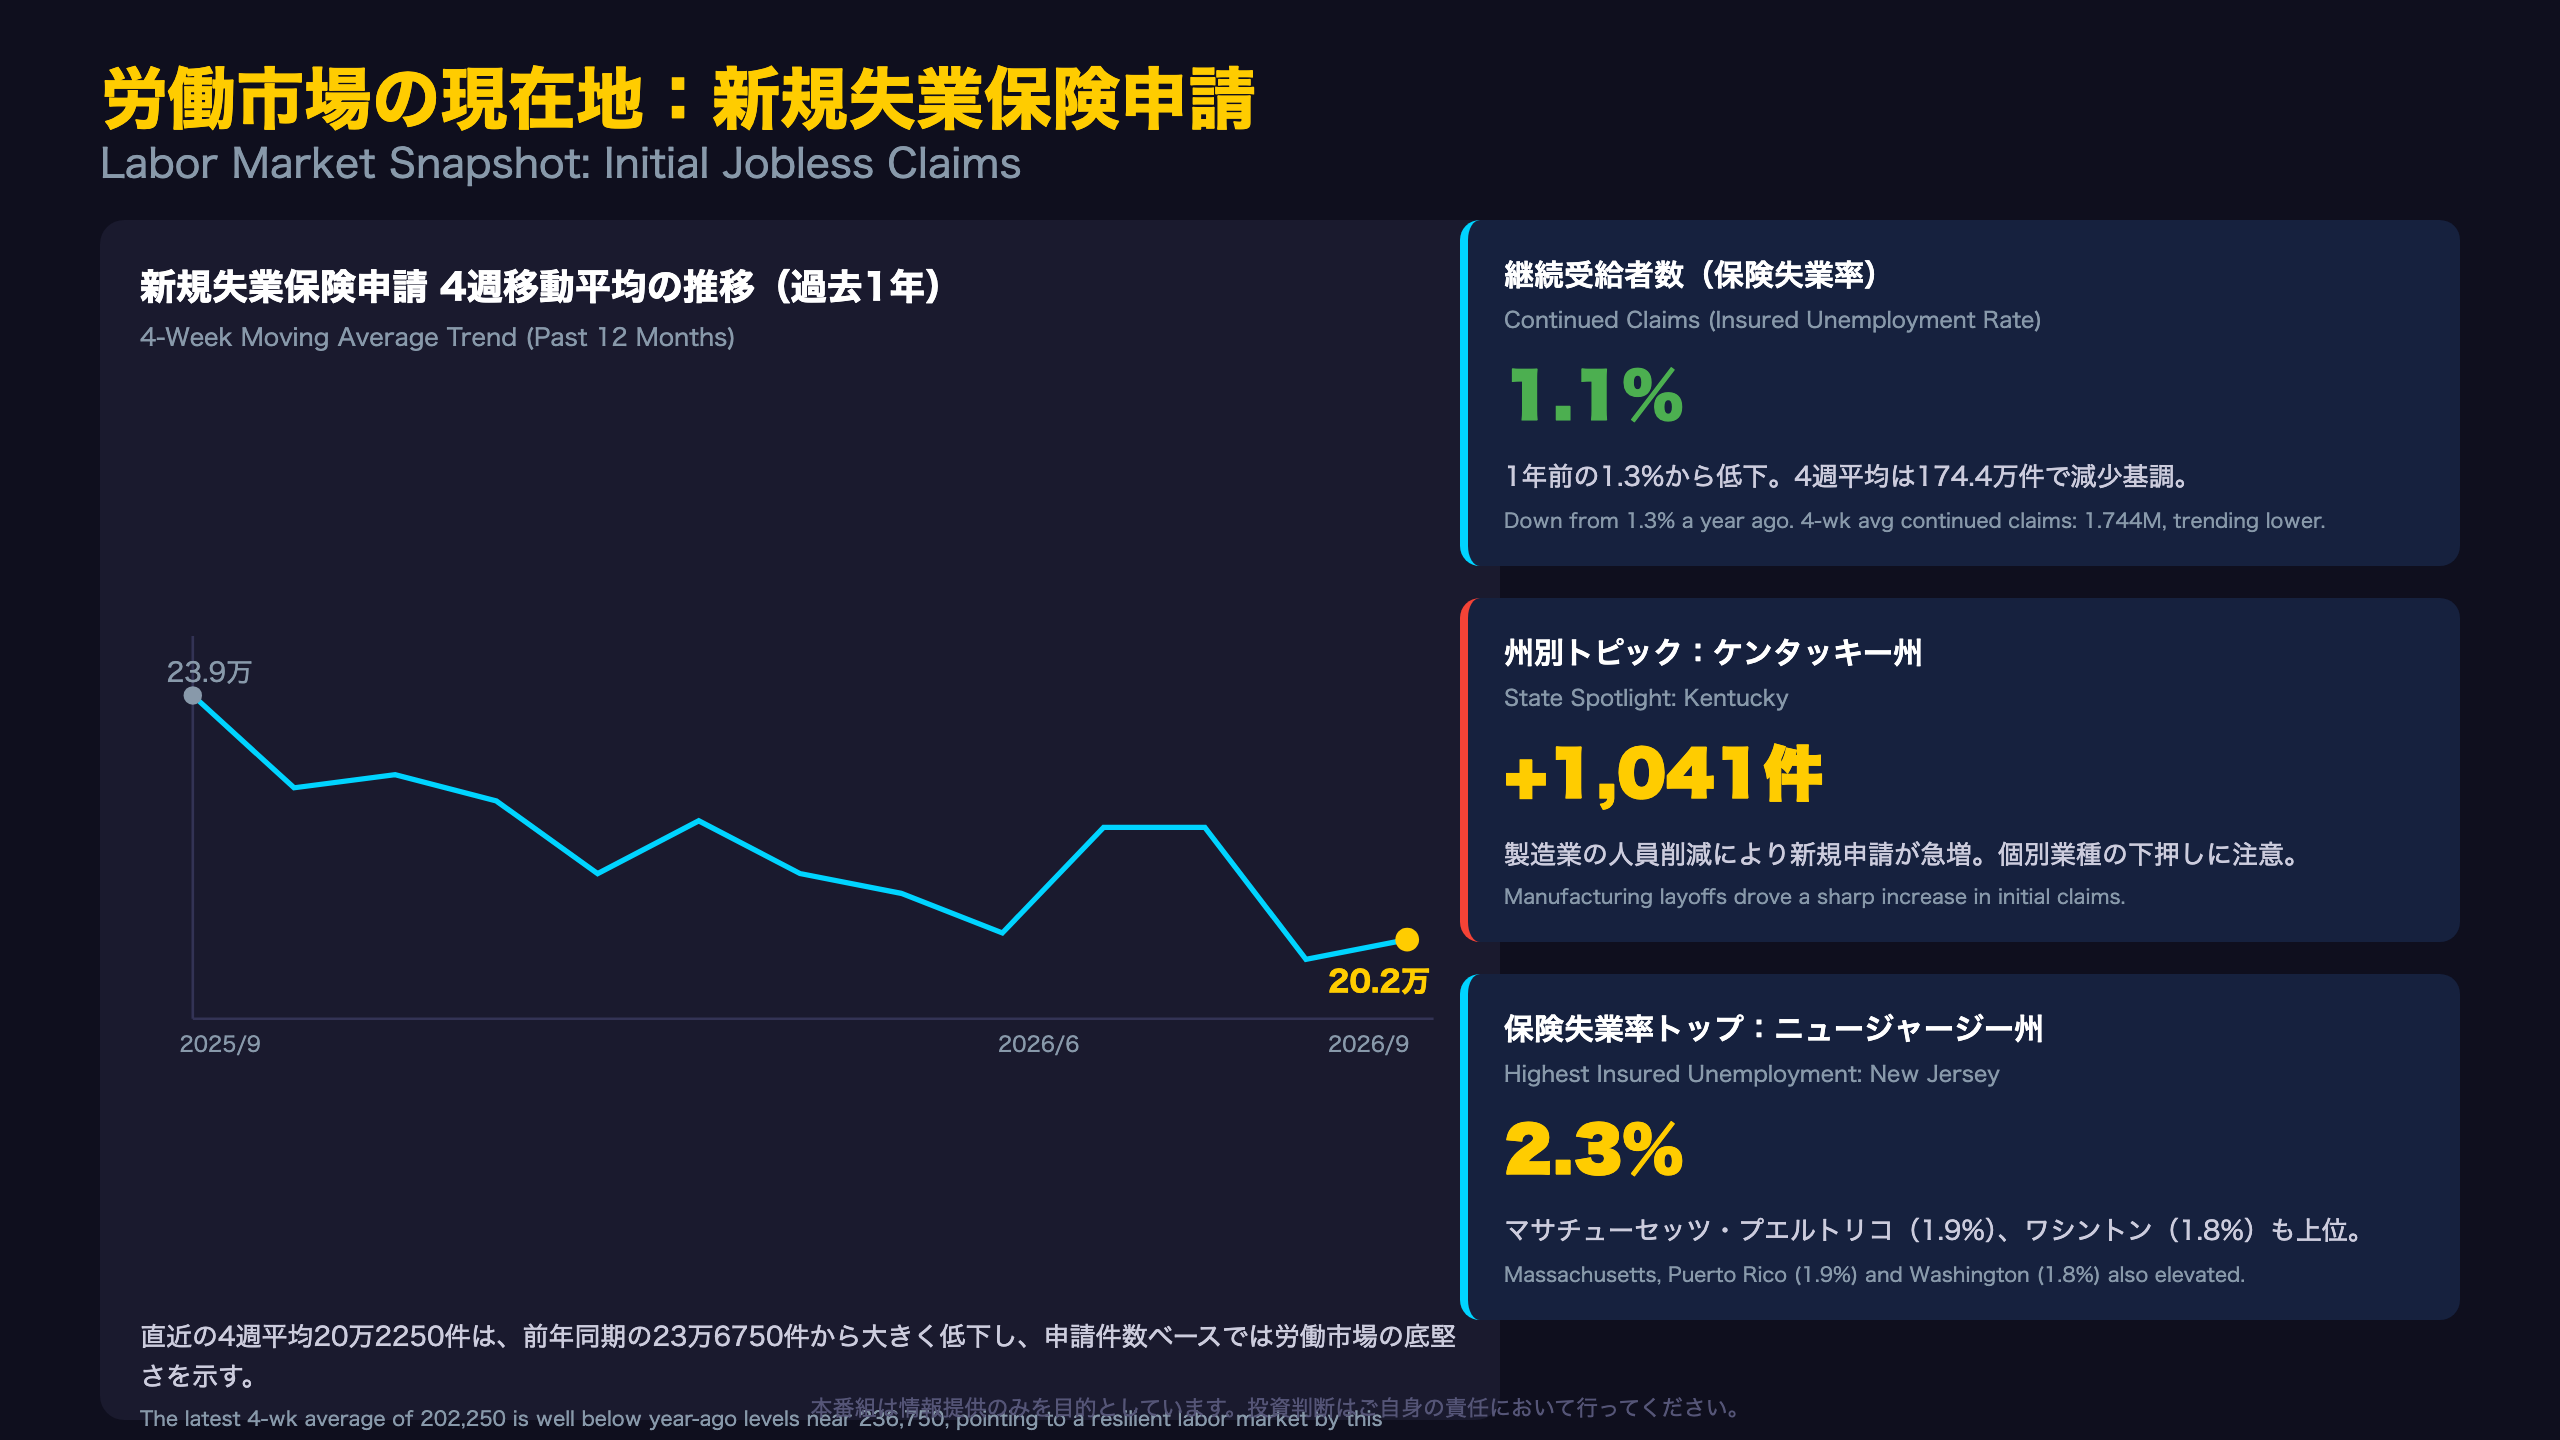
International readers should note that the US \”initial claims\” series is a weekly administrative dataset from state unemployment offices — not the same as the monthly non-farm payrolls report most global investors watch. Economists typically view readings below 250,000 as consistent with a healthy labor market; this week’s 197,000 remains comfortably below that threshold.
One detail lost in the topline number: the previous week’s figure was revised upward from 196,000 to 198,000, a reminder that these weekly prints are volatile and subject to methodology-driven adjustment. The insured unemployment rate, a broader gauge of benefit recipiency, has fallen to 1.1% from 1.3% a year ago — arguably a cleaner signal of underlying labor market health than the initial claims print alone.
Regionally, New Jersey (2.3%), Massachusetts and Puerto Rico (1.9% each), and Washington (1.8%) show the highest insured unemployment rates, hinting at localized softness even as the national trend improves.
However, a countervailing signal exists: supplementary regime-model data flagged both the labor force participation rate (61.6%) and employment-population ratio (59.1%) running below their typical historical levels — suggesting some of the claims improvement could reflect workers exiting the labor force rather than a uniformly strengthening job market. For the Fed, this data supports a \”no urgency to cut aggressively\” stance, though it’s not an unambiguous all-clear signal.
エネルギー需給の現在地(EIA詳細)
For non-US readers, the EIA’s Weekly Petroleum Status Report is the closest equivalent to a real-time pulse-check on US energy supply and demand, released every Wednesday and closely watched by both oil traders and macro economists tracking pass-through into headline CPI.
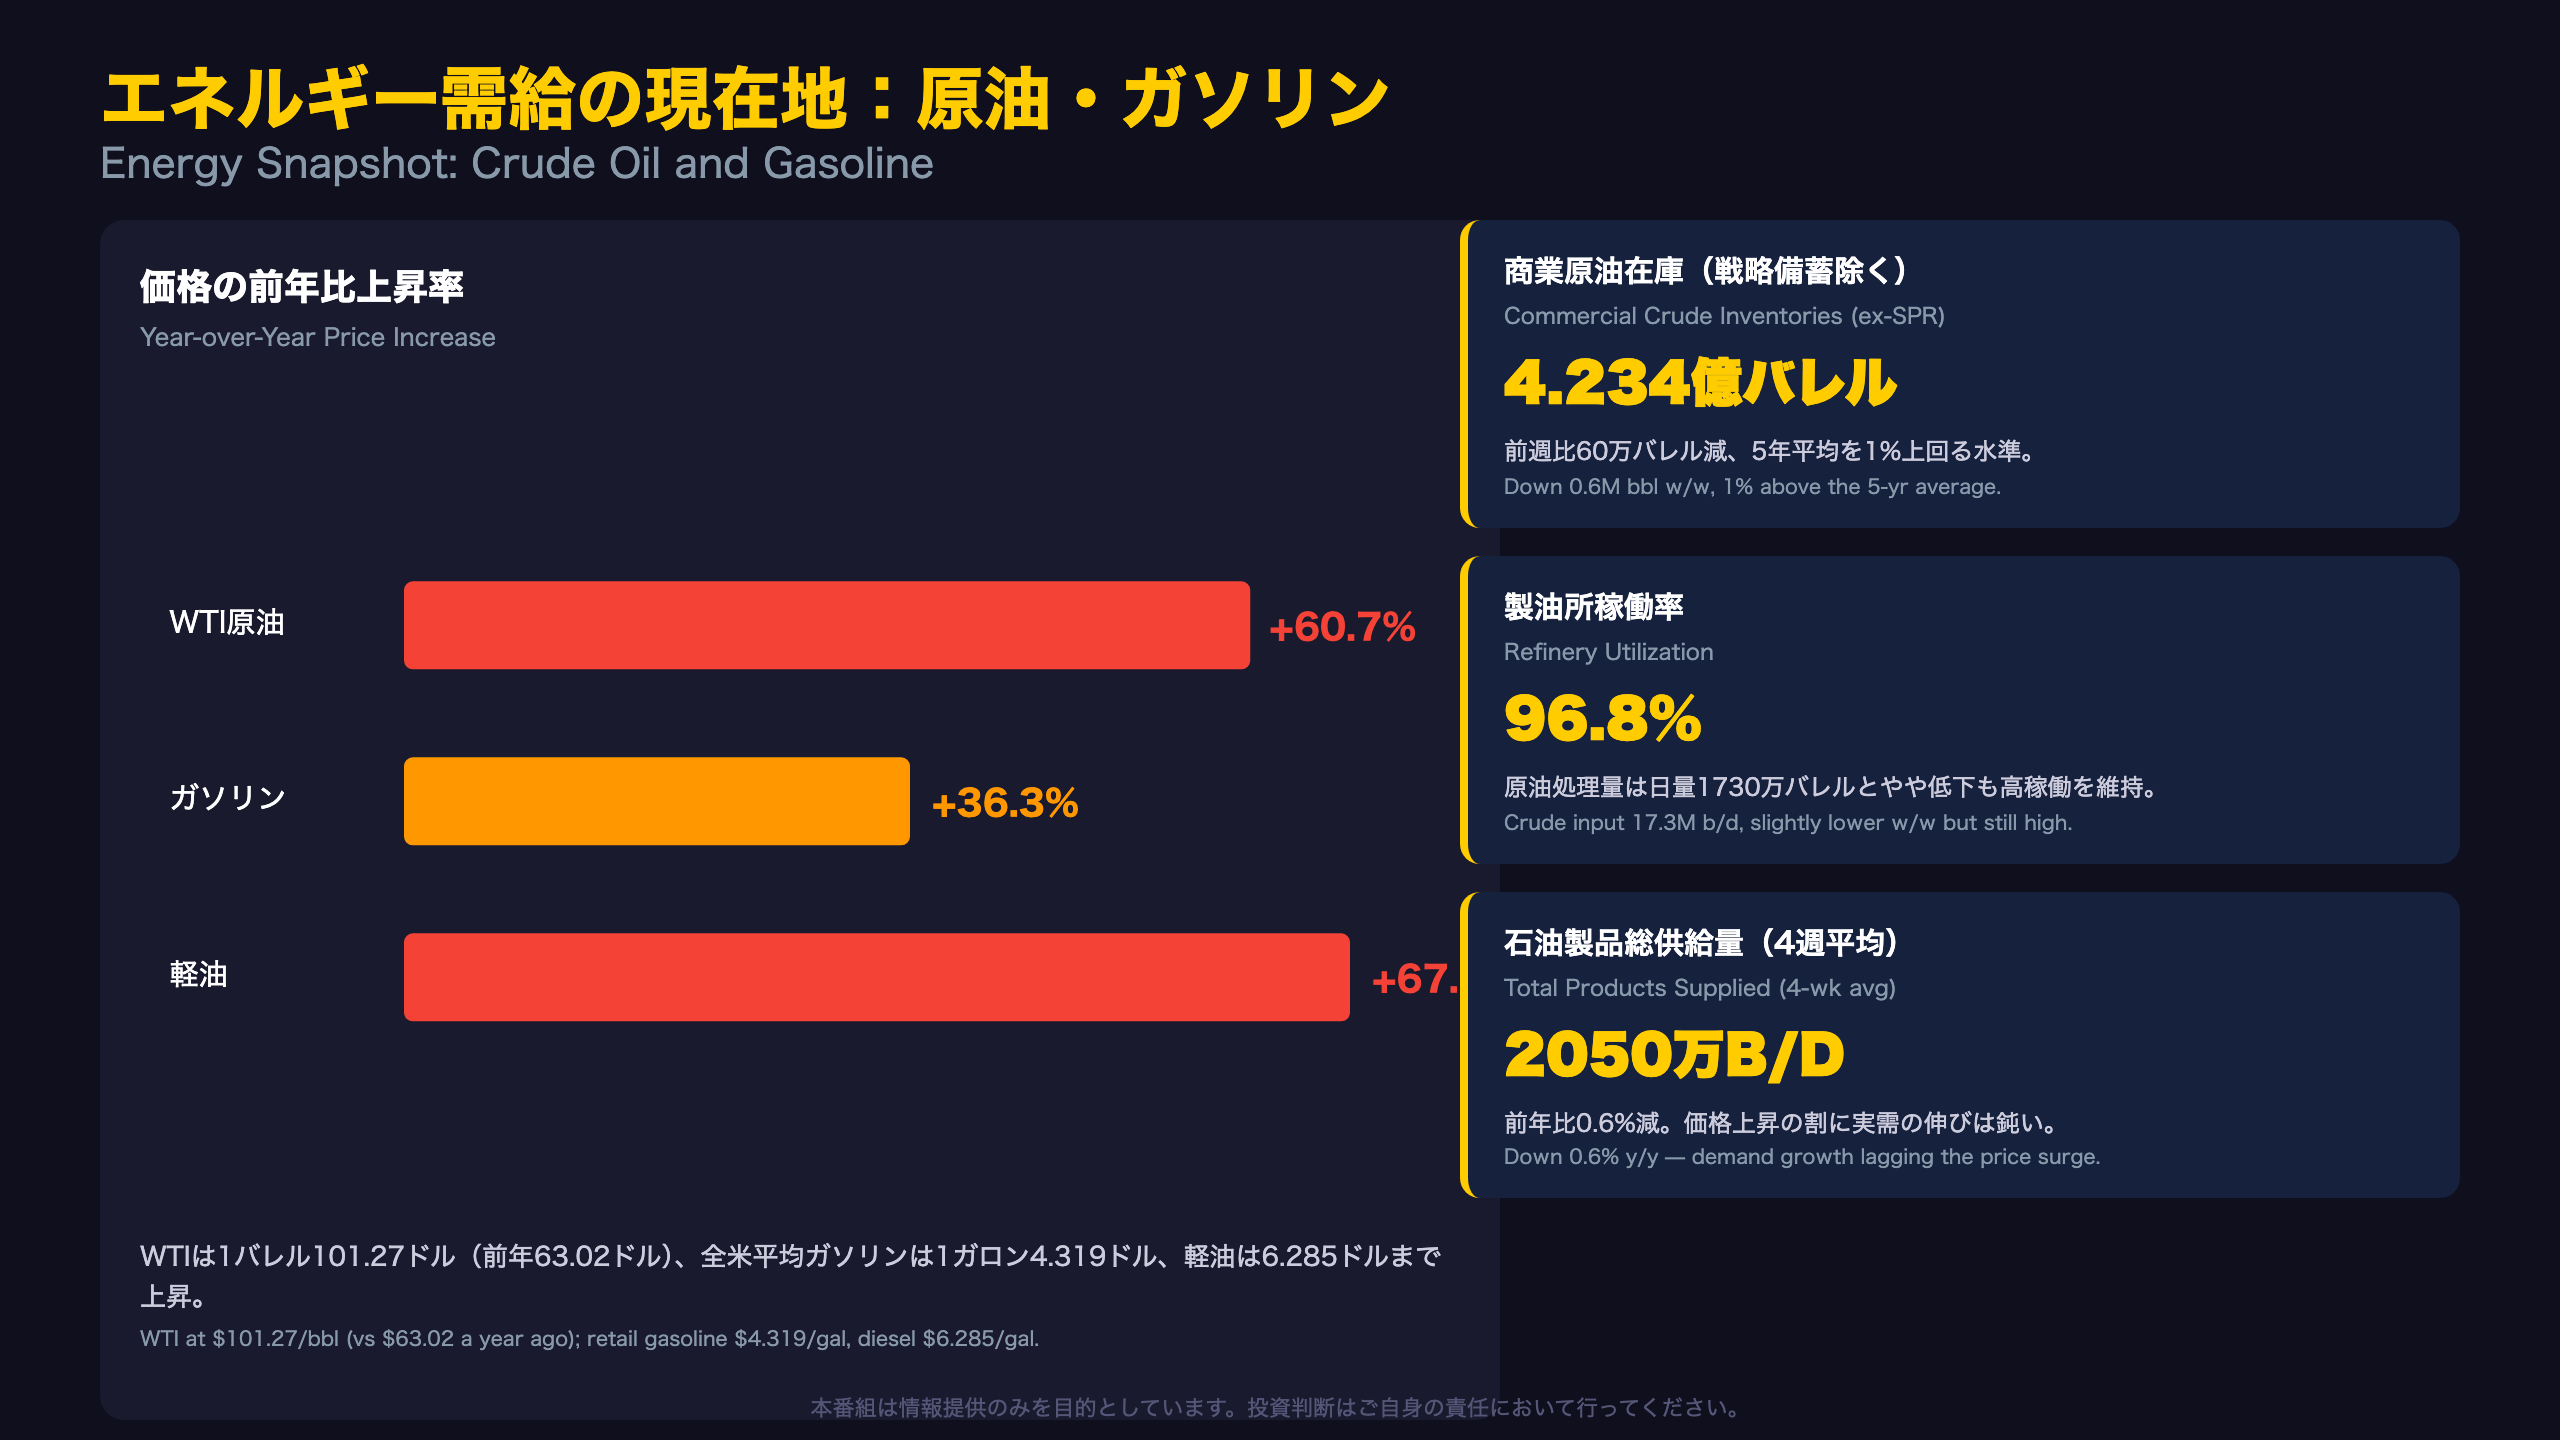
The headline this week is the sharp jump in WTI crude, up $8.58 in a single week to $101.27/barrel and up a striking $38.25 (60%) from $63.02 a year earlier. That’s a far steeper move than global benchmark Brent typically sees week-to-week, and it flows directly into retail gasoline, which averaged $4.319/gallon — up 36% year-over-year (from $3.173).
Beneath the price story, physical demand data is more mixed: the report states \”total product supplied averaged 20.5 million b/d, down 0.6% year over year,\” while jet fuel demand alone rose 4.4% y/y, reflecting resilient air travel even as overall fuel demand cools slightly. Refinery utilization, at 96.6% on a four-week average basis, is running well above the 93.9% seen a year ago — a bullish signal for refiner margins, even as crude throughput softened slightly week-to-week.
For markets, this combination — a supply-side price shock layered on flat-to-softening demand — looks more like a cost-push inflation risk than a demand-driven overheating story, a distinction that matters for how the Fed and bond markets interpret any near-term uptick in headline CPI.
FRB流動性の現在地(H.4.1詳細)
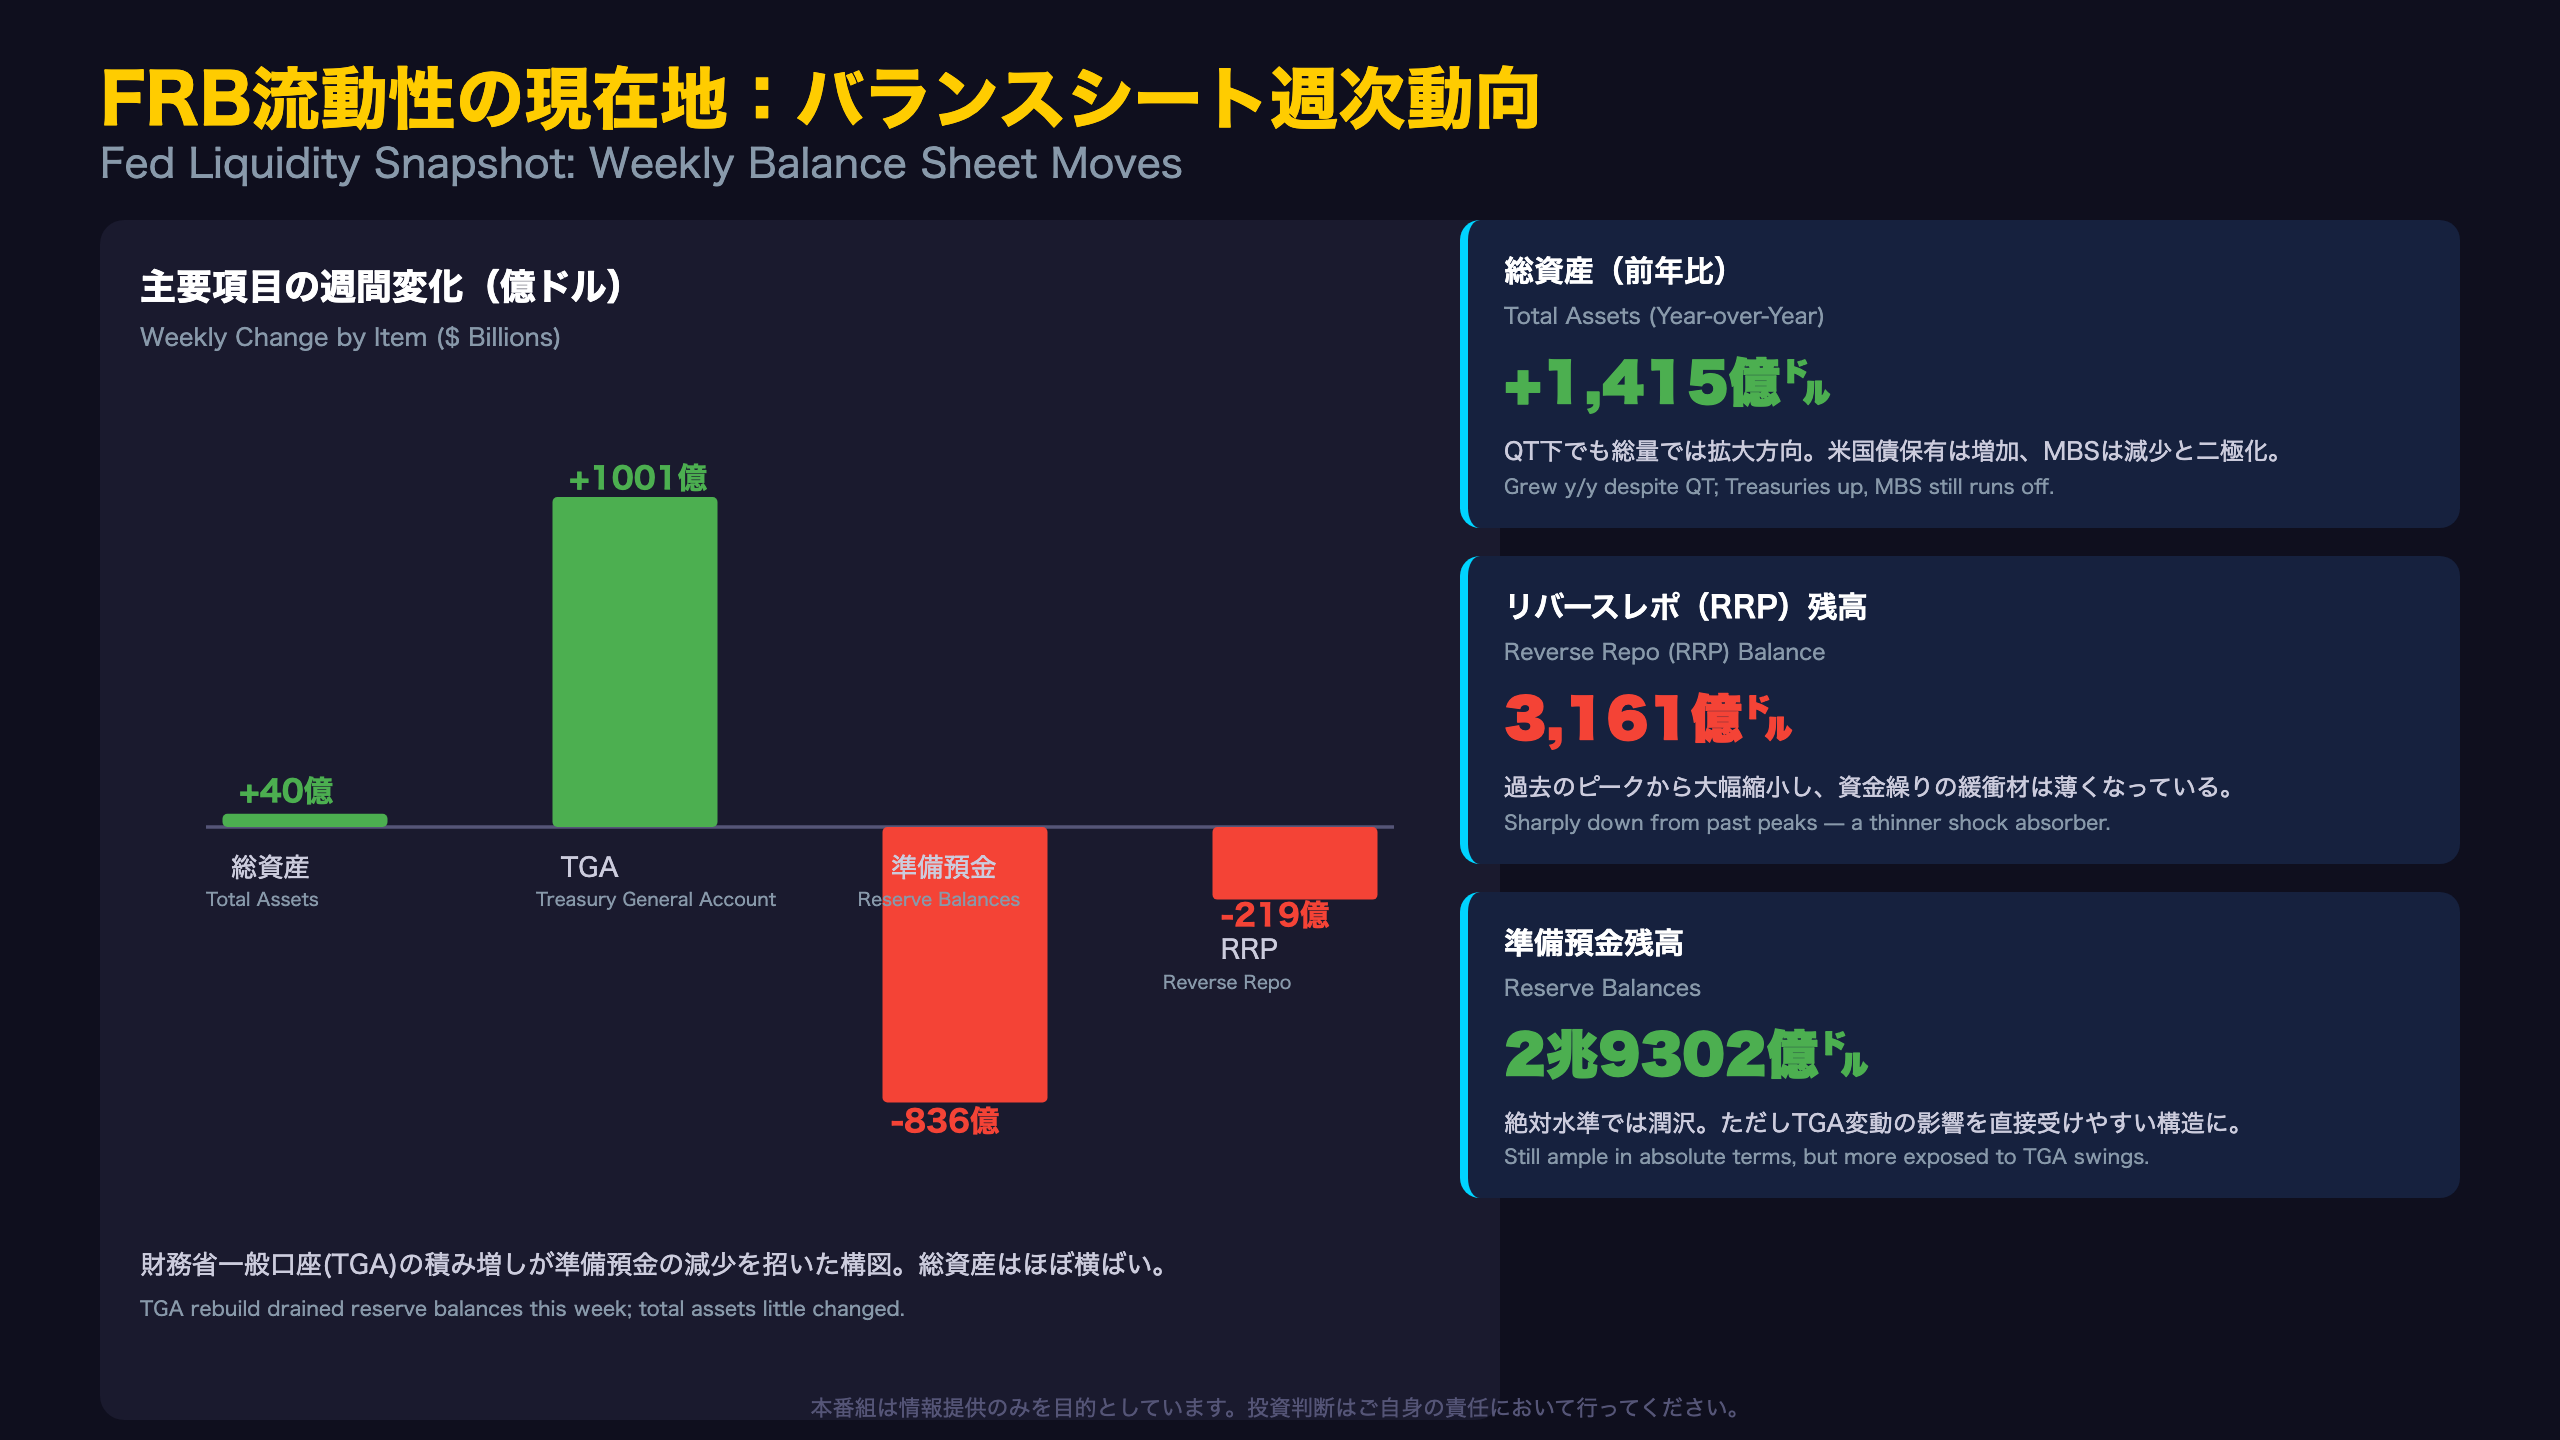
A detail easily missed in the headline balance sheet figures is the Fed’s \”earnings remittances due to the U.S. Treasury\” line, which stood at -$232,999 million (roughly -$233 billion) as of September 23. This negative figure represents a cumulative deferred asset: since 2022’s rate hikes pushed the Fed’s interest expense on reserves and RRP above its interest income from legacy low-yielding securities, the Fed has been running an accounting loss and cannot resume remitting profits to the Treasury until this deficit is earned back. This is a structural, if largely cosmetic, feature of the current high-rate environment rather than a solvency concern.
Looking at the securities composition, Treasury bills rose $358.3 billion year-over-year while inflation-protected TIPS holdings fell $32.3 billion, suggesting the Fed’s recent purchases (net of MBS runoff) have skewed toward nominal short-duration instruments rather than inflation hedges.
Among the twelve regional Reserve Banks, the New York Fed alone holds $3.598 trillion of the System’s $6.748 trillion in total assets — more than half — reflecting its role as the operational hub for open market operations and custody of foreign official securities holdings.
On stress indicators, usage of the Fed’s secondary credit facility (a barometer of acute bank funding stress) was just $4 million, essentially negligible — a reassuring sign that despite the reserve drawdown this week, the banking system shows no visible funding strain through this channel.
ストラテジスト総括:3指標の連関と来週の注目シナリオ

Summarizing the cross-currents for an international audience: US labor market data continues to signal resilience (a constructive backdrop for risk assets), while energy price data signals a fresh cost-push inflation risk (a headwind for rate-cut expectations), and Fed liquidity data shows an ample-but-thinning buffer (a technical, not systemic, risk factor).
| Indicator | Direction | Signal |
|---|---|---|
| Labor (DOL) | Improving | Resilient employment |
| Energy (EIA) | Sharply higher | Cost-push inflation risk |
| Fed Liquidity (H.4.1) | Ample in aggregate, tight weekly | Technical funding risk |
For FX markets, if energy-driven inflation concerns cause the Fed to slow its easing cycle, that could provide modest support for the US dollar broadly, while commodity-linked currencies such as the Canadian dollar and Brazilian real may benefit directly from higher crude prices.
In equities, energy sector earnings could see a tailwind from higher realized prices, while consumer discretionary names may face pressure as higher gasoline and diesel costs erode household purchasing power — a classic sector-rotation dynamic tied to energy price shocks.
In rates markets, short-end Treasury yields may prove more sensitive to technical liquidity swings (driven by TGA rebuilding and a shrinking reverse repo buffer) than to core inflation data alone in the immediate term, while headline CPI’s energy component is likely to dominate the near-term inflation narrative that the Fed and bond investors watch most closely.
Disclaimer: This article is for informational purposes only. All investment decisions are made solely at your own risk.