
📺 Watch the Full Video Analysis
This article was automatically generated by the NFC Market Live AI analysis system. (Updated: 2026-09-17 05:54 JST)
🏠 Deep dive into Lennar Corporation’s (NYSE: LEN) Q3 FY2026 earnings.
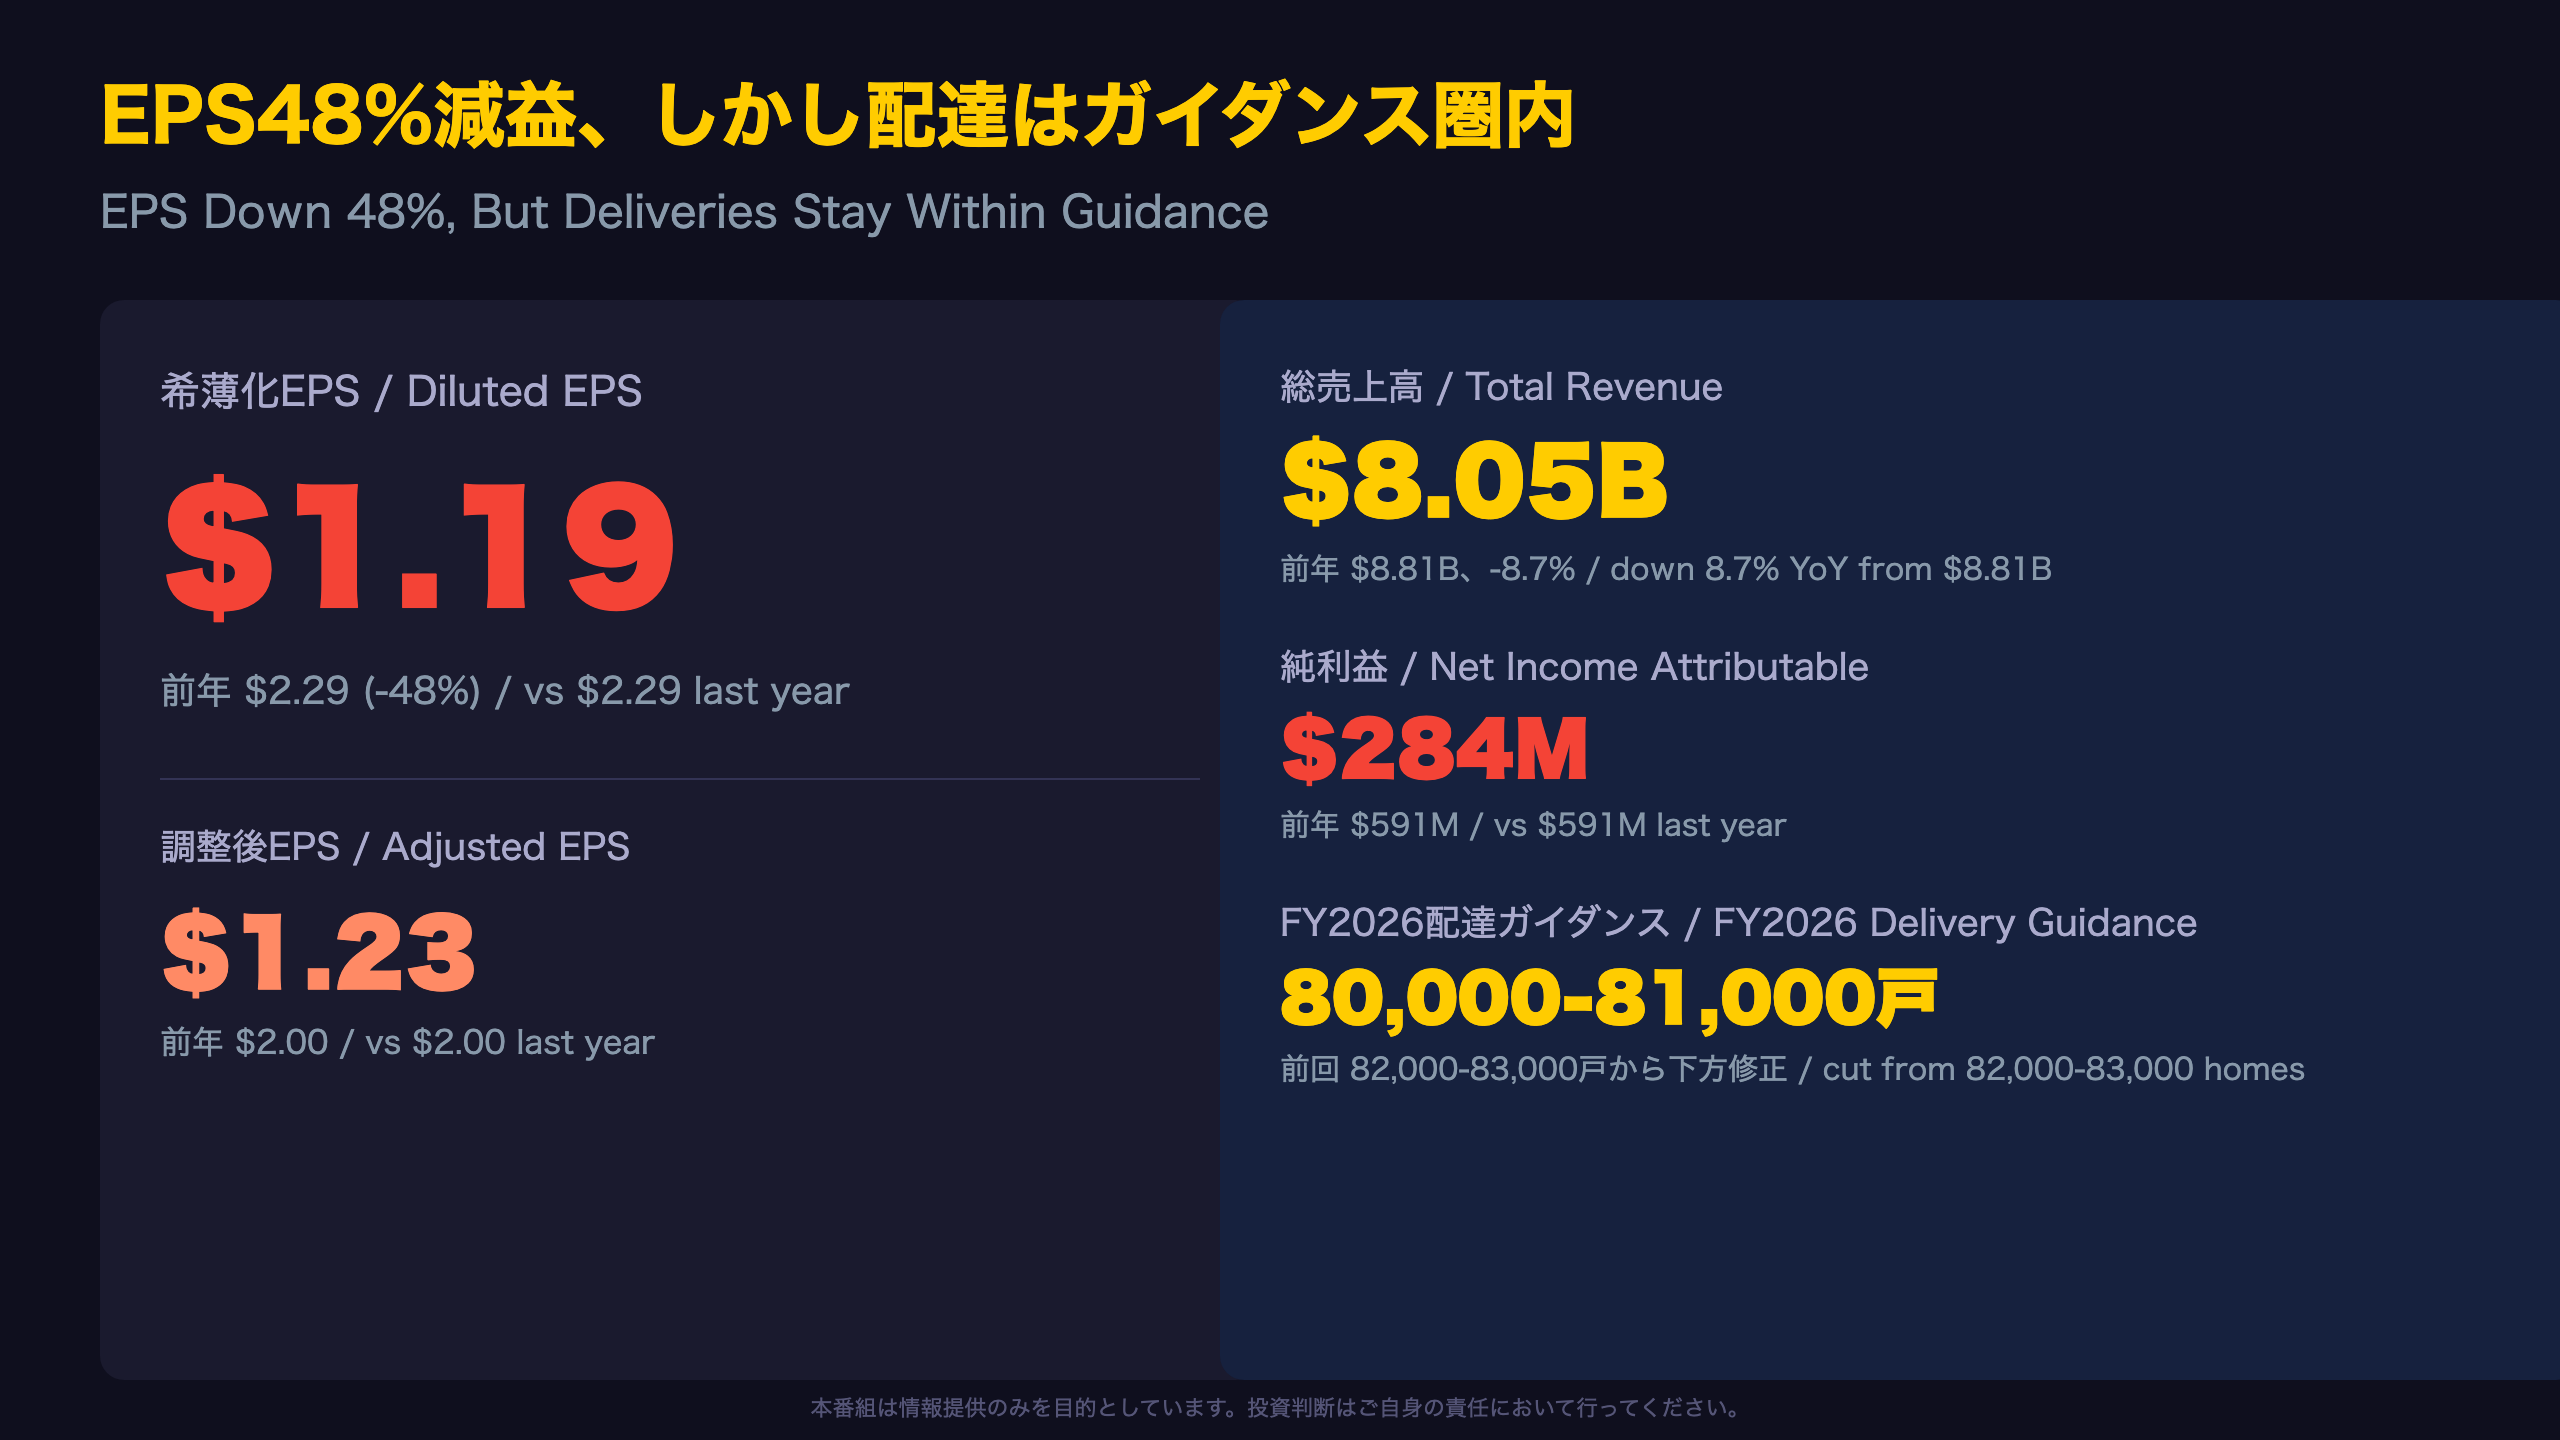
📉 Diluted EPS came in at $1.19, down 48% YoY from $2.29. Total revenue fell 8.7% YoY to $8.0 billion.
📦 Yet deliveries of 20,840 homes landed within the company’s own 20,500-21,500 guidance range.
⚙️ Construction cycle time hit a record-low 116 days, showing continued operational efficiency gains.
⚠️ With 30-year mortgage rates near 6.8% at quarter-end, Lennar cut its full-year delivery target to 80,000-81,000 homes from 82,000-83,000.
💡 A balanced, data-driven look at the strengths and cracks beneath Lennar’s volume-first strategy.
EPS48%減益、しかし配達はガイダンス圏内
Headline Numbers
Lennar Corporation (NYSE: LEN), one of America’s largest homebuilders, reported Q3 fiscal 2026 (quarter ended August 31, 2026) diluted EPS of $1.19, down roughly 48% from $2.29 in the prior-year quarter. Excluding $53 million in mark-to-market losses on technology investments and $39 million in one-time Financial Services items, adjusted EPS was $1.23, still below last year’s adjusted $2.00.
Revenue Breakdown
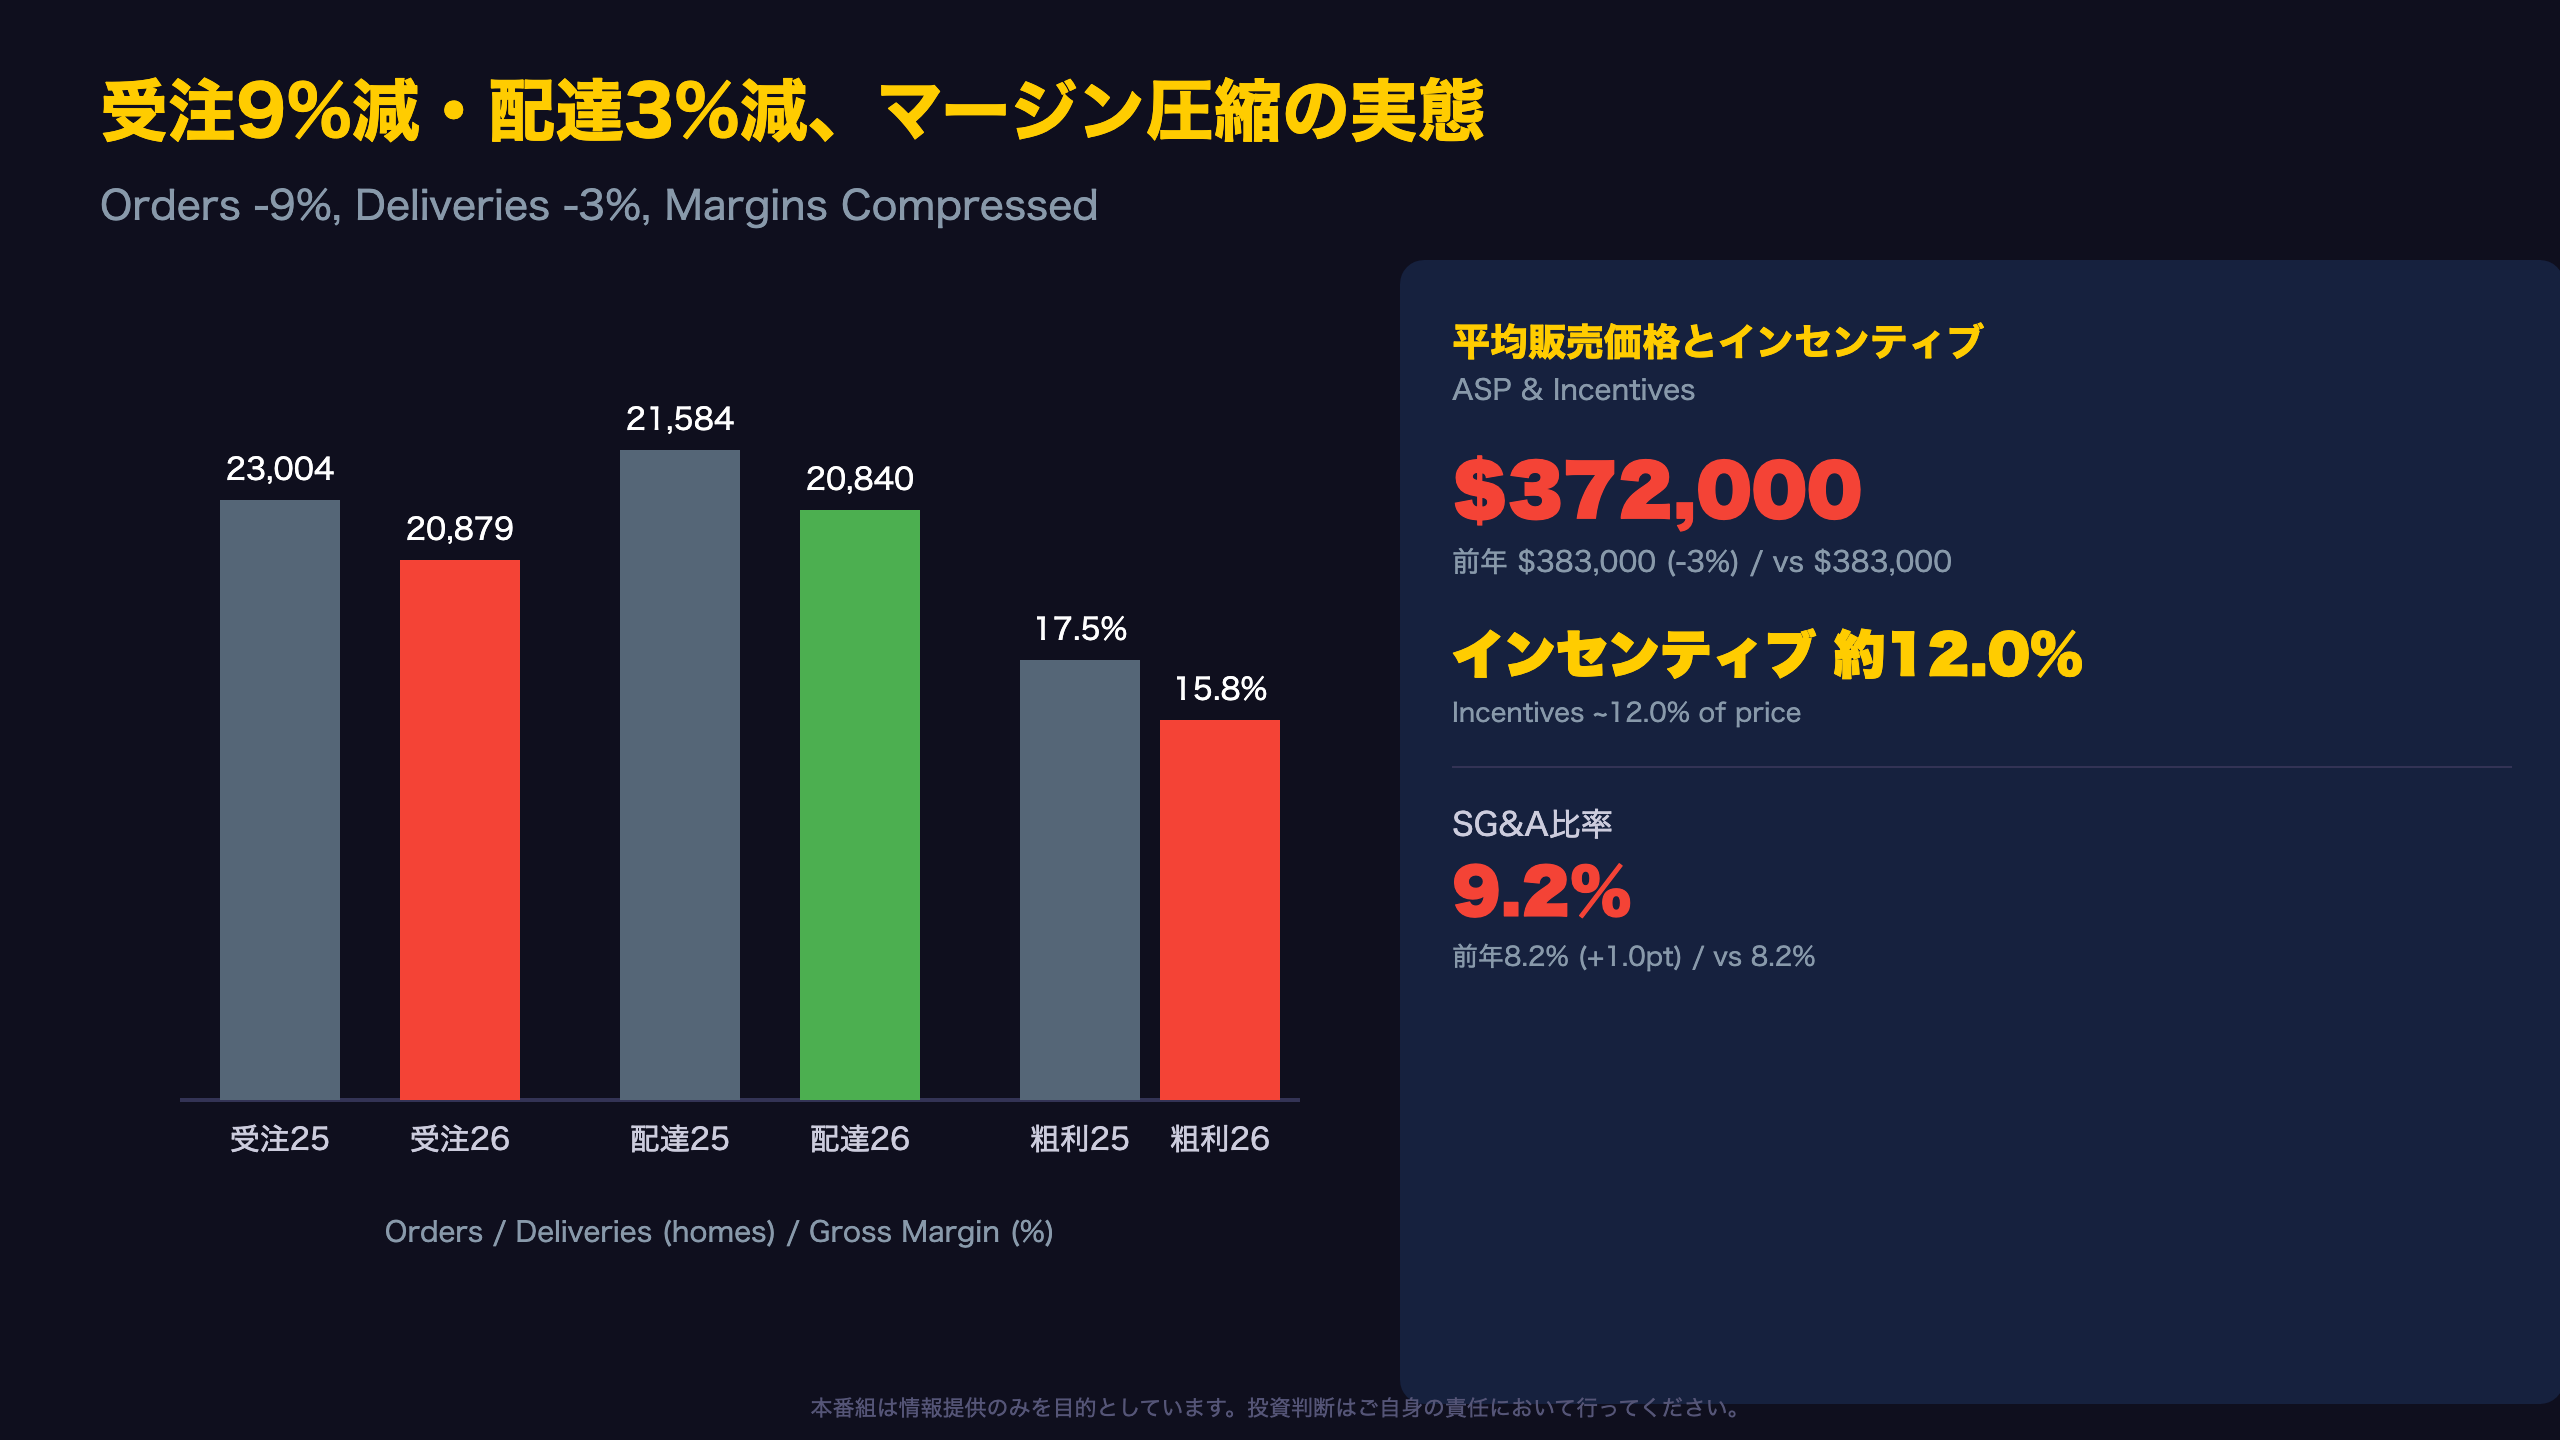
Total revenue fell 8.7% YoY to $8.05 billion from $8.81 billion. Homebuilding revenue dropped to $7.76 billion from $8.25 billion, driven by both a 3% decline in deliveries (21,584 to 20,840 homes) and a 3% drop in average sales price ($383,000 to $372,000).
Context for International Readers
Unlike many US homebuilders reporting under calendar quarters, Lennar’s fiscal year ends November 30, so this “Q3” covers June-August 2026 — the peak of the US home-buying season, making the miss more notable.
Bull vs. Bear Read
Bears will note net income nearly halved and the full-year delivery target was cut to 80,000-81,000 homes from 82,000-83,000. Bulls counter that deliveries of 20,840 still landed inside management’s own 20,500-21,500 guidance — evidence the volume-first strategy is holding even as margins compress. The next data point to watch is Lennar’s Q4 FY2026 report, expected around mid-December 2026.
受注9%減・配達3%減、マージン圧縮の実態
Slowing Demand on Both Sides
New orders fell 9.2% YoY to 20,879 homes from 23,004, with declines across every reporting region (East, Central, South Central, West). Deliveries dropped 3.4% to 20,840 from 21,584 — but crucially, that number landed inside management’s pre-announced guidance range of 20,500-21,500 homes, a sign the company avoided a bigger operational miss.
Price-Margin Trade-off
Average sales price fell about 3% to $372,000 from $383,000, while buyer incentives expanded to roughly 12.0% of price — well above what US homebuilders typically offered before the 2022 rate-hiking cycle. Management explicitly frames this as “base price adjustments necessary to sustain volume” in an affordability-constrained market.
Regional Divergence
A notable sub-trend: East region ASP actually rose ($366,000 to $372,000), while Central ($379,000 to $365,000) and West ($599,000 to $571,000) both fell — suggesting regional demand strength is uneven rather than uniformly weak.
Margin Mechanics
Gross margin on home sales fell 170bps to 15.8% from 17.5%, and SG&A leverage worsened 100bps to 9.2% from 8.2% “primarily due to less leverage as a result of lower revenues.” Importantly, the filing states construction costs themselves declined — the margin pressure stems from pricing and land costs, not building costs. This nuance matters for US investors comparing Lennar to peers like D.R. Horton or PulteGroup, where cost discipline is often the primary margin lever.
生産効率は過去最短、しかし金利6.8%が需要に影
Are the Efficiency Gains Real?
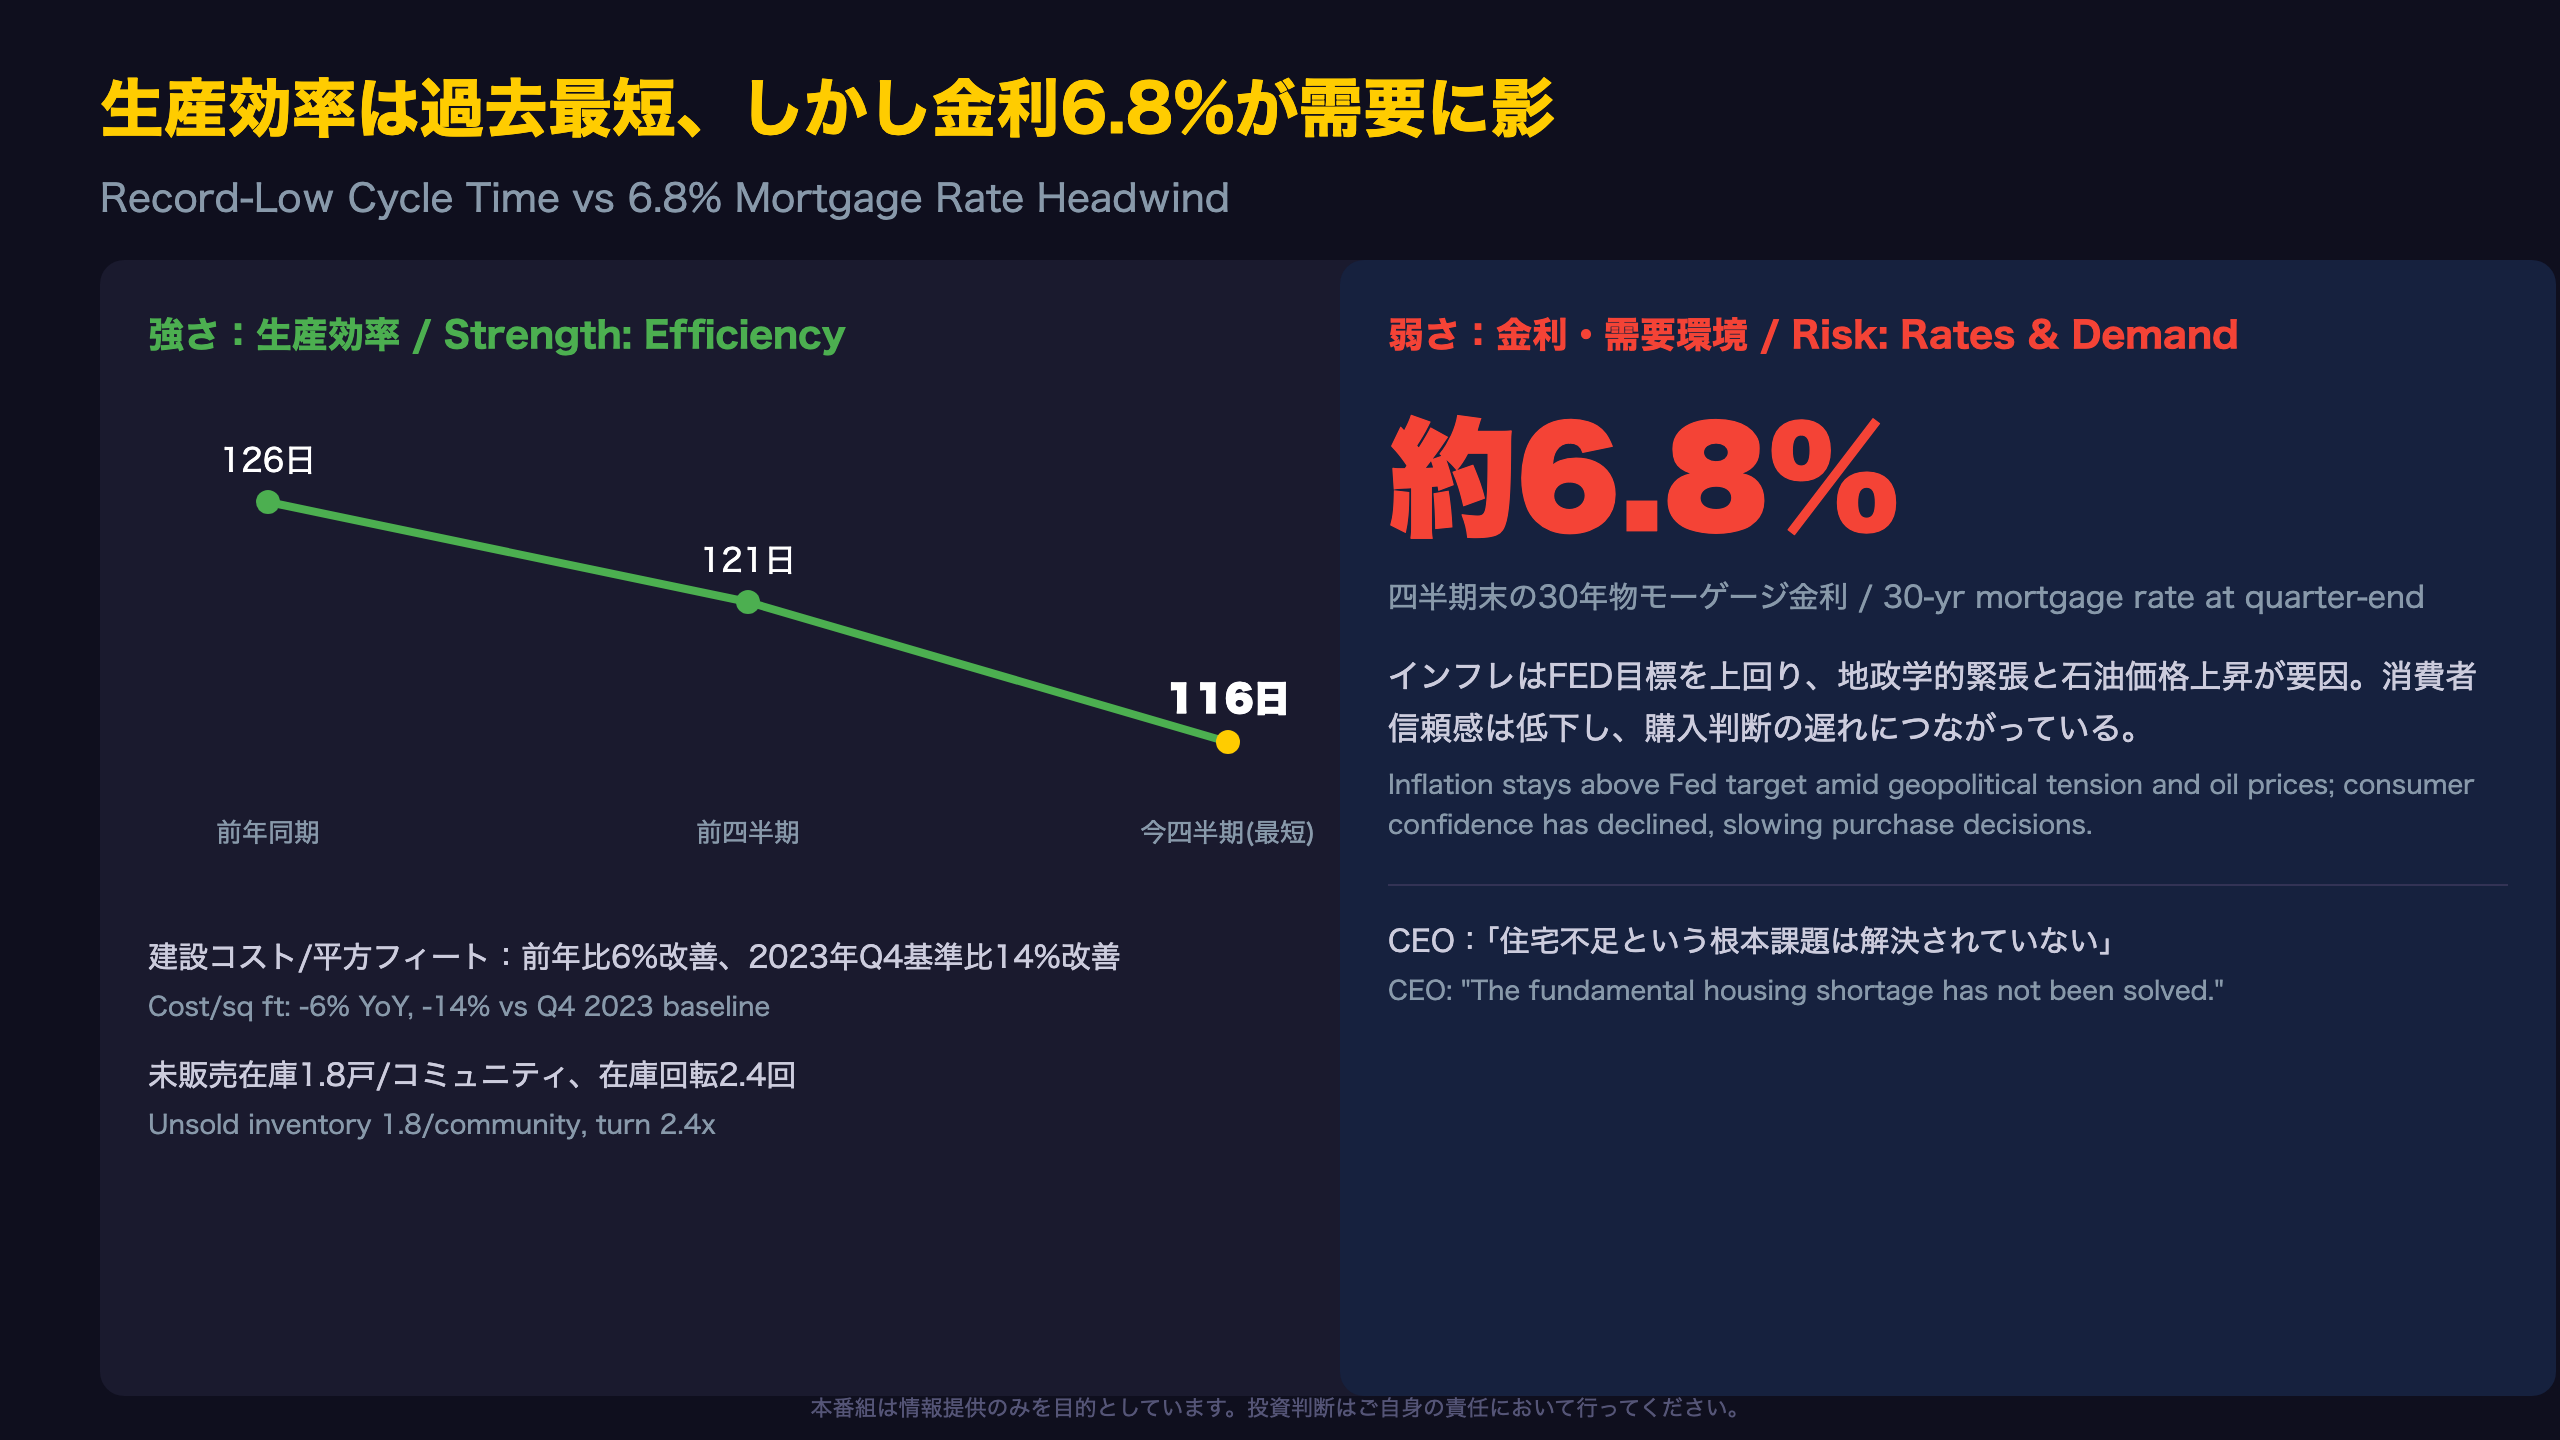
Lennar’s 116-day construction cycle time is explicitly labeled a record low, continuing a consistent downtrend from 121 days last quarter and 126 days a year ago. Cost per square foot also improved across three separate time horizons — 1% sequentially, 6% year over year, and 14% since the Q4 2023 baseline — a pattern of sustained (not one-off) operational discipline.
Inventory Discipline and the “Land Light” Model
Completed, unsold inventory fell to 1.8 homes per community from 2.1, with inventory turnover at 2.4x. Of the roughly 488,000 homesites Lennar owns or controls, less than 2.5% sit on its own balance sheet — a capital-light land strategy that differentiates it from more land-heavy peers and reduces balance-sheet risk if home prices fall further.
Management’s Own Words on Demand
CEO Stuart Miller stated the “fundamental shortage of housing in America has not been solved,” pointing to demand not just from traditional buyers but also from “single-family for rent” and “build-to-rent” investors — a structural demand source most legacy US housing-cycle analysis tends to underweight.
The Other Side of the Ledger
However, the same release states 30-year mortgage rates reached approximately 6.8% by quarter-end and “even higher since,” with inflation running above the Fed’s target amid geopolitical tension and higher oil prices. For US-focused investors, this mirrors the tension the Fed itself faces: efficiency gains are real, but they are running directly against an affordability headwind that is not fully within the company’s control.
現金34億→11億ドルへ、テック評価損が損益を直撃
Financial Services: Weaker Than the Headline Suggests
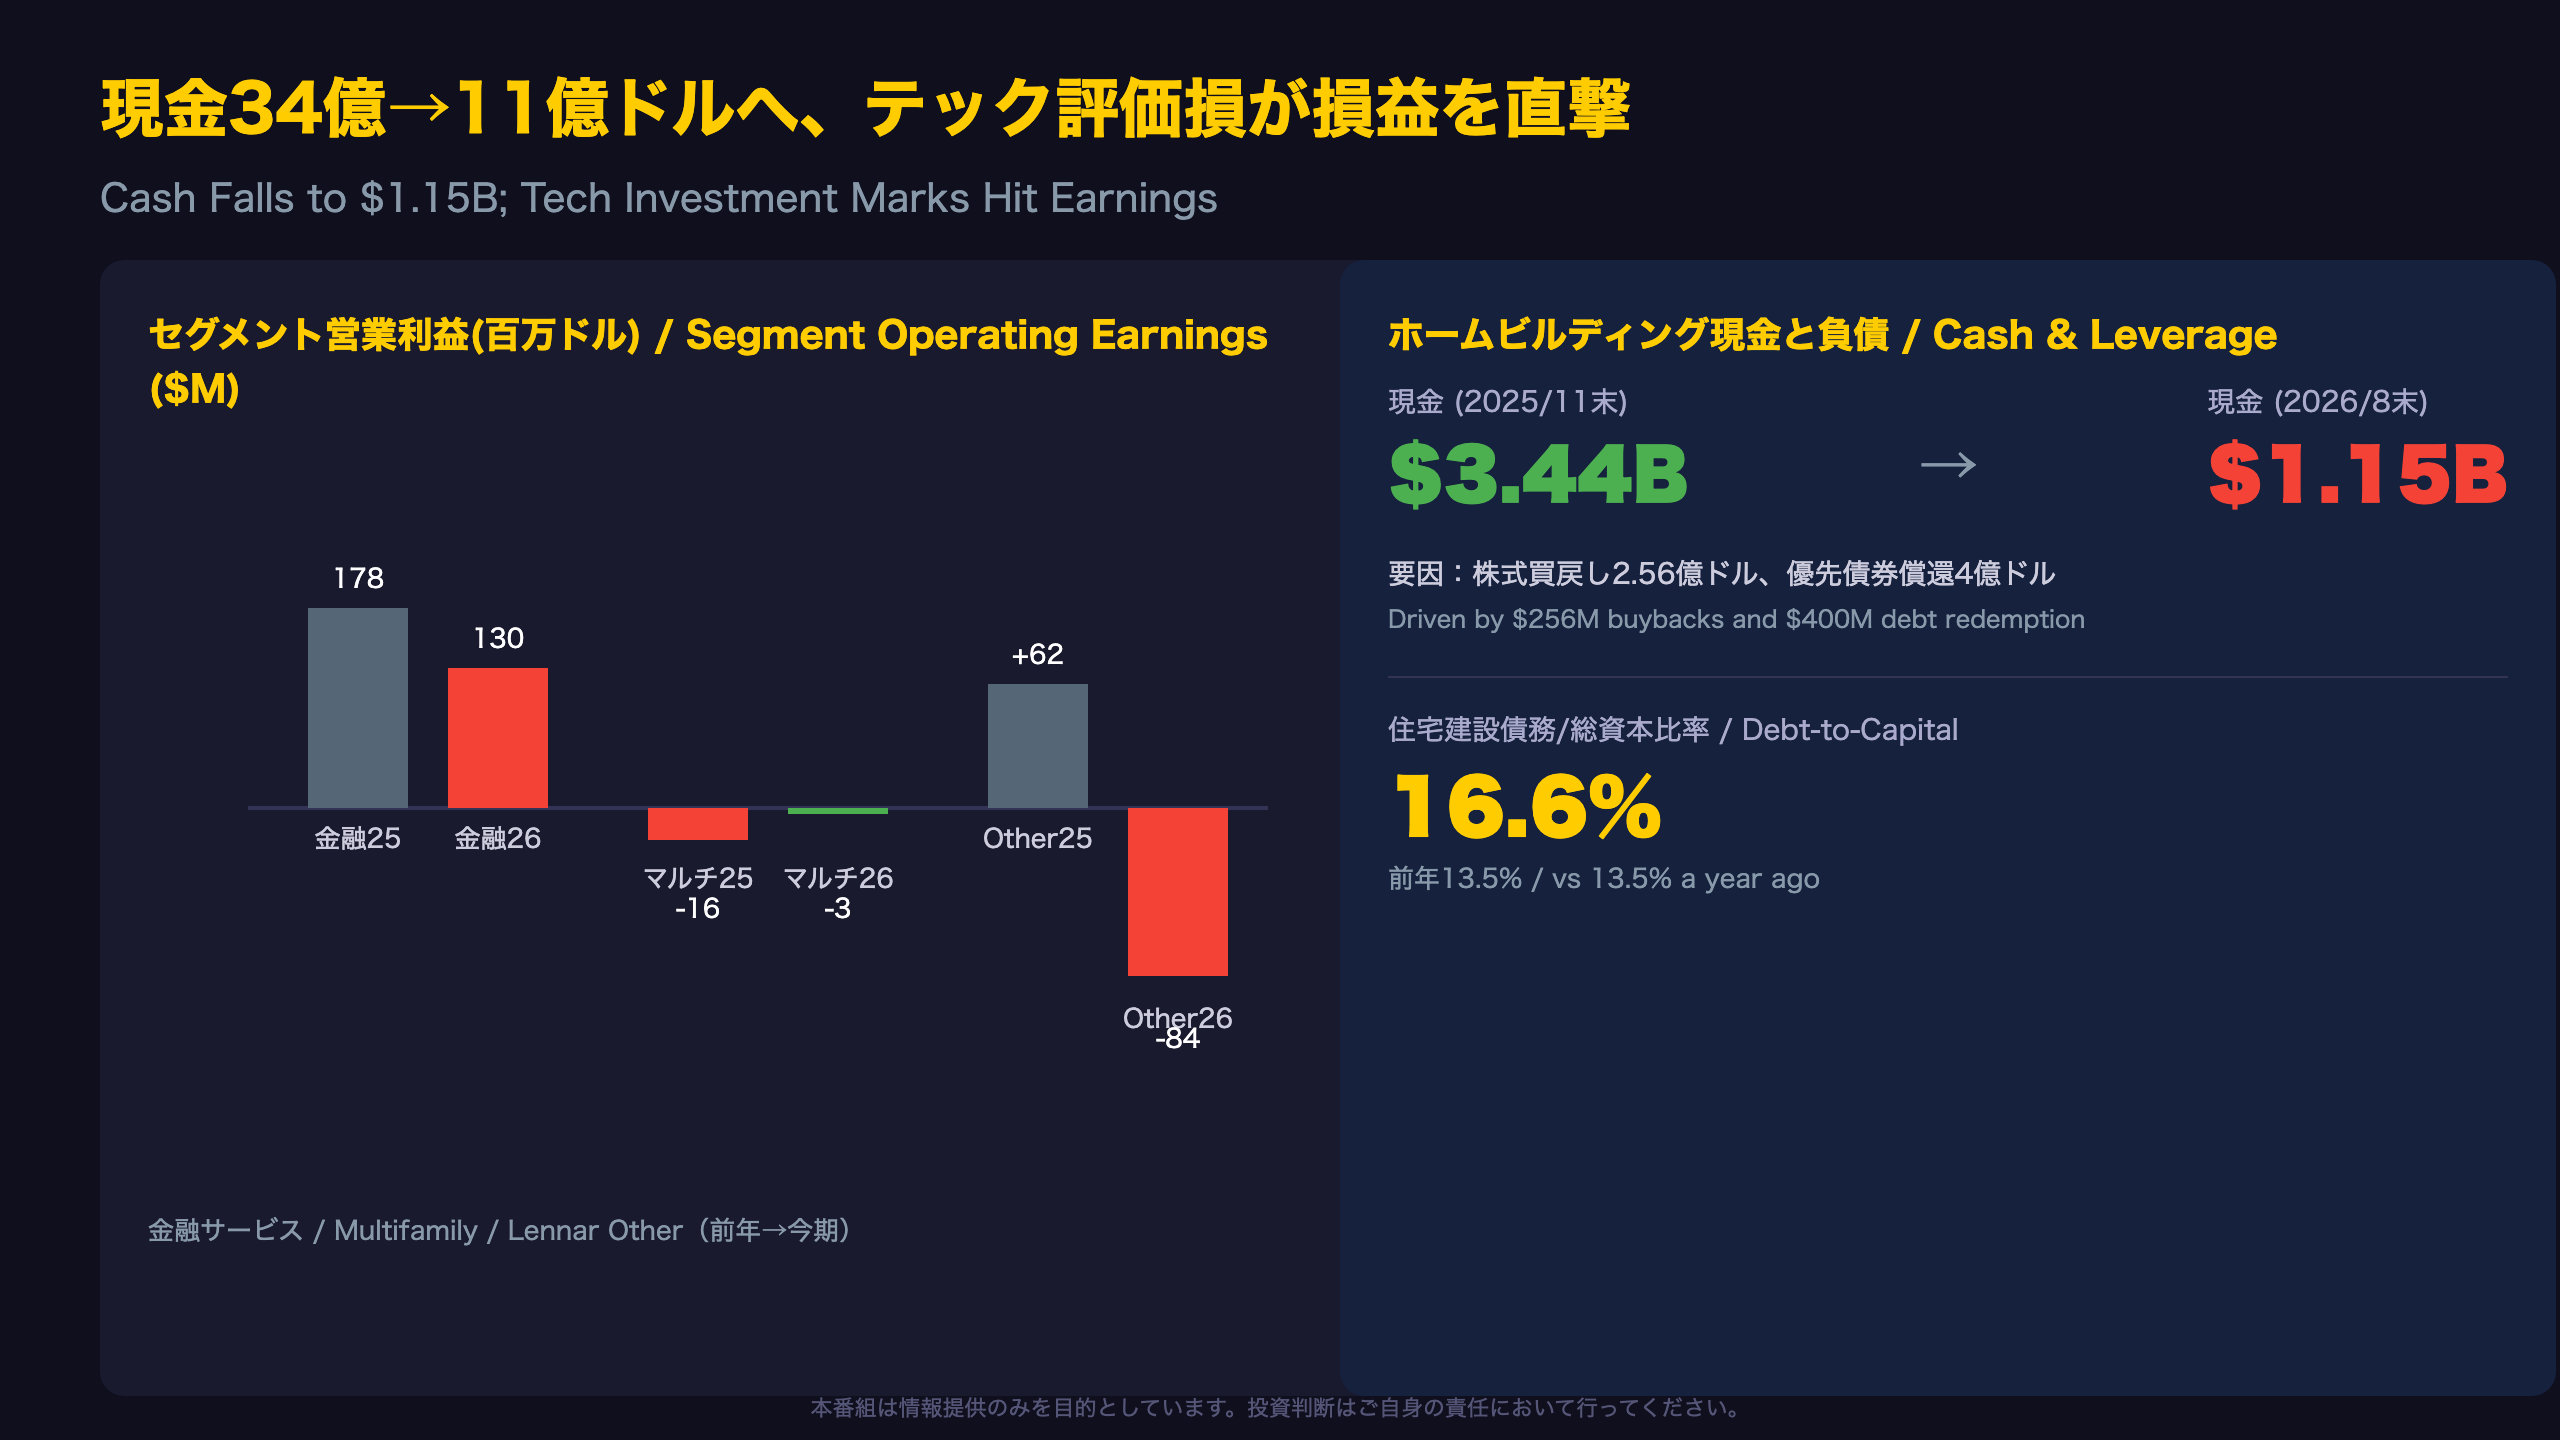
Financial Services operating earnings of $130 million included a $39 million one-time litigation accrual reversal. Strip that out, and underlying operating earnings were closer to $91 million versus $178 million a year ago — a materially larger decline than the headline -27% figure implies. The filing attributes this to “lower profit per locked loan and lower lock volume in the mortgage business,” a direct read-through of higher mortgage rates on Lennar’s captive lending arm.
Tech Investment Marks: A Second Source of Volatility
The Lennar Other segment swung from a $62 million profit to an $84 million loss, entirely explained by a $53 million mark-to-market loss on technology investments versus a $99 million gain in the prior-year quarter — a roughly $152 million swing unrelated to the core homebuilding business. For US investors, this is a reminder that Lennar’s bottom line carries a non-operating, market-driven volatility layer distinct from housing fundamentals, similar to how corporate venture portfolios (e.g., at other diversified industrials) can distort headline EPS.
Balance Sheet Shift
Homebuilding cash fell from $3.44 billion at fiscal year-start (Nov 30, 2025) to $1.15 billion, driven by $256 million in buybacks (3 million shares at an average $85.49) and $400 million in senior note redemptions. Homebuilding debt-to-total-capital rose to 16.6% from 13.5% a year ago, and net debt-to-capital jumped to 12.7% from just 2.8% at fiscal year-start. Compared to US peers, this leverage level remains conservative in absolute terms, but the trajectory — rising leverage alongside falling margins — is worth monitoring into Q4.
Q4ガイダンスと通期目標下方修正
Q4 Guidance Details
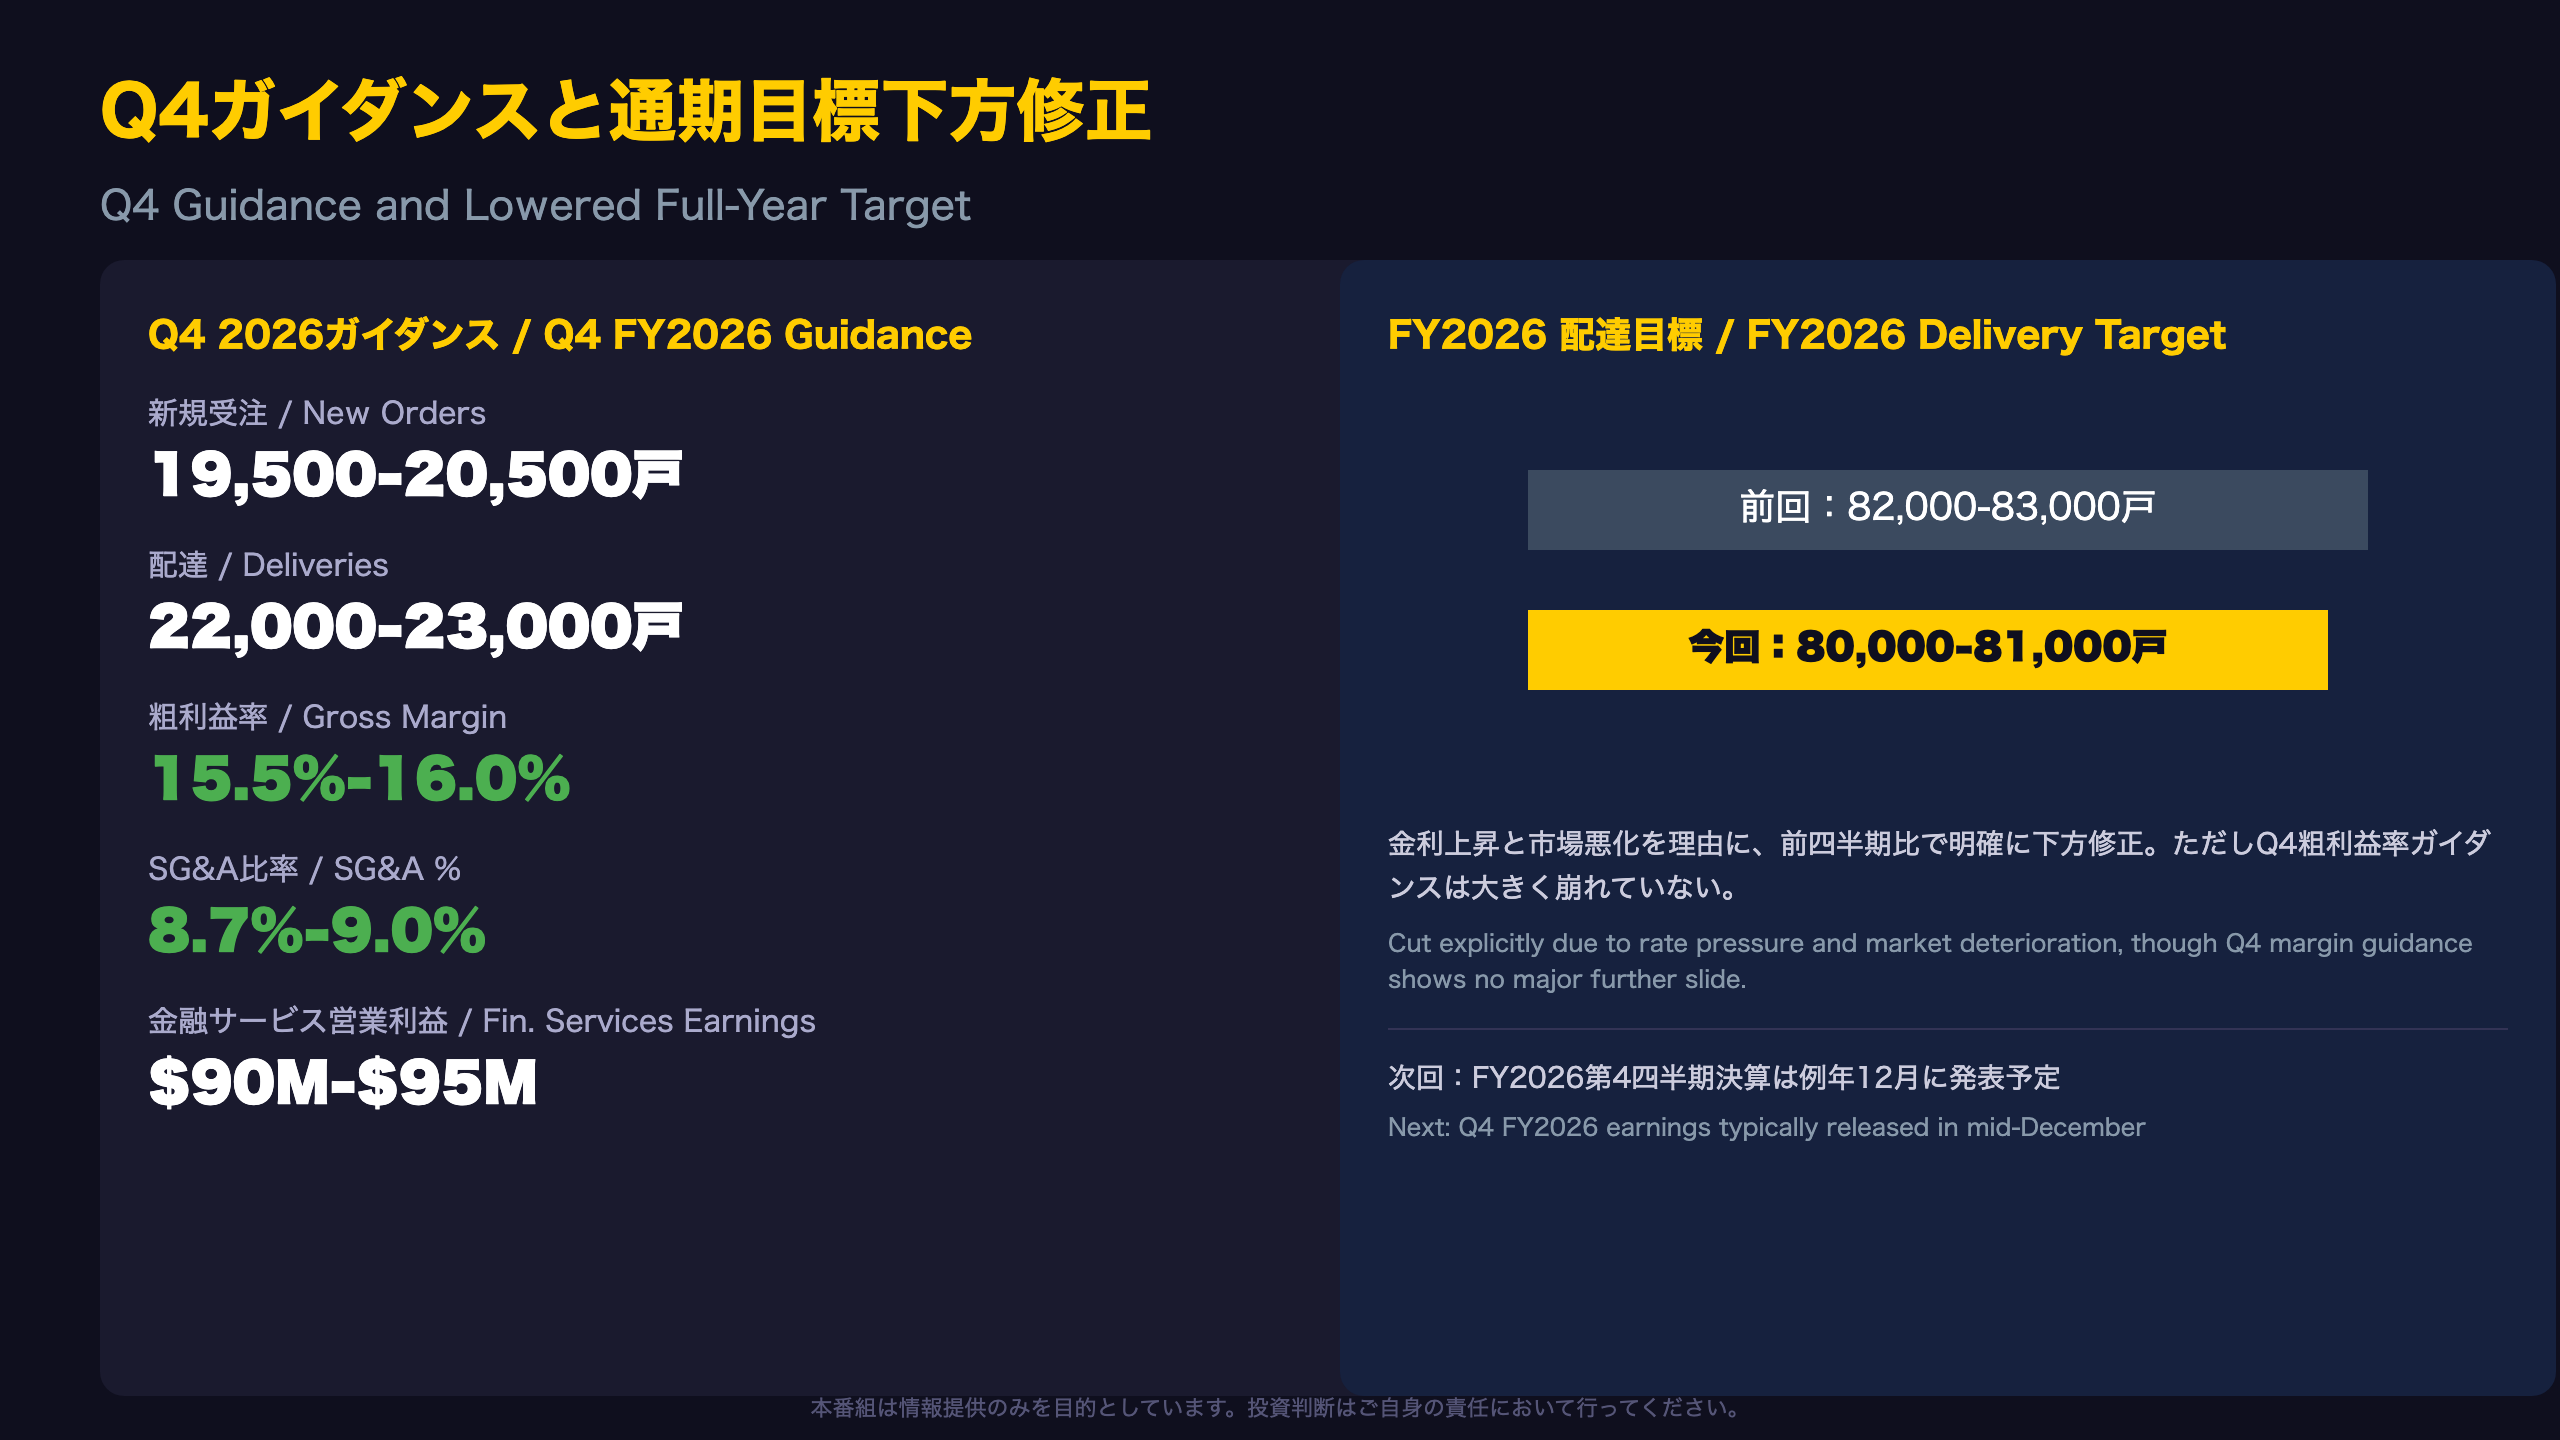
For Q4 fiscal 2026 (Lennar’s fiscal year ends November 30), management guides to new orders of 19,500-20,500 homes, deliveries of 22,000-23,000 homes, average sales price of $370,000-$380,000, gross margin of 15.5%-16.0%, SG&A of 8.7%-9.0%, and Financial Services operating earnings of $90-95 million. Notably, the SG&A guidance floor of 8.7% implies sequential improvement from this quarter’s 9.2% — a detail worth tracking given SG&A leverage has been a drag all year.
What the Full-Year Cut Really Means
The full-year delivery target was lowered to 80,000-81,000 homes from the 82,000-83,000 range discussed just one quarter earlier — a meaningful downward revision within a single quarter, explicitly tied to “continued pressure on interest rates and the deterioration in market conditions through the quarter.”
CEO Stuart Miller: “Given continued pressure on interest rates and the deterioration in market conditions through the quarter, we are moderating our target full-year 2026 deliveries to approximately 80,000 to 81,000 homes, from the 82,000 to 83,000 homes we discussed last quarter.”
Balancing the Bull and Bear Case
Bears can point to a triple headwind this quarter: EPS nearly halved, gross margin compressed 170bps, and the full-year target was cut. Bulls will note deliveries still met guidance, Q4 gross margin guidance of 15.5%-16.0% shows no further material deterioration, and structural cost/cycle-time improvements continued uninterrupted.
What Comes Next
Lennar’s Q4 FY2026 earnings are typically released in mid-to-late December. Key watch items: whether the 80,000-81,000 home delivery target is achieved, whether the 30-year mortgage rate climbs further above its current ~6.8% level, and whether incentives extend beyond the current ~12% of price.
Disclaimer: This article is for informational purposes only. All investment decisions are made solely at your own risk.