📺 Watch the Full Video Analysis
This article was automatically generated by the NFC Market Live AI analysis system. (Updated: 2026-09-11 21:52 JST)
📄 Primary Source
U.S. Bureau of Labor Statistics
https://www.bls.gov/news.release/cpi.htm
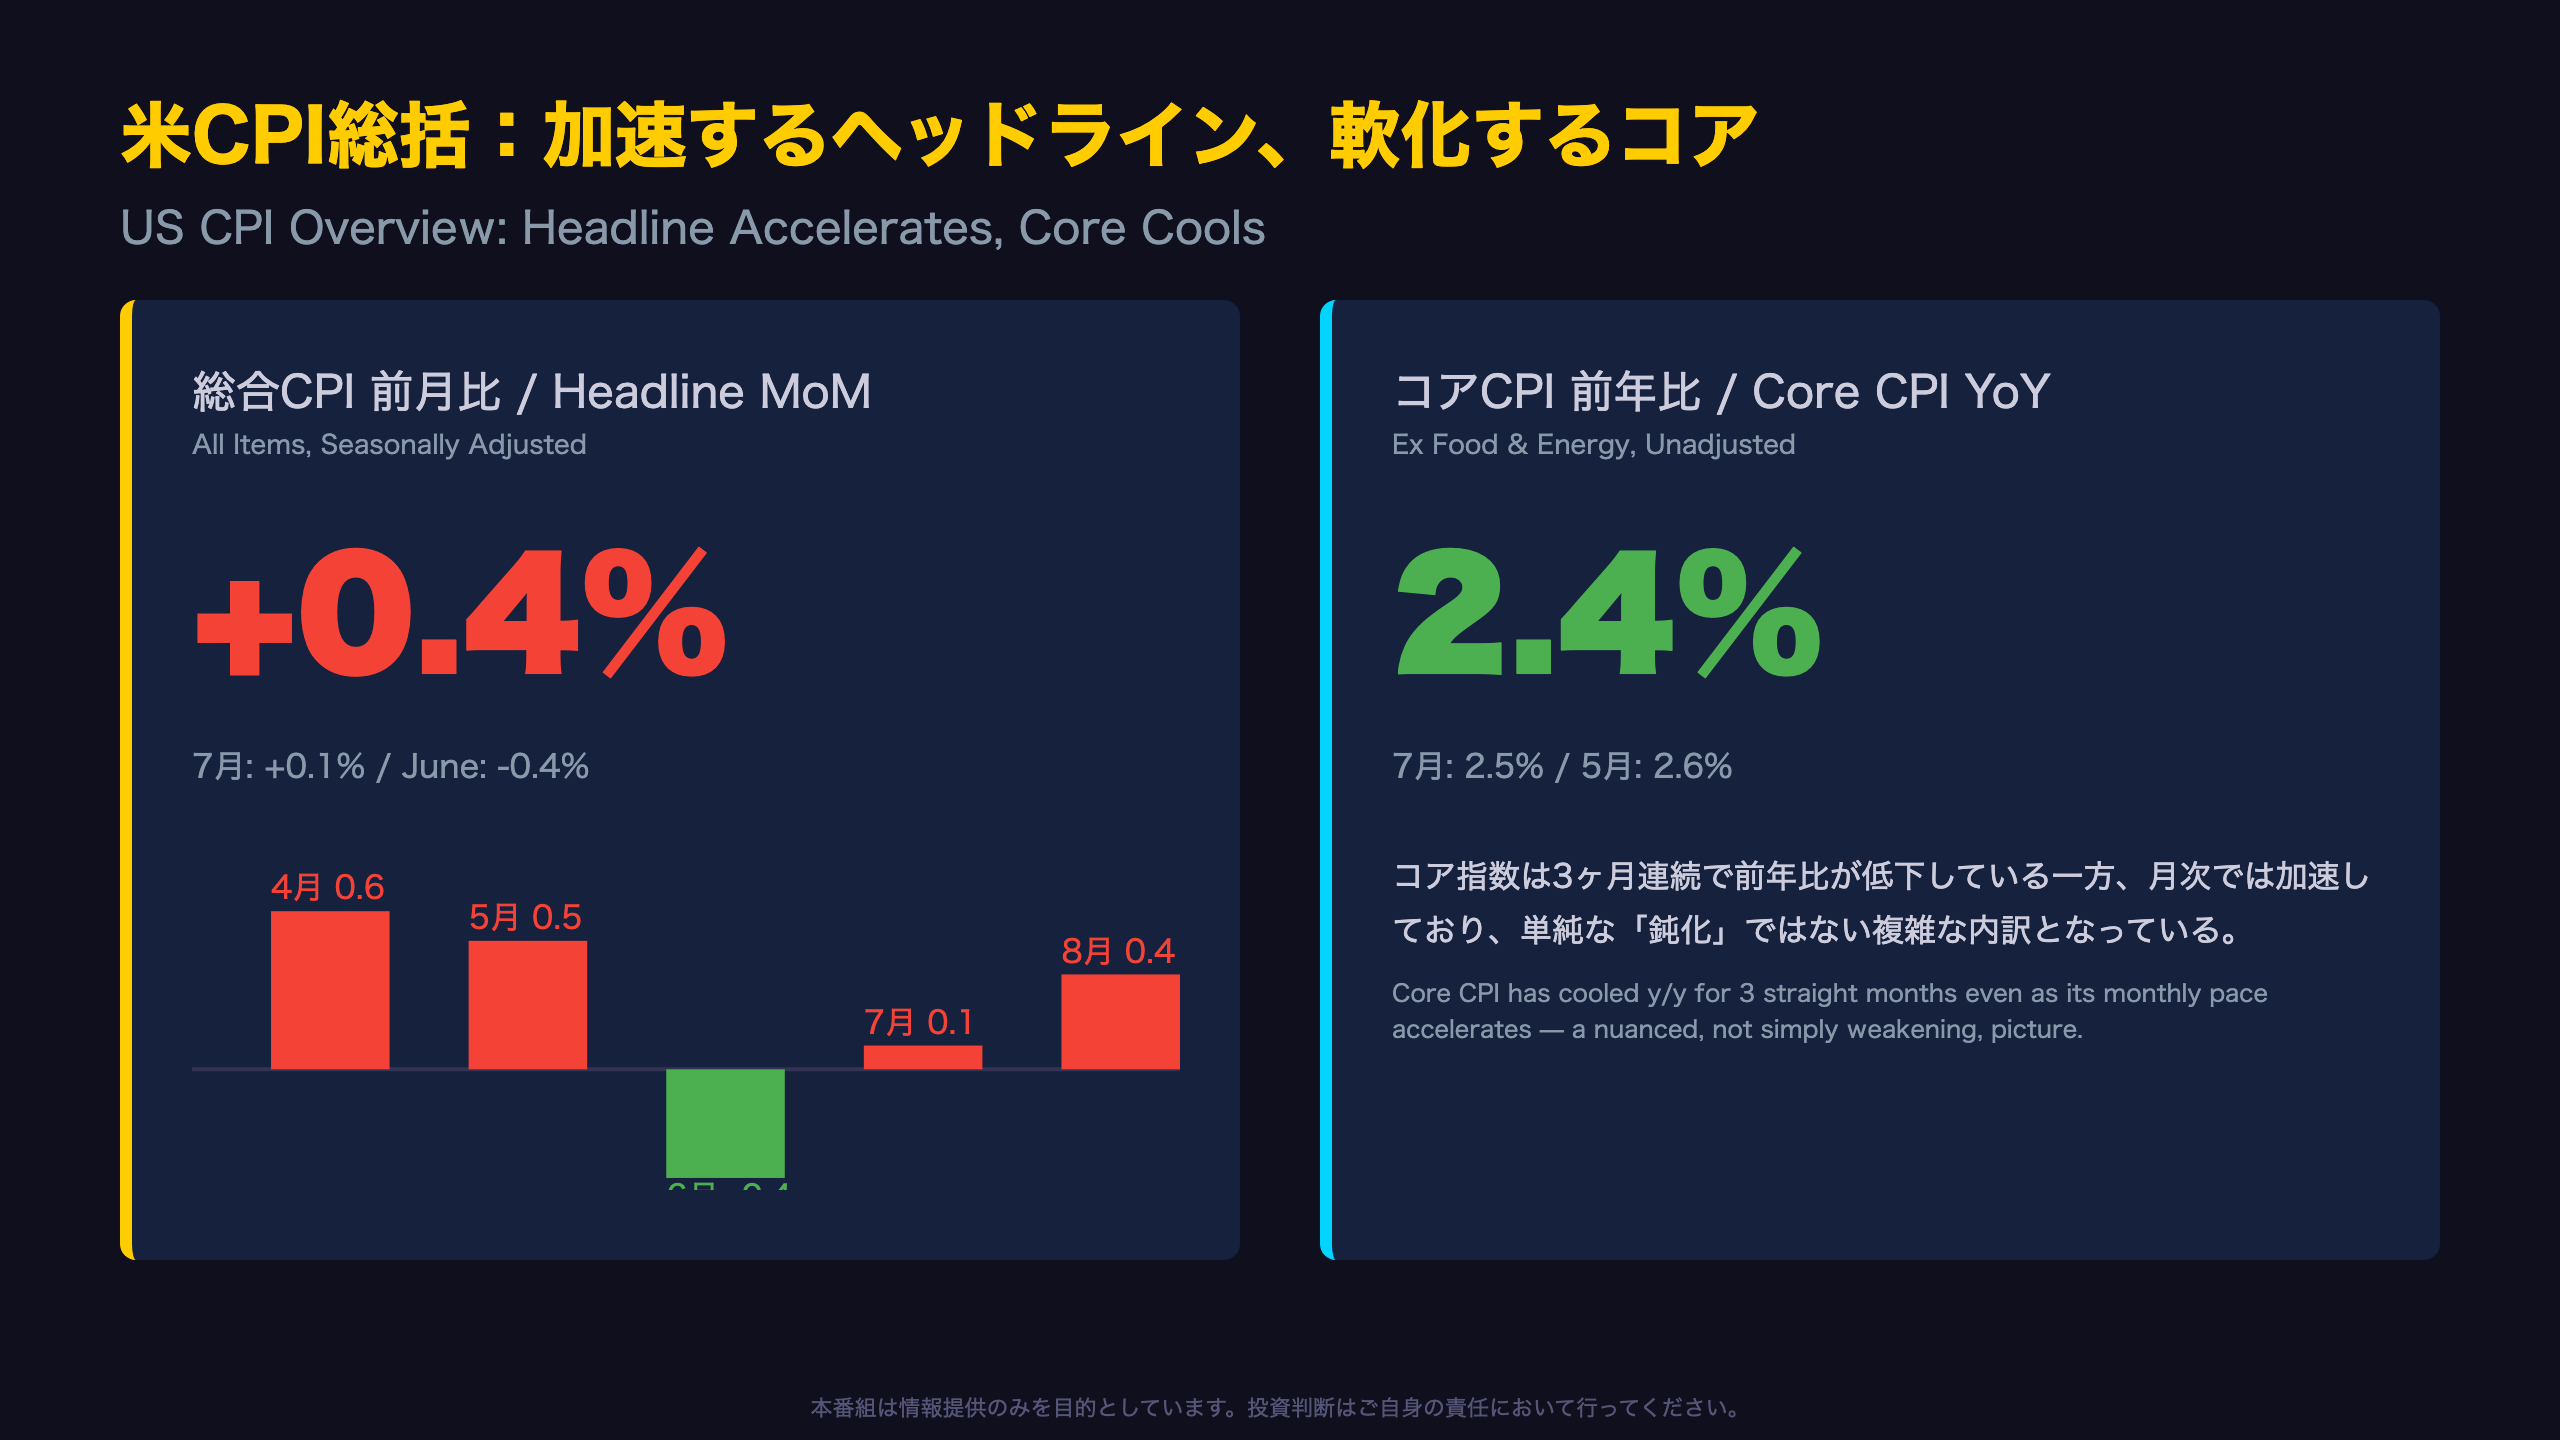
📊 US CPI rose 0.4% in August, a sharp jump from July’s 0.1%, driven mainly by a gasoline price surge that accounted for over a third of the monthly gain.
📉 Meanwhile, core CPI (ex food & energy) cooled to 2.4% y/y from 2.5% in July — the third straight monthly deceleration.
🏠 Shelter costs reaccelerated to 0.3% m/m, the fastest since May, keeping services inflation concerns alive.
💡 We break down this mixed report where the headline and core trends move in opposite directions.
Next release: October 14, 2026.
米CPI総括:加速するヘッドライン、軟化するコア
Behind the Headline: Sampling Error and Seasonal Adjustment
The BLS reports a standard error of just 0.04 percentage points for the 1-month change in the all-items index. The swing from July’s +0.1% to August’s +0.4% (a 0.3pp move) is therefore statistically meaningful and well outside normal noise.
Five-Month Trajectory
- April: +0.6%
- May: +0.5%
- June: -0.4%
- July: +0.1%
- August: +0.4%
June’s sharp decline was driven by a collapse in gasoline prices; August’s rebound partly reflects payback from that move, plus a fresh leg higher.
“The index for gasoline rose 3.9 percent in August, accounting for over one third of the monthly all items increase.”
This BLS language underscores how narrow August’s acceleration was — a single volatile category explains most of the surprise, not broad-based price pressure.
For international readers: the U.S. CPI-U differs from many harmonized indices by heavily weighting Owners’ Equivalent Rent (a hypothetical rental value for owner-occupied housing) rather than actual home prices — a methodological quirk that keeps U.S. shelter inflation elevated relative to some global peers.
Meanwhile, core CPI cooled to 2.4% y/y from 2.5% in July — the third consecutive monthly deceleration. This bifurcation between a hot headline and a cooling core is the real story here.
エネルギーの乱高下:ガソリンが主犯
Understanding the “Base Effect”
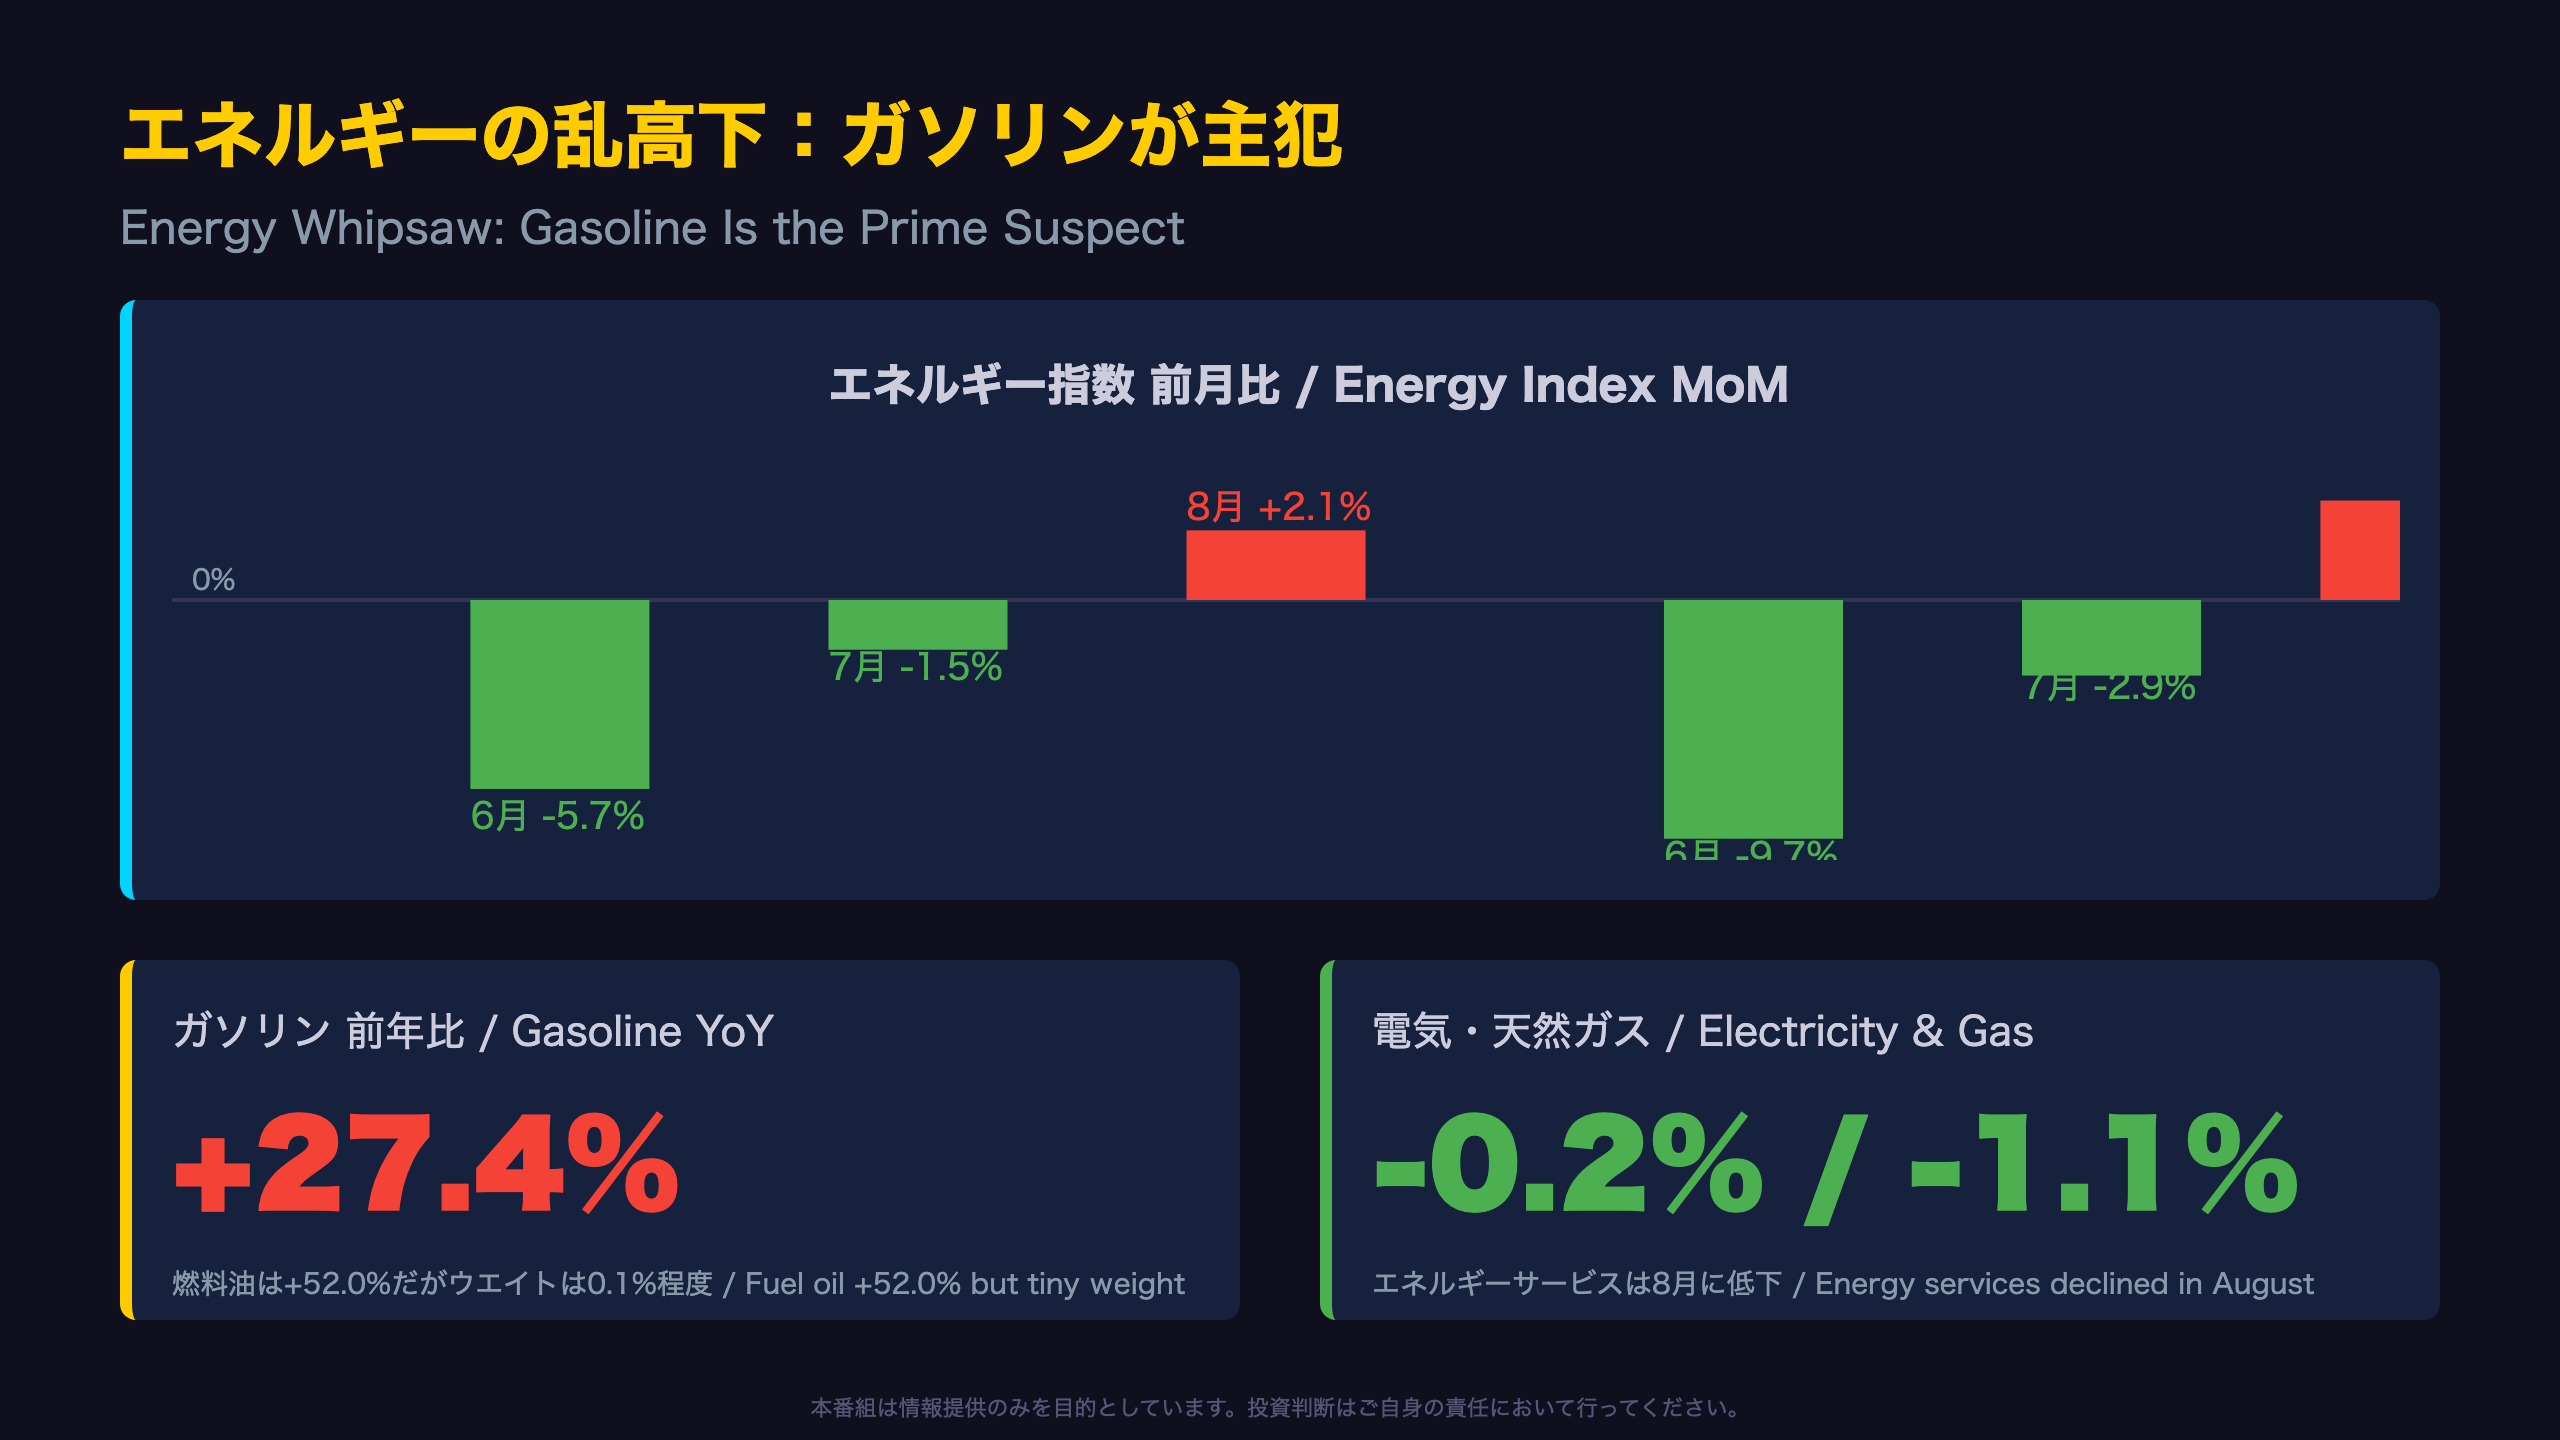
Year-over-year inflation figures compare current prices to levels 12 months earlier. If gasoline prices were unusually depressed a year ago, even flat prices today can produce a large annual percentage gain — this is the base effect distorting August’s 27.4% gasoline YoY figure.
Energy Sub-Indices (August, MoM / YoY)
- Gasoline: +3.9% / +27.4%
- Fuel oil: +10.1% / +52.0%
- Electricity: -0.2% / +3.8%
- Natural gas: -1.1% / +4.4%
Fuel oil’s eye-popping +52% annual gain looks alarming, but its basket weight is just 0.107% of the total index — meaning it barely moves the headline number despite the dramatic percentage change.
Context for international readers: U.S. gasoline prices are far more sensitive to short-term crude oil swings than in many countries with higher fuel taxes, which smooth out volatility. This is why U.S. headline CPI experiences sharper month-to-month energy-driven swings than, for example, the Eurozone HICP.
Notably, electricity and natural gas (energy services) actually declined in August, showing the volatility is concentrated in motor fuel rather than household utilities broadly.
コアCPIのパラドックス:加速する月次、鈍化する前年比
Why MoM and YoY Are Moving in Opposite Directions
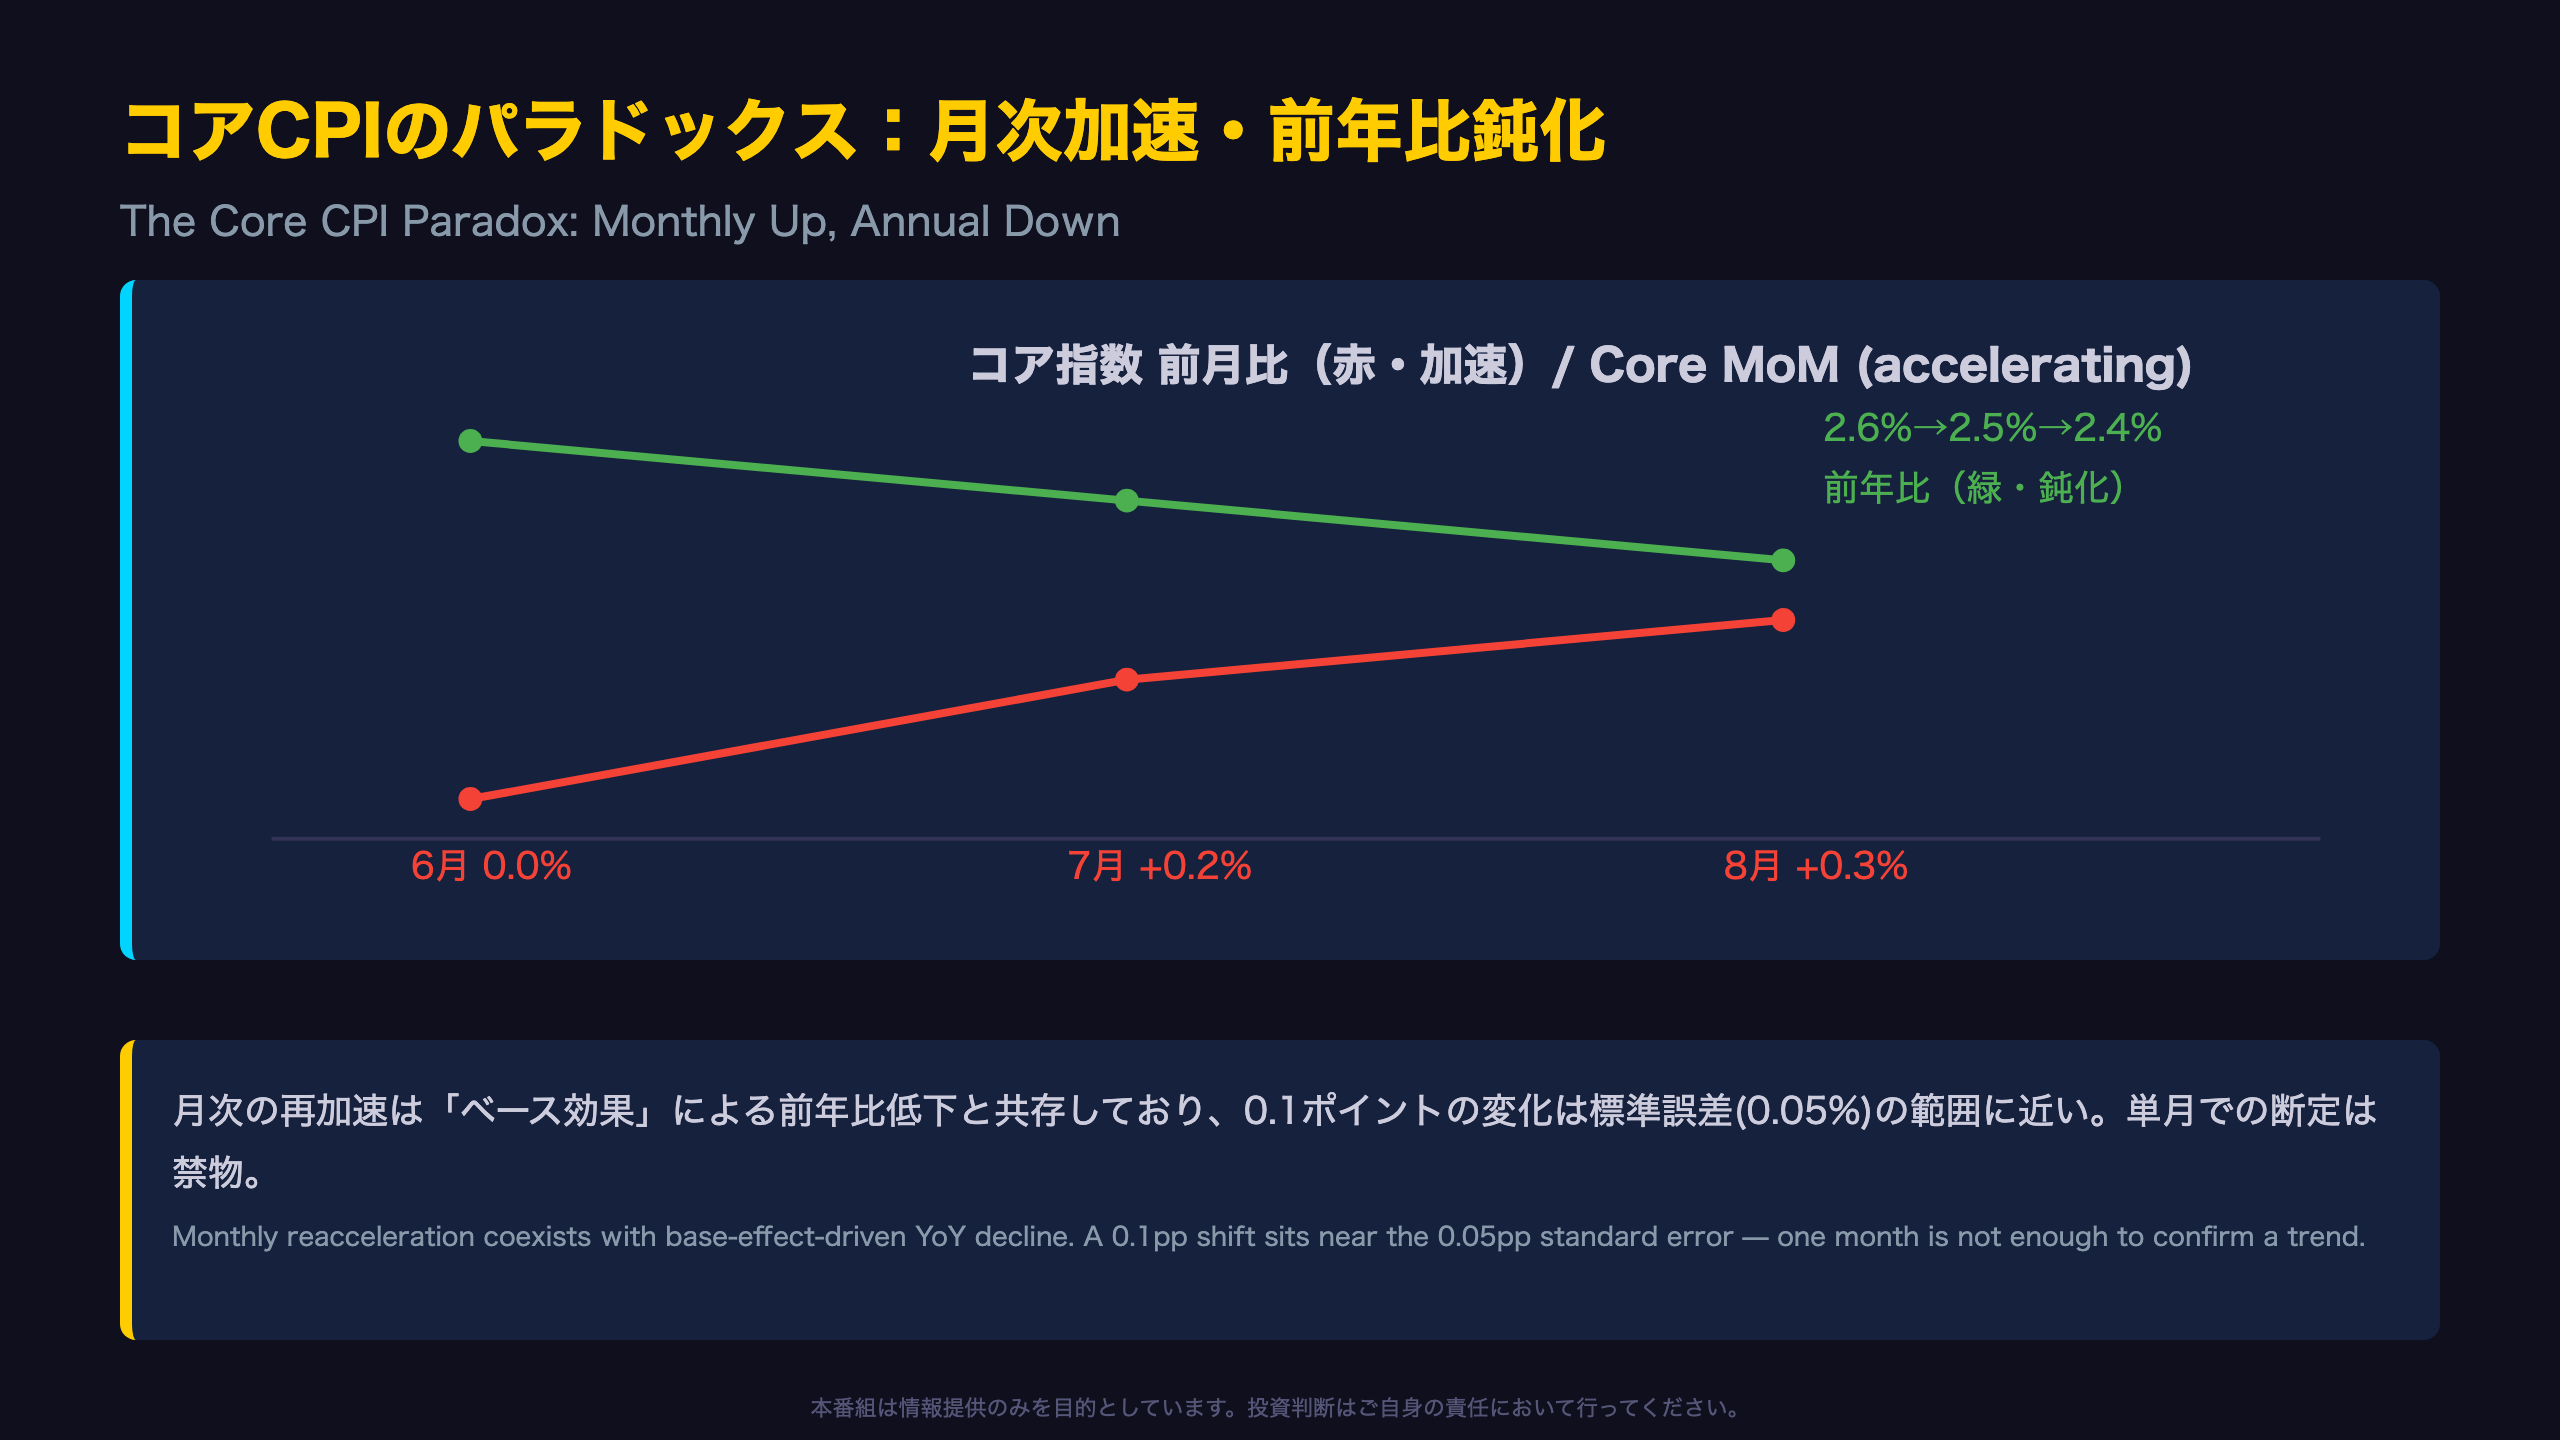
A falling annual rate doesn’t necessarily mean underlying momentum is weakening — in fact, August’s data shows the opposite: three consecutive months of monthly core acceleration.
Core CPI Trajectory (Seasonally Adjusted MoM)
- June: 0.0%
- July: +0.2%
- August: +0.3%
Year-over-Year (Unadjusted)
- May: 2.6%
- July: 2.5%
- August: 2.4%
This divergence reflects the fact that core CPI ran hot in early 2026 — March and April alone posted monthly core gains of 0.2% and 0.4%, respectively. As those elevated months roll out of the 12-month comparison window, the annual rate mechanically declines even as recent momentum firms up.
For context: this dynamic is analogous to what Federal Reserve officials call “base effects,” similar to how the European Central Bank interprets HICP year-over-year swings after volatile energy periods.
Given BLS’s reported standard error of roughly 0.05 percentage points for core CPI’s monthly change, the shift from +0.2% to +0.3% is close to the edge of statistical noise. Declaring a “core inflation re-acceleration” based on one month would be premature — several more releases are needed to confirm the trend.
住居費の粘着性 vs 財のディスインフレ
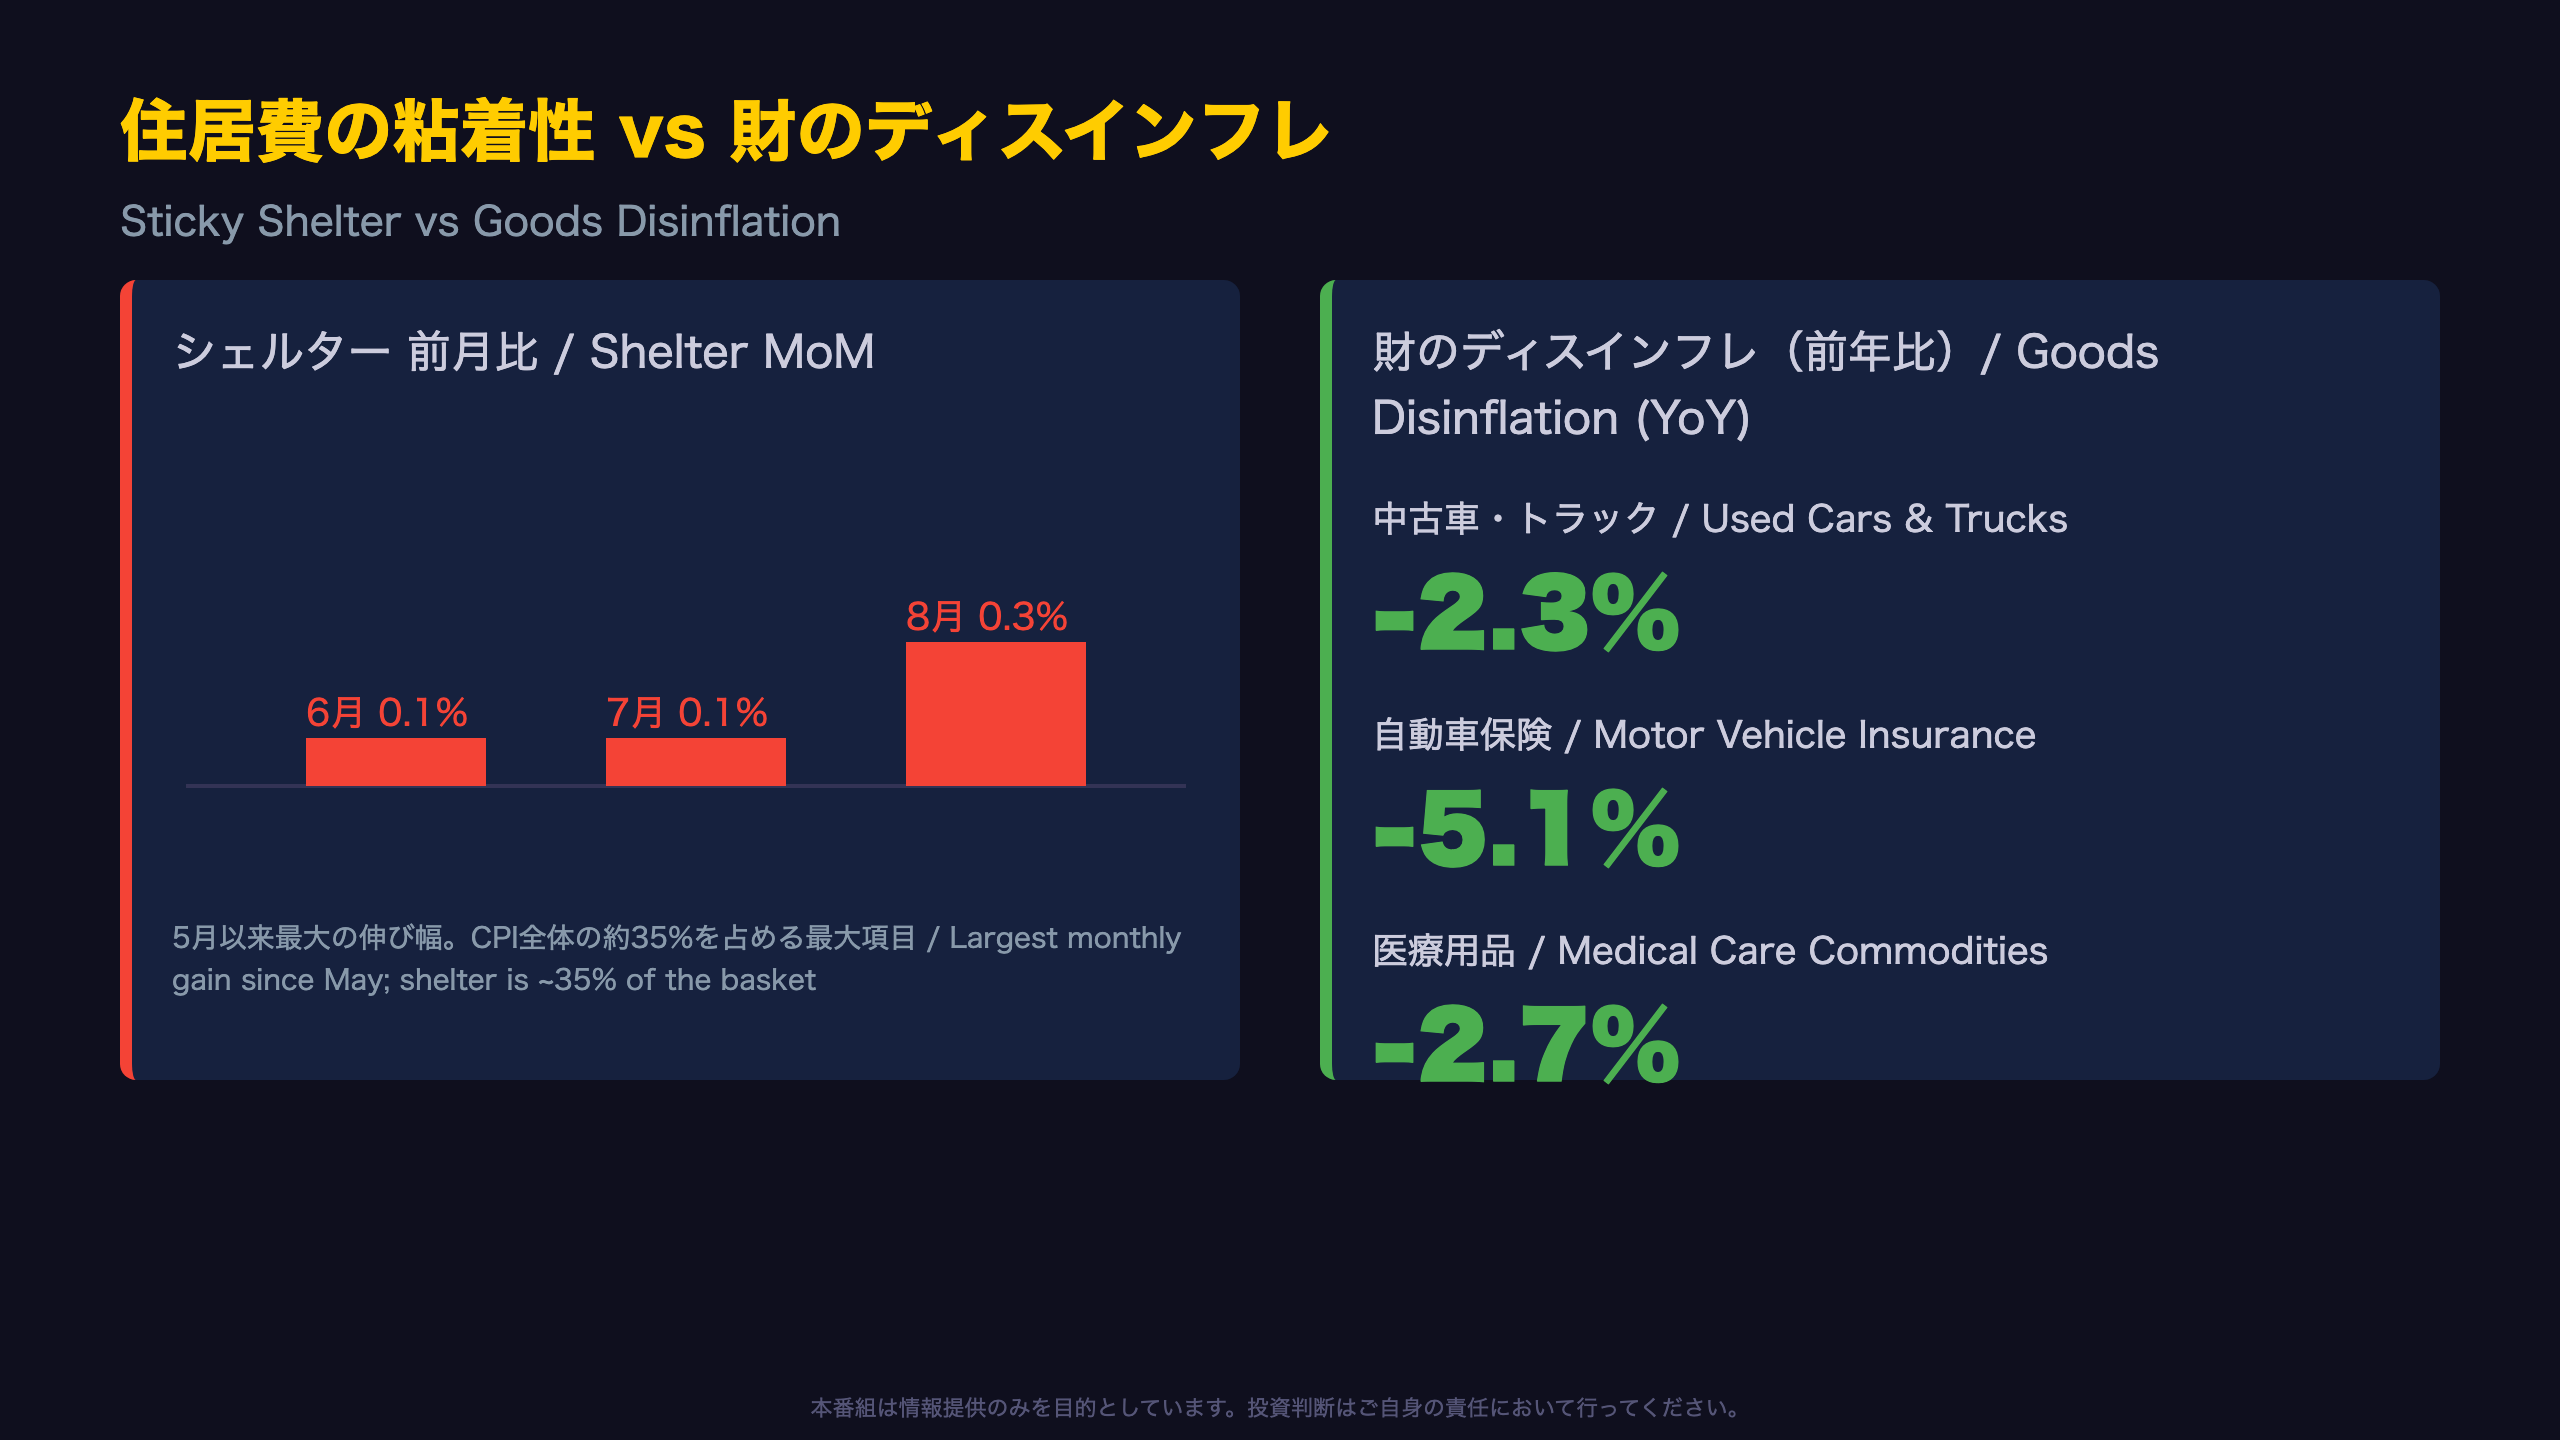
What Makes Shelter “Sticky”?
Shelter includes both Rent of Primary Residence and Owners’ Equivalent Rent (OER) — a statistical estimate of what homeowners would charge if they rented out their property. Because OER is derived from survey data tied to typical annual lease renewal cycles, it lags real-time market rent trends, making it one of the stickiest components in the CPI basket.
Key Year-over-Year Figures (August)
- Owners’ Equivalent Rent: +3.1%
- Rent of Primary Residence: +2.7%
- Used Cars & Trucks: -2.3%
- Motor Vehicle Insurance: -5.1%
- Medical Care Commodities: -2.7%
“The shelter index rose 0.3 percent in August after rising 0.1 percent in July.”
This BLS language confirms shelter’s monthly pace was the strongest in several months. Whether this is a one-off blip or a structural re-acceleration will only become clear after one or two more releases.
International comparison: unlike many European CPI measures that survey actual rental prices more directly, heavy reliance on OER is a distinctly American methodological choice — one reason U.S. shelter inflation can appear more persistent than comparable housing cost measures abroad. Motor vehicle insurance’s steep -5.1% annual decline, meanwhile, reflects payback from the sharp premium spikes of 2023-2024.
市場への含意:FRBは板挟みに
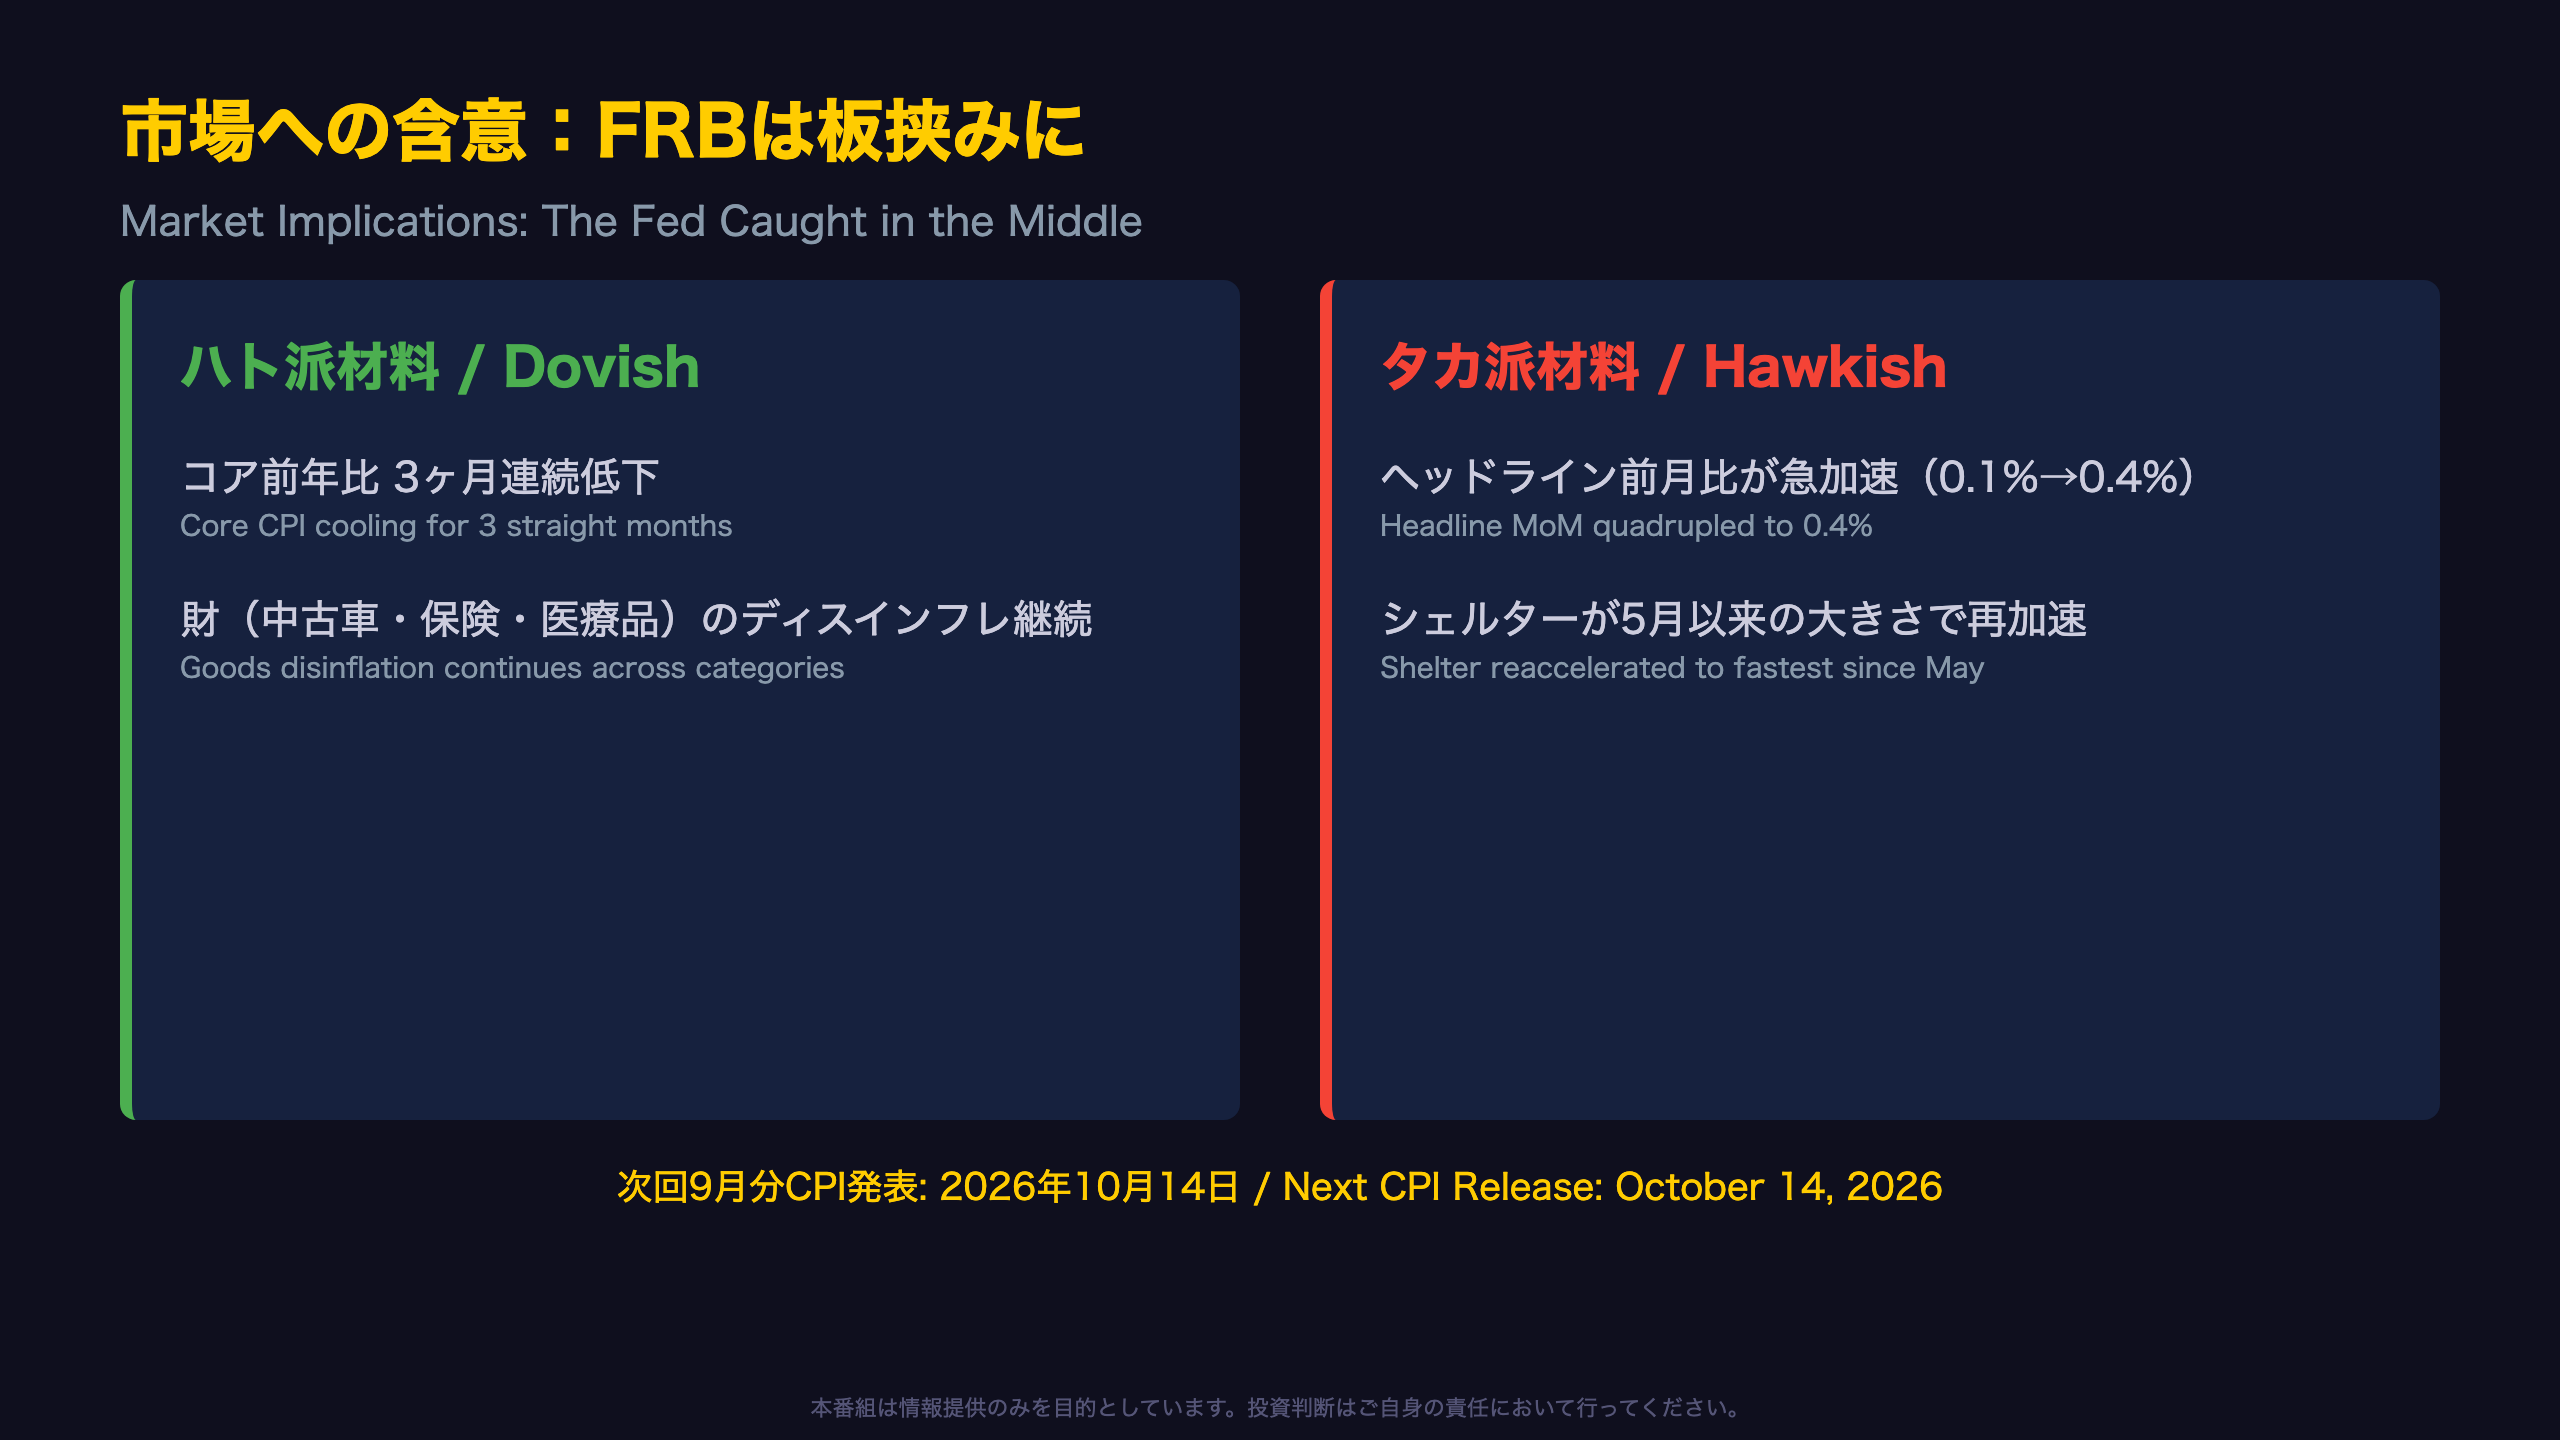
What the Market Will Watch Next
This CPI print offers ammunition to both inflation doves and hawks within the Fed, making it a genuinely mixed signal rather than a clear-cut catalyst.
Dovish Signals (Support Continued Rate Cuts)
- Core CPI has decelerated for three straight months, from 2.6% in May to 2.4% in August
- Goods disinflation continues across used cars, auto insurance, and medical commodities
Hawkish Signals (Argue for Caution)
- Headline monthly CPI quadrupled from 0.1% to 0.4%
- Shelter reaccelerated to its fastest pace since May (+0.3% m/m)
- Energy’s annual increase widened to 16.3%
“The Consumer Price Index news release for September 2026 is scheduled to be published on Wednesday, October 14, 2026, at 8:30 a.m. (ET).”
For international investors: U.S. rate decisions ripple globally through Treasury yields and the dollar, affecting everything from emerging-market currencies to Japanese Government Bond spreads. Until the gasoline rebound and shelter re-acceleration are confirmed as either transient or structural, expect elevated volatility in rates and FX markets.
Disclaimer: This article is for informational purposes only. All investment decisions are made solely at your own risk.