
📺 Watch the Full Video Analysis
This article was automatically generated by the NFC Market Live AI analysis system. (Updated: 2026-09-03 21:44 JST)
📄 Primary Source
U.S. Census Bureau
https://www.census.gov/foreign-trade/Press-Release/current_press_release/ft900.pdf
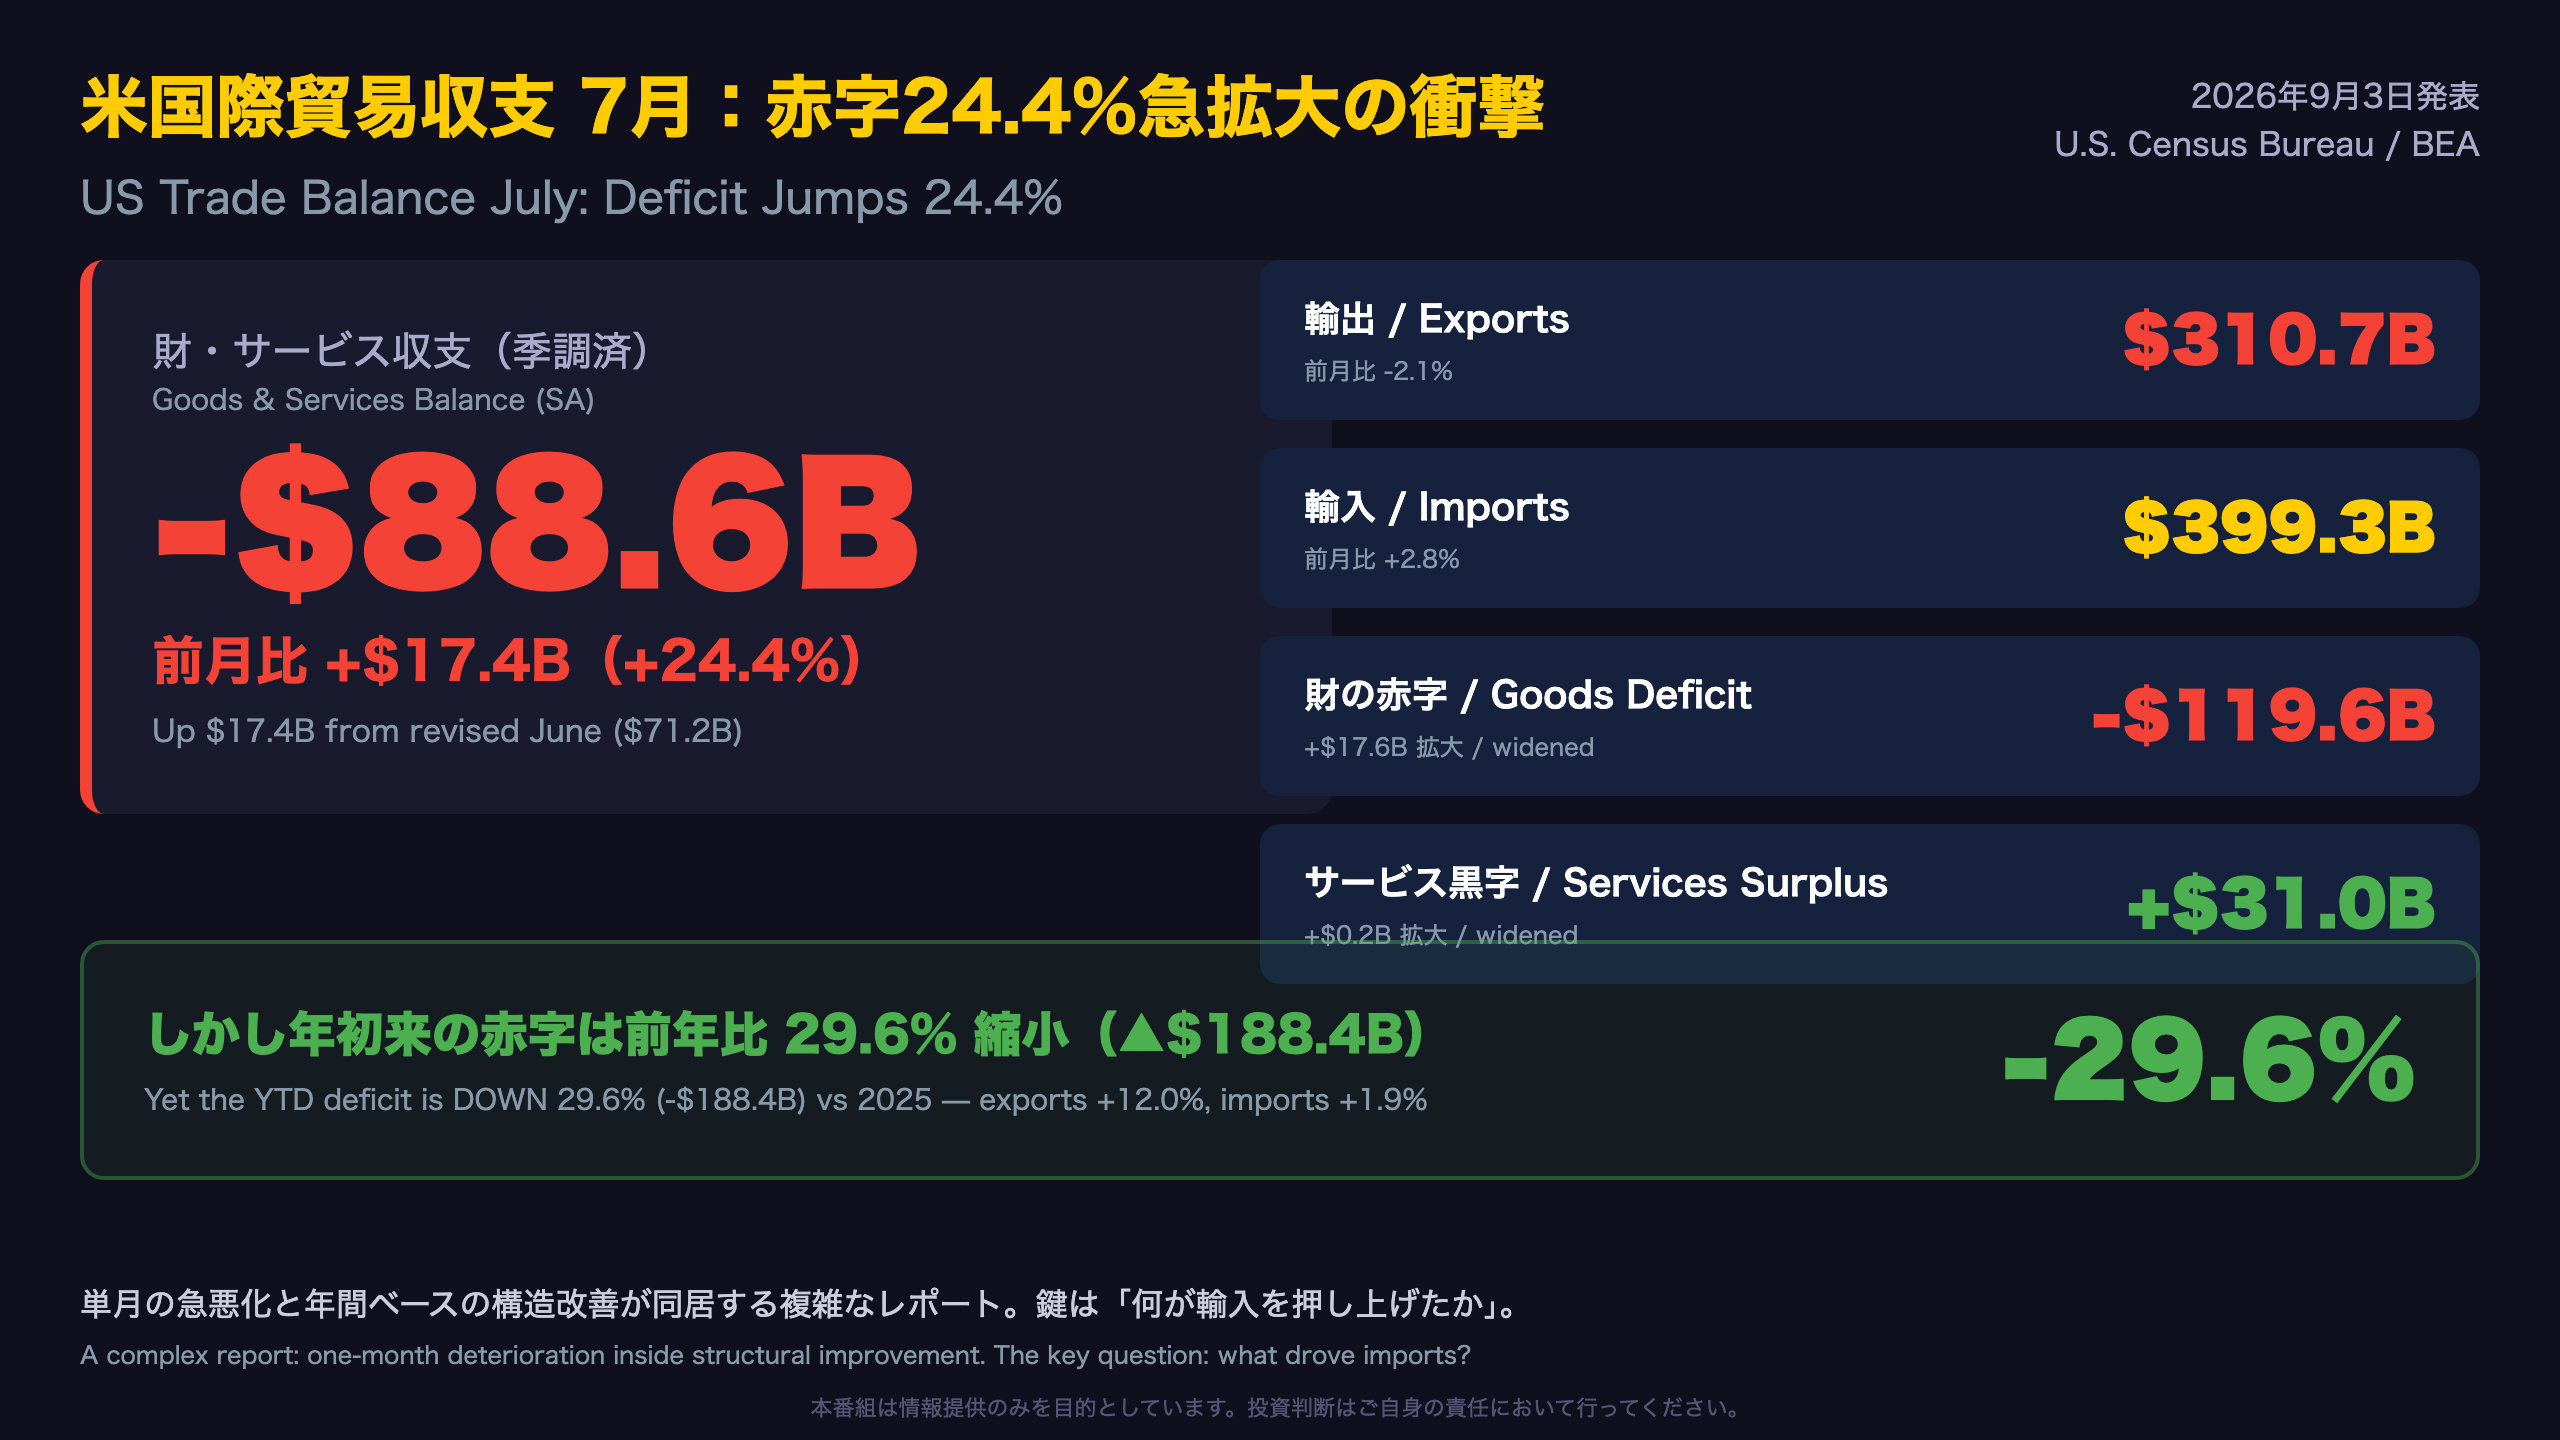
📊 The US goods & services trade deficit widened 24.4% to $88.6B in July 2026, up $17.4B from June, per the Census Bureau and BEA (FT-900).
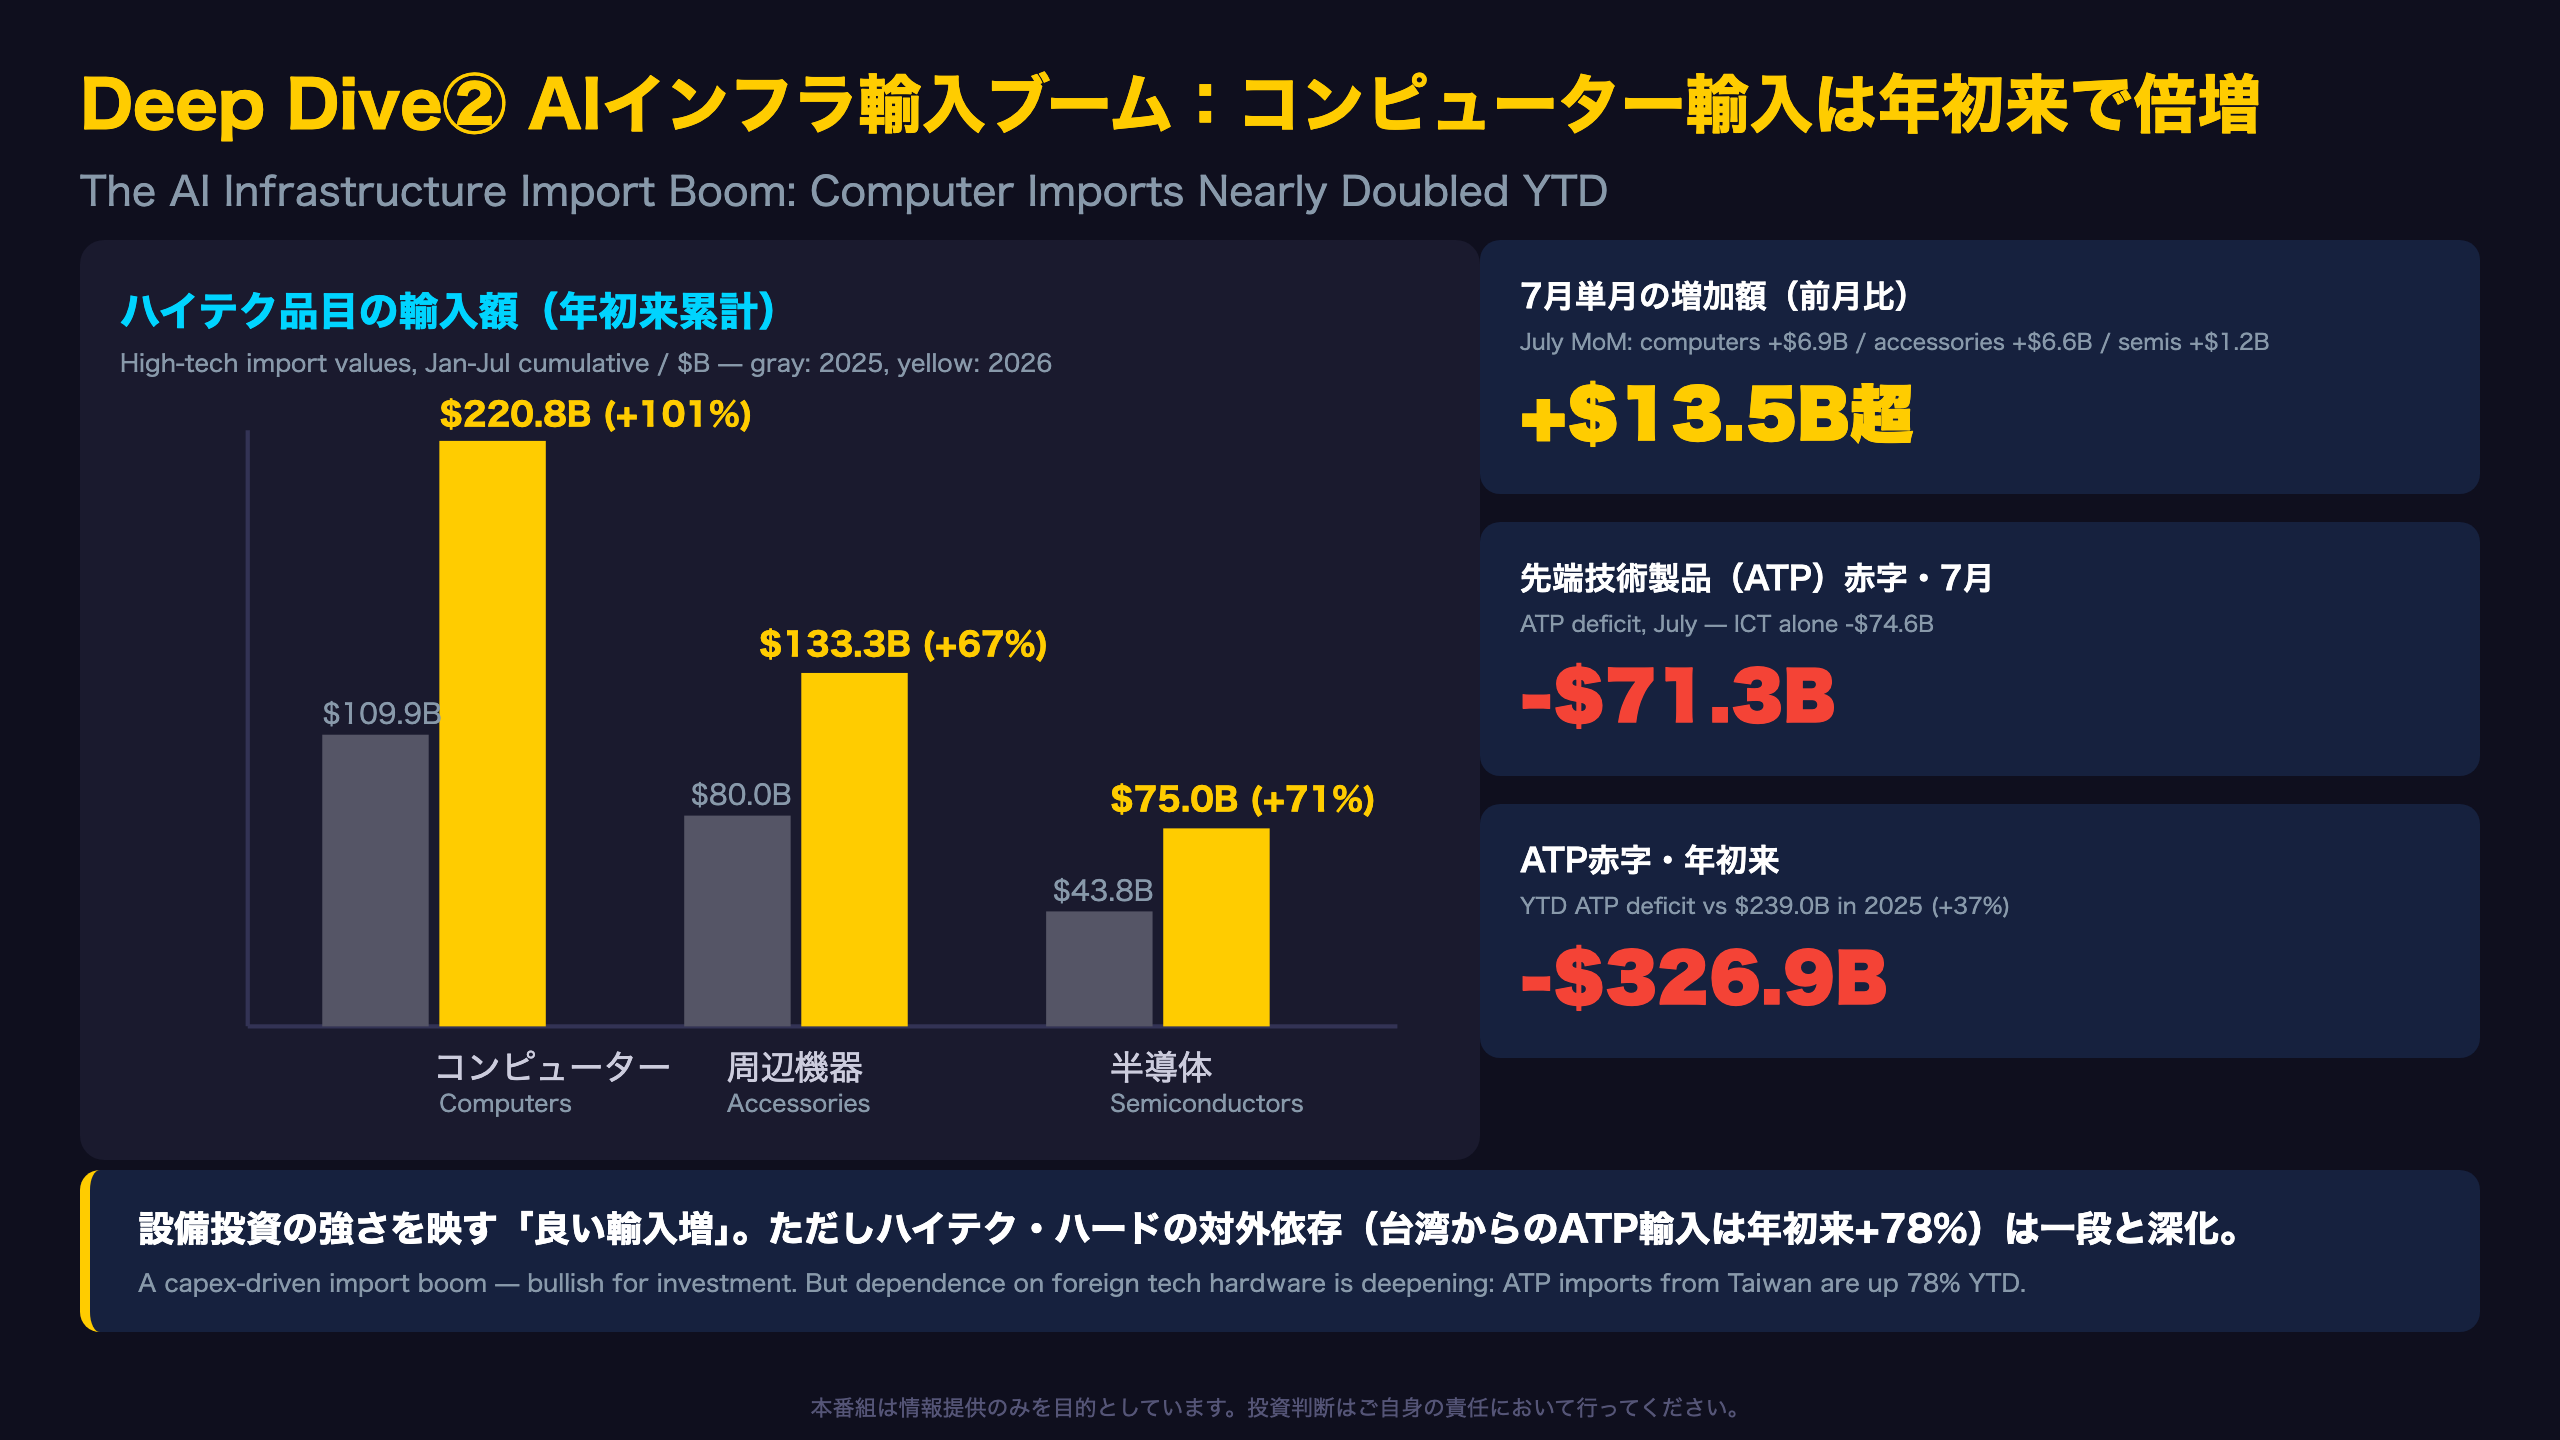
📈 The standout: capital goods imports surged $14.4B in a single month — computers +$6.9B, computer accessories +$6.6B, semiconductors +$1.2B — pointing to an AI/data-center capex boom. YTD computer imports have nearly doubled YoY.
📉 Exports fell $6.6B, dragged by crude oil (-$4.5B) and nonmonetary gold (-$3.9B).
💡 Yet the year-to-date deficit is DOWN 29.6% vs 2025, with exports up 12%. A complex report mixing one-month deterioration with structural improvement.
⚠️ Country mix is shifting: Mexico ($27.5B) now tops the deficit table, with Vietnam and Taiwan ahead of China. Next release: Oct 6.
The Ultimate Summary:赤字24.4%急拡大、しかし年初来は3割縮小
FT-900 Explained: A One-Month Shock Inside a Year of Improvement
The FT-900 is the definitive monthly report on US international trade, jointly published by the Census Bureau and the Bureau of Economic Analysis (BEA). It matters because it feeds directly into the net-exports component of US GDP.
The July snapshot
- Deficit: $88.6B, up $17.4B (+24.4%) from a revised $71.2B in June
- Exports: $310.7B (-$6.6B); Imports: $399.3B (+$10.8B)
- Goods deficit widened $17.6B to $119.6B; services surplus edged up to $31.0B
Why the headline is misleading on its own
July marks the largest monthly deficit of 2026 outside the tariff-front-running episode of Q1. But the year-to-date picture is dramatically better than 2025: the cumulative deficit is down $188.4B, or 29.6%, with exports up 12.0% versus imports up just 1.9%. For context, the US deficit routinely exceeded $150B per month in early 2025 during pre-tariff import surges — today’s level, while elevated, is structurally lower.
June was also revised favorably, from a $73.3B deficit to $71.2B, with services exports revised up $2.3B. For global investors, the key question is not whether the deficit widened, but why — and as the following slides show, the answer points to capital investment, not consumer excess. That distinction matters enormously for how bond and FX markets should price this release.
Deep Dive①:単月悪化の分解——資源輸出の反動減 × 設備輸入の急増

Anatomy of a $17.4B Deficit Blowout
The export side: a commodity payback, not a demand story
Census-basis goods exports fell $5.9B, but the decline was extraordinarily concentrated: industrial supplies alone dropped $8.7B, with crude oil down $4.5B and nonmonetary gold down $3.9B. Context matters here. US crude exports had spiked to $17-19B per month in April-May 2026 (volumes near 5.7 million barrels per day), and July’s 3.5 mb/d represents normalization from an unusual surge. Gold exports had doubled year-to-date ($79.0B vs $36.0B in 2025) — July’s pullback is mean reversion, not weakness.
Critically, manufactured exports rose: capital goods +$1.9B and consumer goods +$1.7B (pharmaceuticals +$1.0B). Anyone reading July as evidence of collapsing US export competitiveness is misreading the composition.
The import side: one category did all the work
Of the $12.0B rise in Census-basis goods imports, capital goods contributed +$14.4B — more than 100% of the increase. Industrial supplies fell $1.8B (crude oil -$1.8B), autos fell $0.5B, and consumer goods were flat (+$0.3B). Consumer-facing imports were quiet.
For markets, this composition is the crucial nuance: the deficit widened because American businesses are importing equipment, not because American consumers are splurging on foreign goods. That is a fundamentally different macro signal than the import booms of past cycles.
Deep Dive②:AIインフラ輸入ブーム——コンピューター輸入は年初来で倍増
The AI Capex Boom, As Told by Customs Data
Year-to-date tech imports are in a different universe
- Computers: $220.8B YTD vs $109.9B in 2025 (+101%)
- Computer accessories: $133.3B vs $80.0B (+67%)
- Semiconductors: $75.0B vs $43.8B (+71%)
- Telecom equipment: $95.6B vs $63.5B (+51%)
Of the $231.3B YTD increase in total capital goods imports, these computing-related categories account for essentially all of it. This is the trade-data fingerprint of the US data-center construction wave.
Advanced Technology Products: a structural deficit forms
The Census Bureau’s ATP series tracks roughly 500 leading-edge product codes. In July, the ATP deficit reached $71.3B in a single month, with Information & Communications alone posting a $74.6B shortfall — swamping surpluses in aerospace (+$11.6B). The YTD ATP deficit stands at $326.9B versus $239.0B a year earlier.
Where it comes from
Country detail shows the supply chain clearly: July ATP imports from Taiwan hit $22.2B (YTD $139.2B, +78% YoY), while Mexico — the assembly hub for AI servers — ran a $27.1B monthly ATP import bill. Thailand’s ATP deficit with the US ($9.4B in July) has also ballooned.
Two readings for investors
Bullish: this is investment-driven import demand — the trade-side mirror of the equipment capex visible in GDP. Bearish: US dependence on foreign tech hardware is deepening precisely in the categories deemed strategically critical. Both readings are true simultaneously, which is what makes this report so consequential.
Deep Dive③:国別勢力図の激変——対中赤字は4位に後退
The Bilateral Data Signal the End of the ‘China Deficit Era’
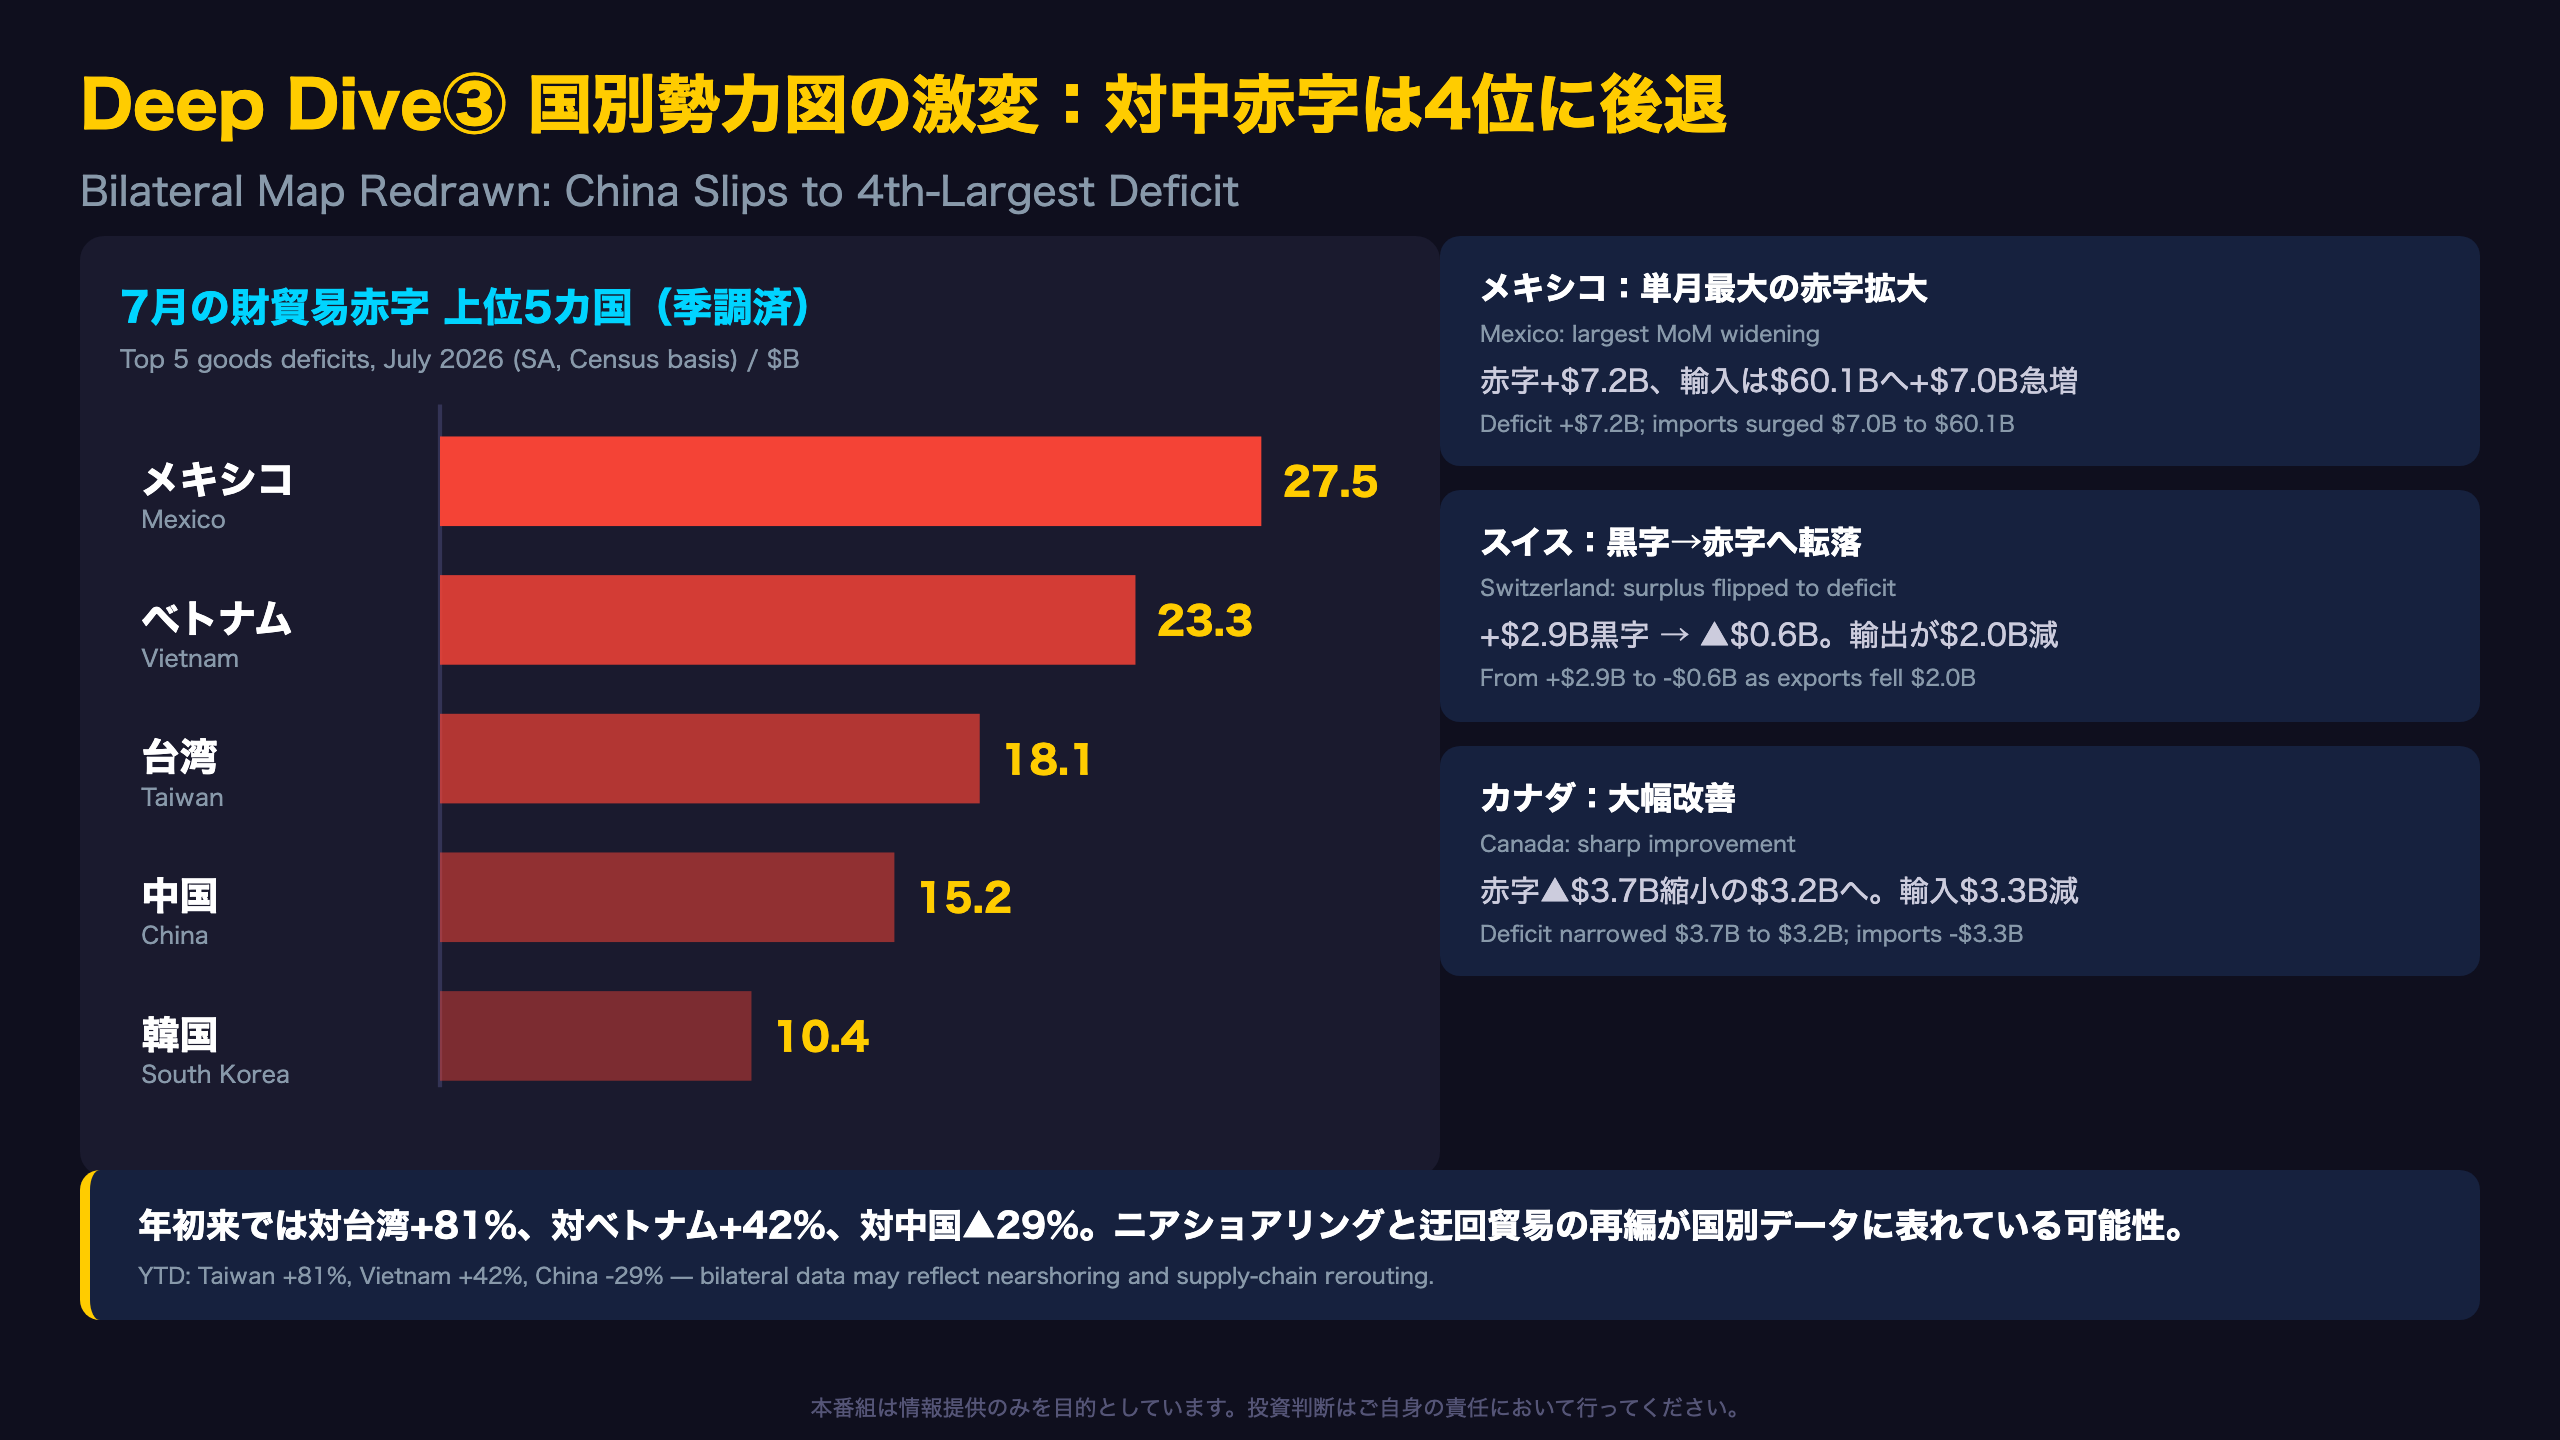
For two decades, the US-China goods deficit dwarfed all others. No longer. In July 2026, China ranked only fourth at $15.2B, behind Mexico ($27.5B), Vietnam ($23.3B), and Taiwan ($18.1B).
Year-to-date confirms the structural shift
- China deficit YTD: $91.2B, down 29% from $128.8B in 2025
- Vietnam: $139.3B, up 42% — now the largest YTD bilateral deficit
- Taiwan: $131.5B, up 81% — the AI hardware pipeline
- Mexico: $128.9B, up 14% — nearshored assembly
Each reflects a different role in the reordered supply chain: Taiwan ships the advanced silicon and servers, Vietnam handles final assembly of consumer electronics, and Mexico hosts nearshored production including AI server integration. July’s $7.0B one-month jump in imports from Mexico is consistent with this dynamic, though the report itself does not attribute causes.
Two idiosyncratic moves worth noting
Switzerland flipped from a $2.9B surplus to a $0.6B deficit as US exports there fell $2.0B — Swiss flows have been whipsawed all year by nonmonetary gold shipments, a recurring source of noise in this series. Canada improved sharply, with imports falling $3.3B and the deficit narrowing to $3.2B. Caution: the quarterly BOP-basis data show the Canada deficit widening $11.9B in Q2, so monthly and quarterly series are telling different stories — a reminder to treat single-month country data carefully.
For investors in EM and Asian FX, the takeaway is that US tariff and trade policy pressure is likely to keep migrating toward Vietnam, Taiwan, and Mexico — the new deficit leaders.
Deep Dive④:実質でも輸入増は本物——GDPへの含意と次の焦点

Real Data, Revisions, and the GDP Connection
The volume check
A crucial test for any trade report is whether nominal swings reflect prices or quantities. The release states the real goods deficit (chained 2017 dollars) rose \”12.0 billion, or 12.7 percent, to 106.4 billion\” — nearly matching the 17.7% nominal increase. Real imports rose 3.8% versus 3.9% nominal. Conclusion: July’s import surge is a genuine volume phenomenon, not a price artifact.
The overlooked story: pharmaceuticals
Consumer goods imports are down $113.3B YTD — and pharmaceuticals alone account for $90.0B of that decline ($190.3B → $100.3B). Correspondingly, the Ireland deficit — long inflated by pharma flows through Irish subsidiaries of US drugmakers — has collapsed from $85.1B to $21.6B YTD. This likely unwinds the massive pre-tariff stockpiling of early 2025, though the report itself does not assign a cause.
What it means for GDP
The FT-900 is the primary source for the net-exports line in BEA’s GDP accounts. July’s real import surge points to a net-export drag on Q3 GDP. However — and this is where naive readings go wrong — imported capital equipment shows up simultaneously as business fixed investment. The trade drag and the capex boost are two sides of the same transaction, so the growth impact is far more muted than the headline deficit suggests. US CPI-style panic over a wider deficit would be misplaced; bond markets should focus on the investment signal.
Next up
Next release: Tuesday, October 6, 2026 (August data). Watch: (1) whether computer/semiconductor imports extend their run, (2) whether the Mexico deficit normalizes, and (3) whether crude and gold exports stabilize after their payback.
Disclaimer: This article is for informational purposes only. All investment decisions are made solely at your own risk.