📺 Watch the Full Video Analysis
This article was automatically generated by the NFC Market Live AI analysis system. (Updated: 2026-09-02 23:09 JST)
📄 Primary Source
U.S. Census Bureau
https://www.census.gov/manufacturing/m3/prel/pdf/s-i-o.pdf
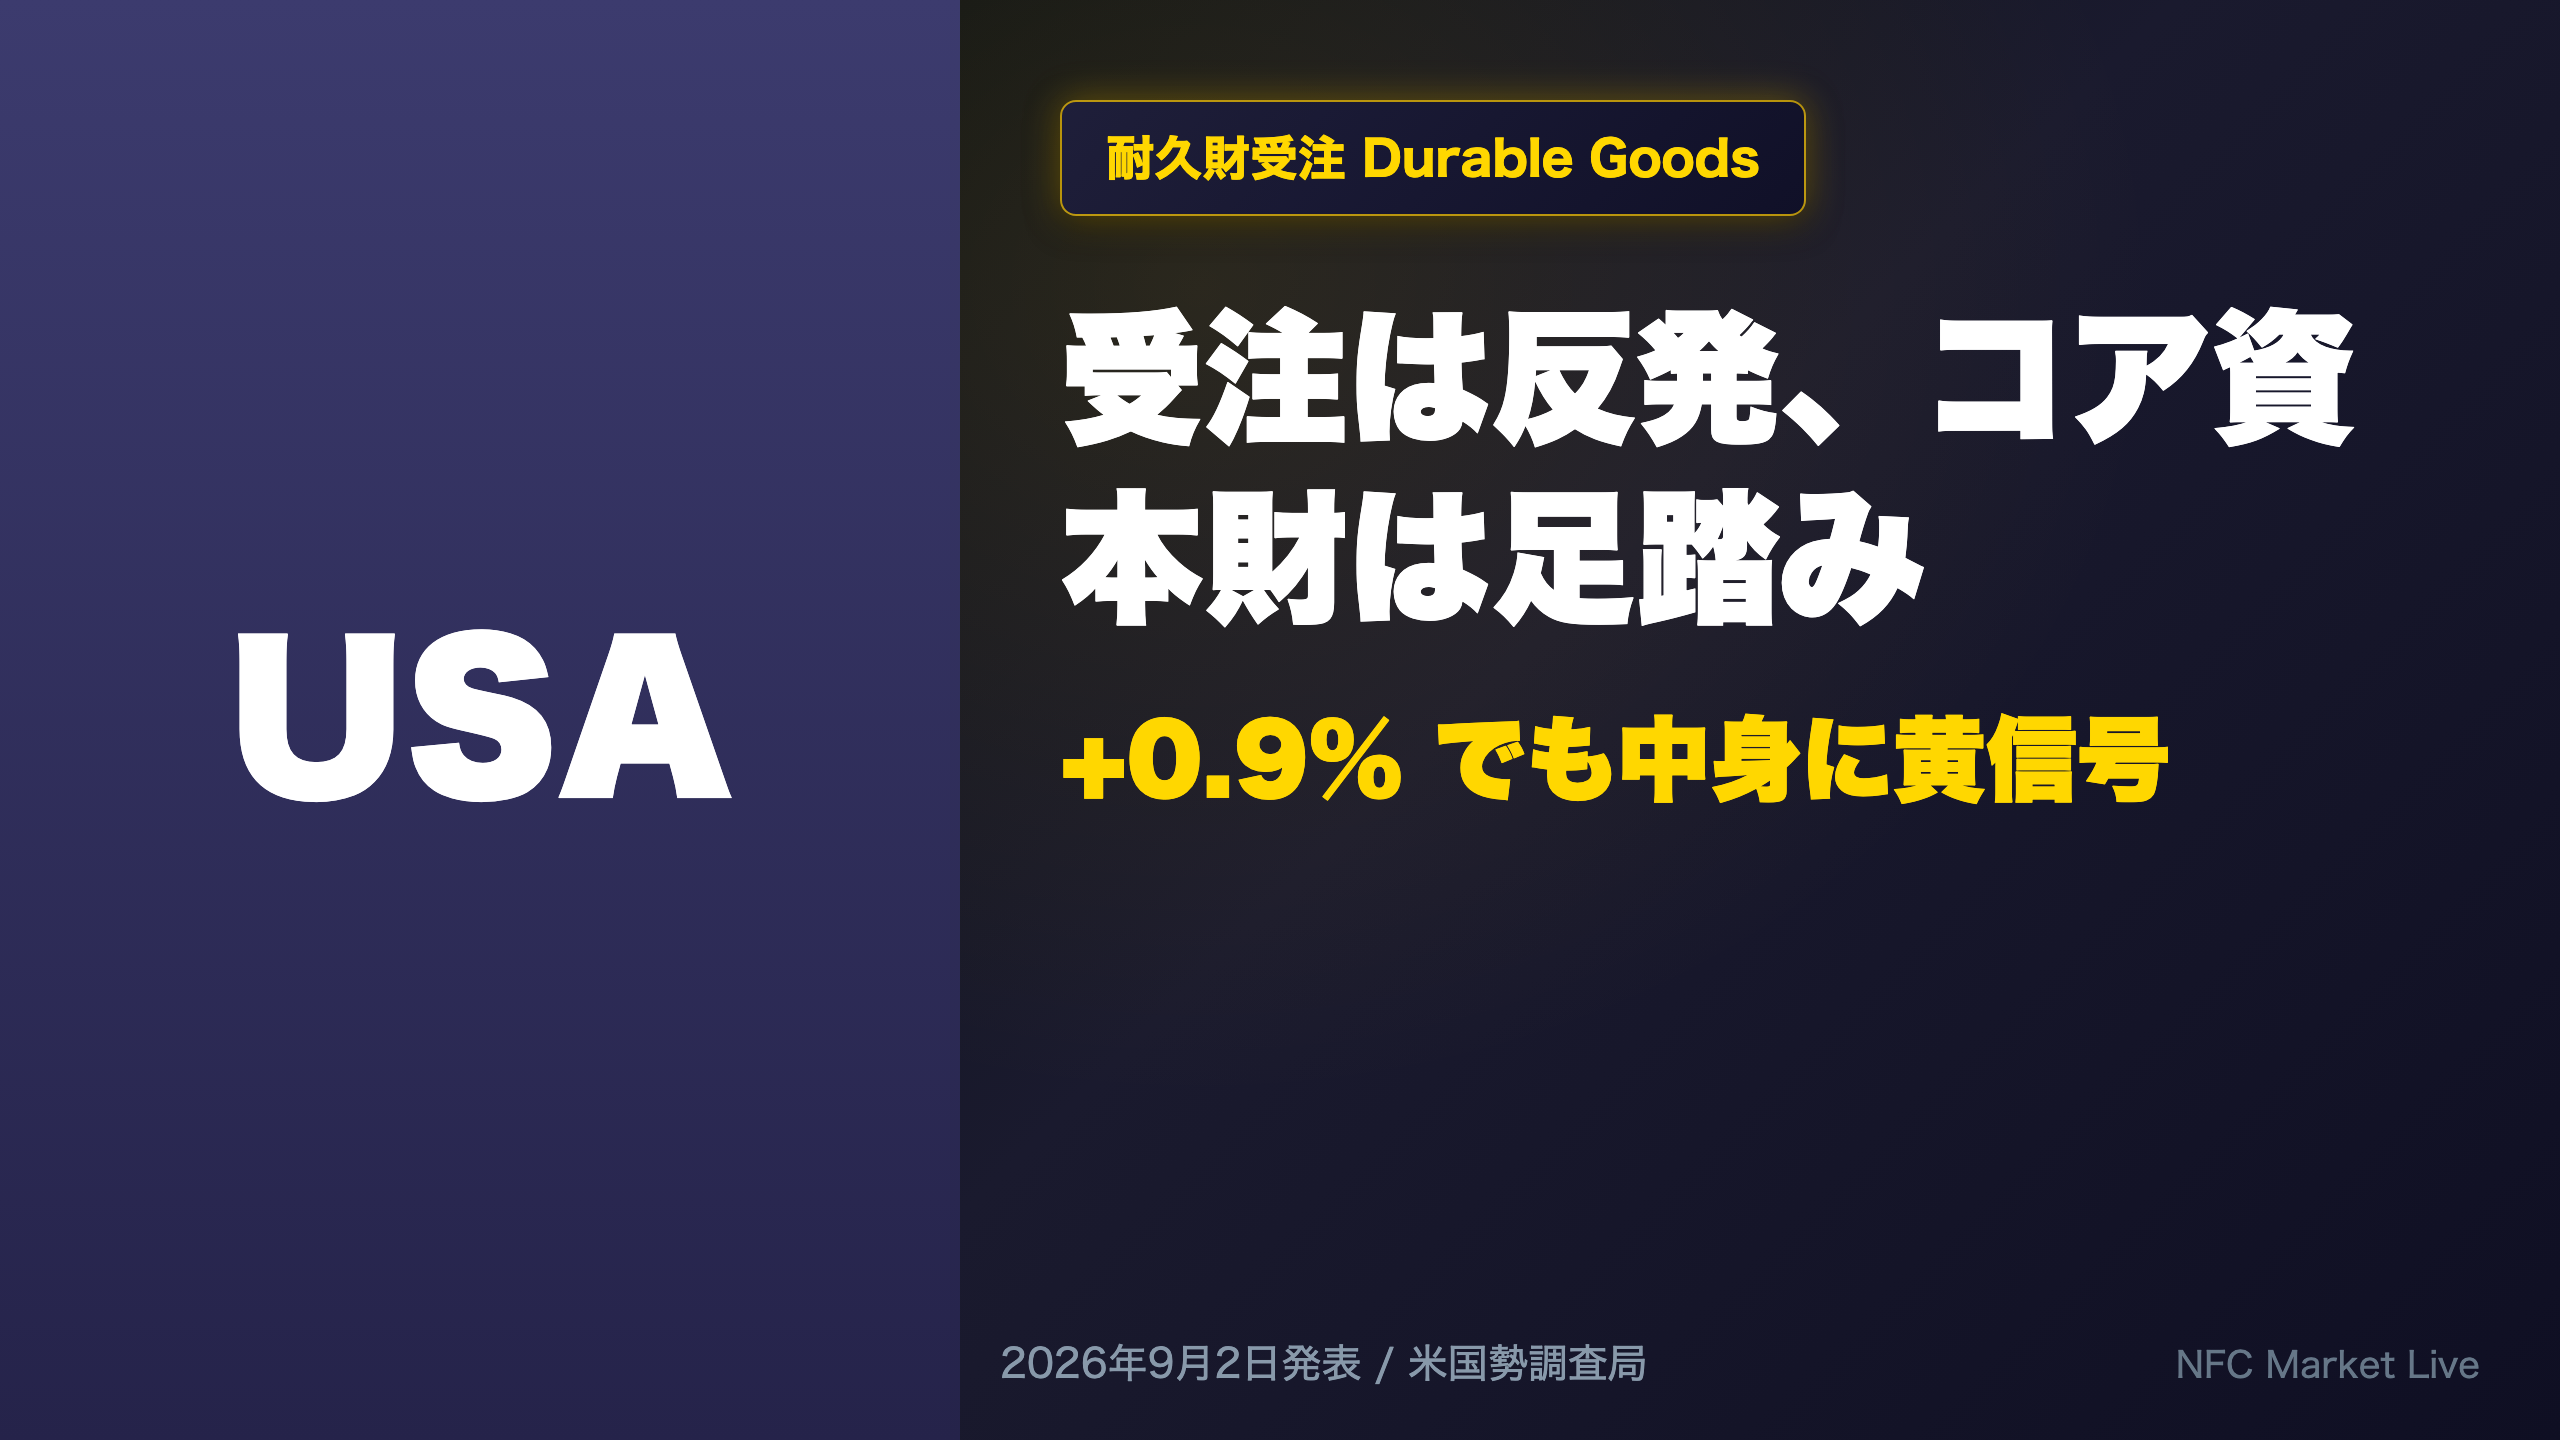
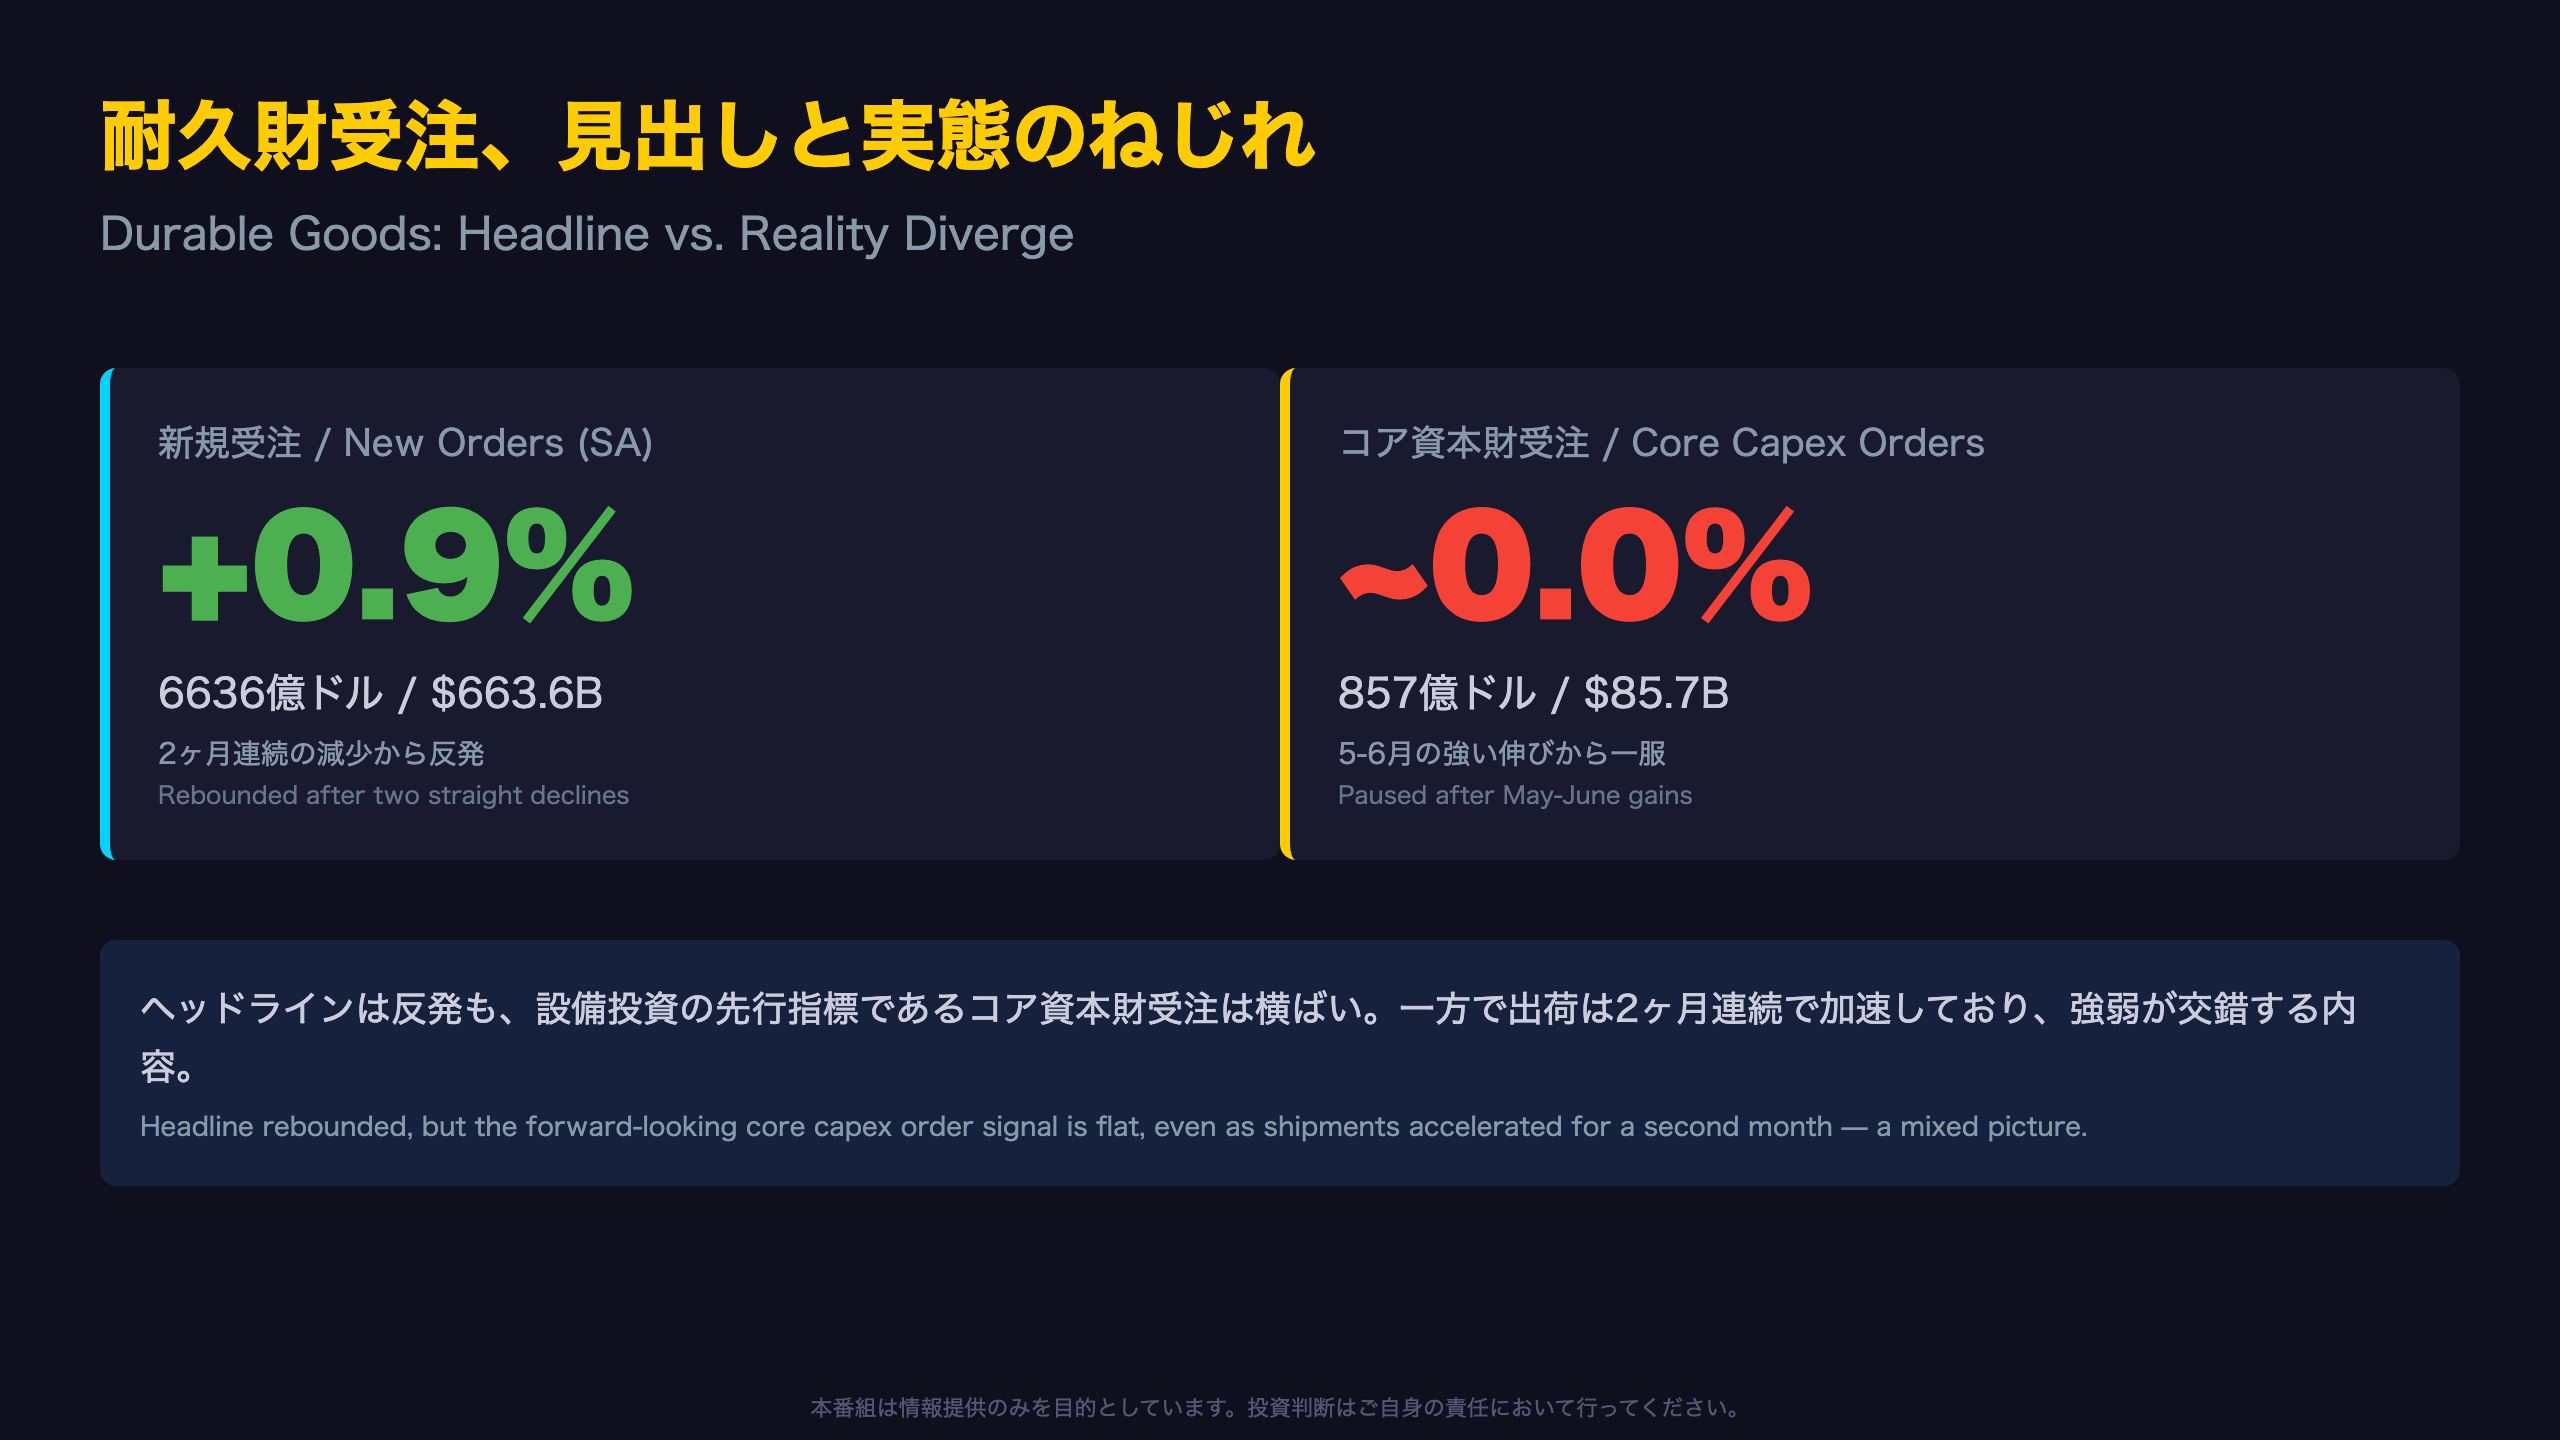
📊 The U.S. Census Bureau’s July durable goods report shows total new orders at $663.6B, up 0.9% and rebounding from two straight monthly declines.
📈 Core capital goods shipments — the real-time gauge of capex execution — rose over 1% for a second consecutive month.
⚠️ But core capital goods orders, the forward-looking proxy for business investment, came in essentially flat after May and June’s strong gains.
💡 Volatile transportation and defense orders inflated the headline number. We break down what it really means for investors. Next release: Oct 2.
耐久財受注、見出しと実態のねじれ
Understanding the Census Bureau’s M3 Survey
The Manufacturers’ Shipments, Inventories, and Orders (M3) survey, released monthly by the U.S. Census Bureau, tracks actual dollar-denominated new orders, shipments, backlogs and inventories across roughly 4,700 reporting units. Unlike the ISM Manufacturing PMI — a sentiment-based diffusion index — M3 reports hard transaction data, making it noisier but more concrete.
The Rebound in Context
July’s headline: total new orders rose 0.9% to $663.6 billion, “following two consecutive monthly decreases.” June’s decline was revised better, from an initially reported -0.3% ($656.5B) to -0.2% ($657.8B).
Over the trailing twelve months, month-to-month swings have ranged from -1.2% to +5.3%; the Census Bureau itself notes “statistical significance is not measurable for this survey” since the panel isn’t probability-based.
Bull vs. Bear
- Bulls: the rebound confirms demand remained intact after a soft spring.
- Bears: it’s a mechanical payback after May’s steep drop.
Market Implications
A headline beat is modestly supportive for industrials, but the more consequential question — covered later — is whether core capital goods orders confirm the strength.
全項目プラス:受注・出荷・在庫・未消化受注
Four Metrics, One Direction
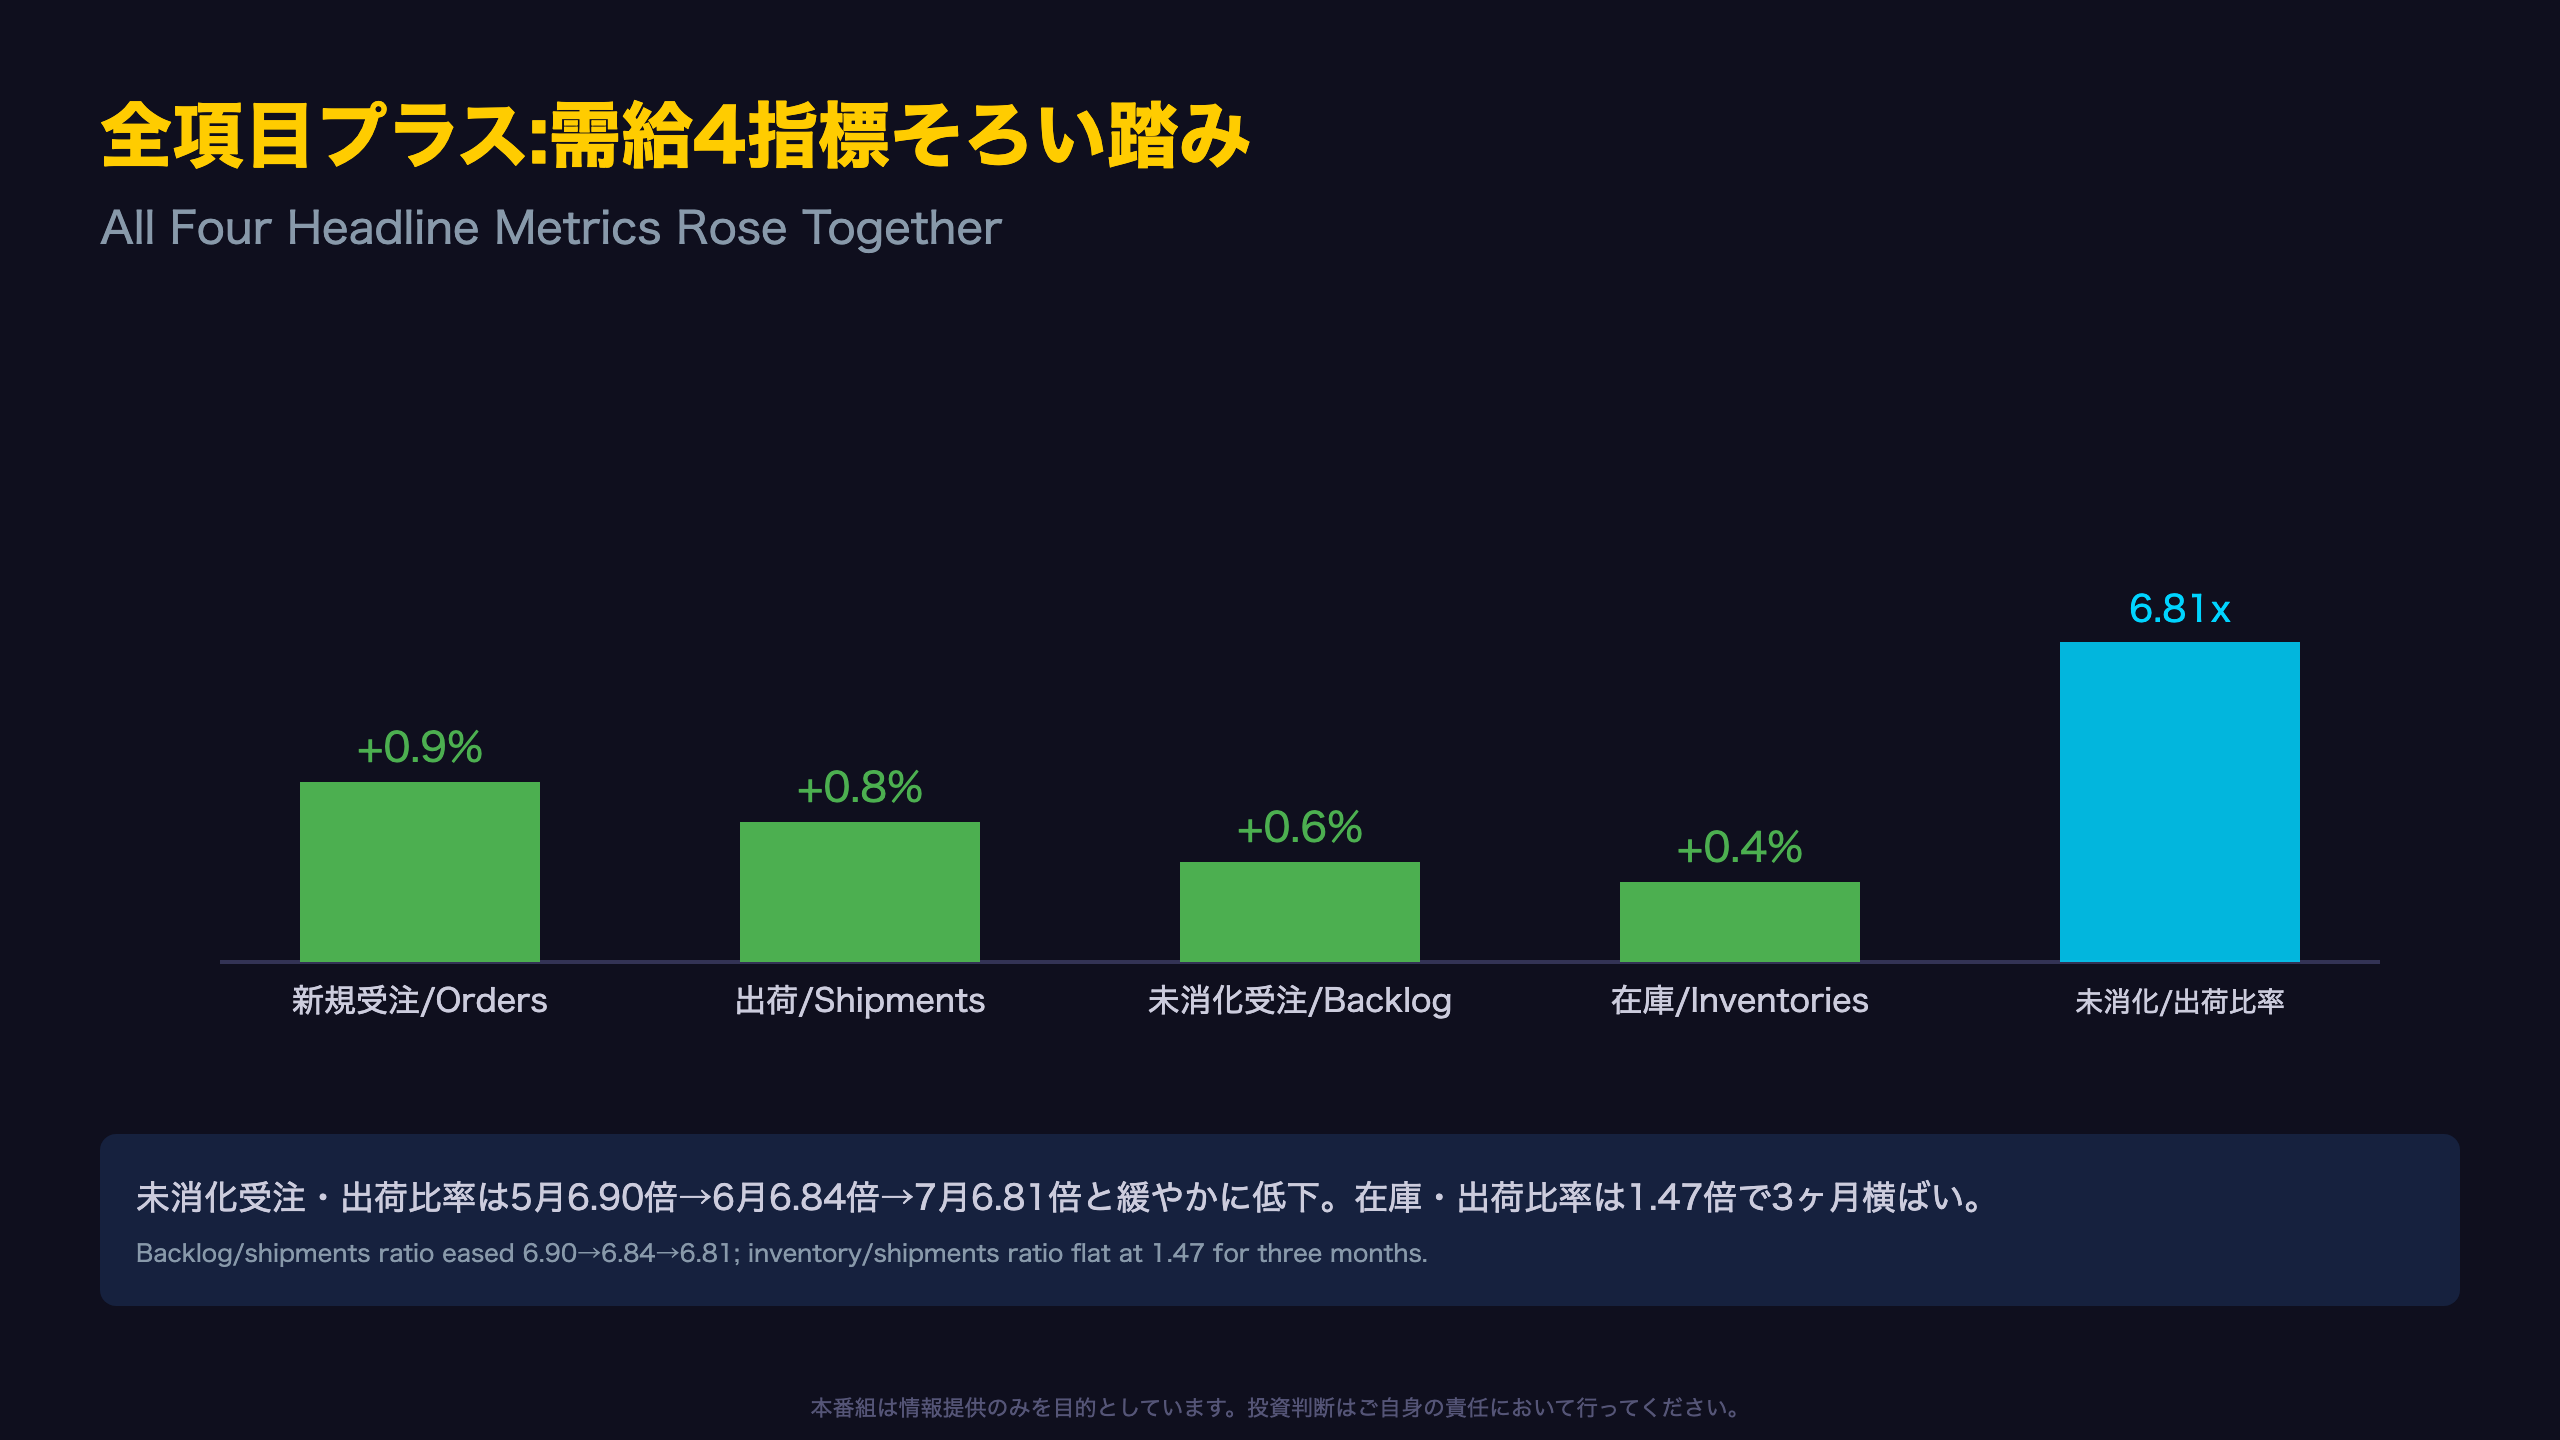
All four headline series — new orders, shipments, unfilled orders, and inventories — rose simultaneously this month. On the backlog, the release states: “Unfilled orders, up twenty-four of the last twenty-five months, increased $9.9 billion or 0.6 percent to $1,600.3 billion.”
That’s nearly two uninterrupted years of backlog growth, a signal of durable underlying manufacturing demand — a series US investors often compare loosely to the ISM’s new orders sub-index, though M3 reports dollar values rather than a diffusion index.
Ratio Trends
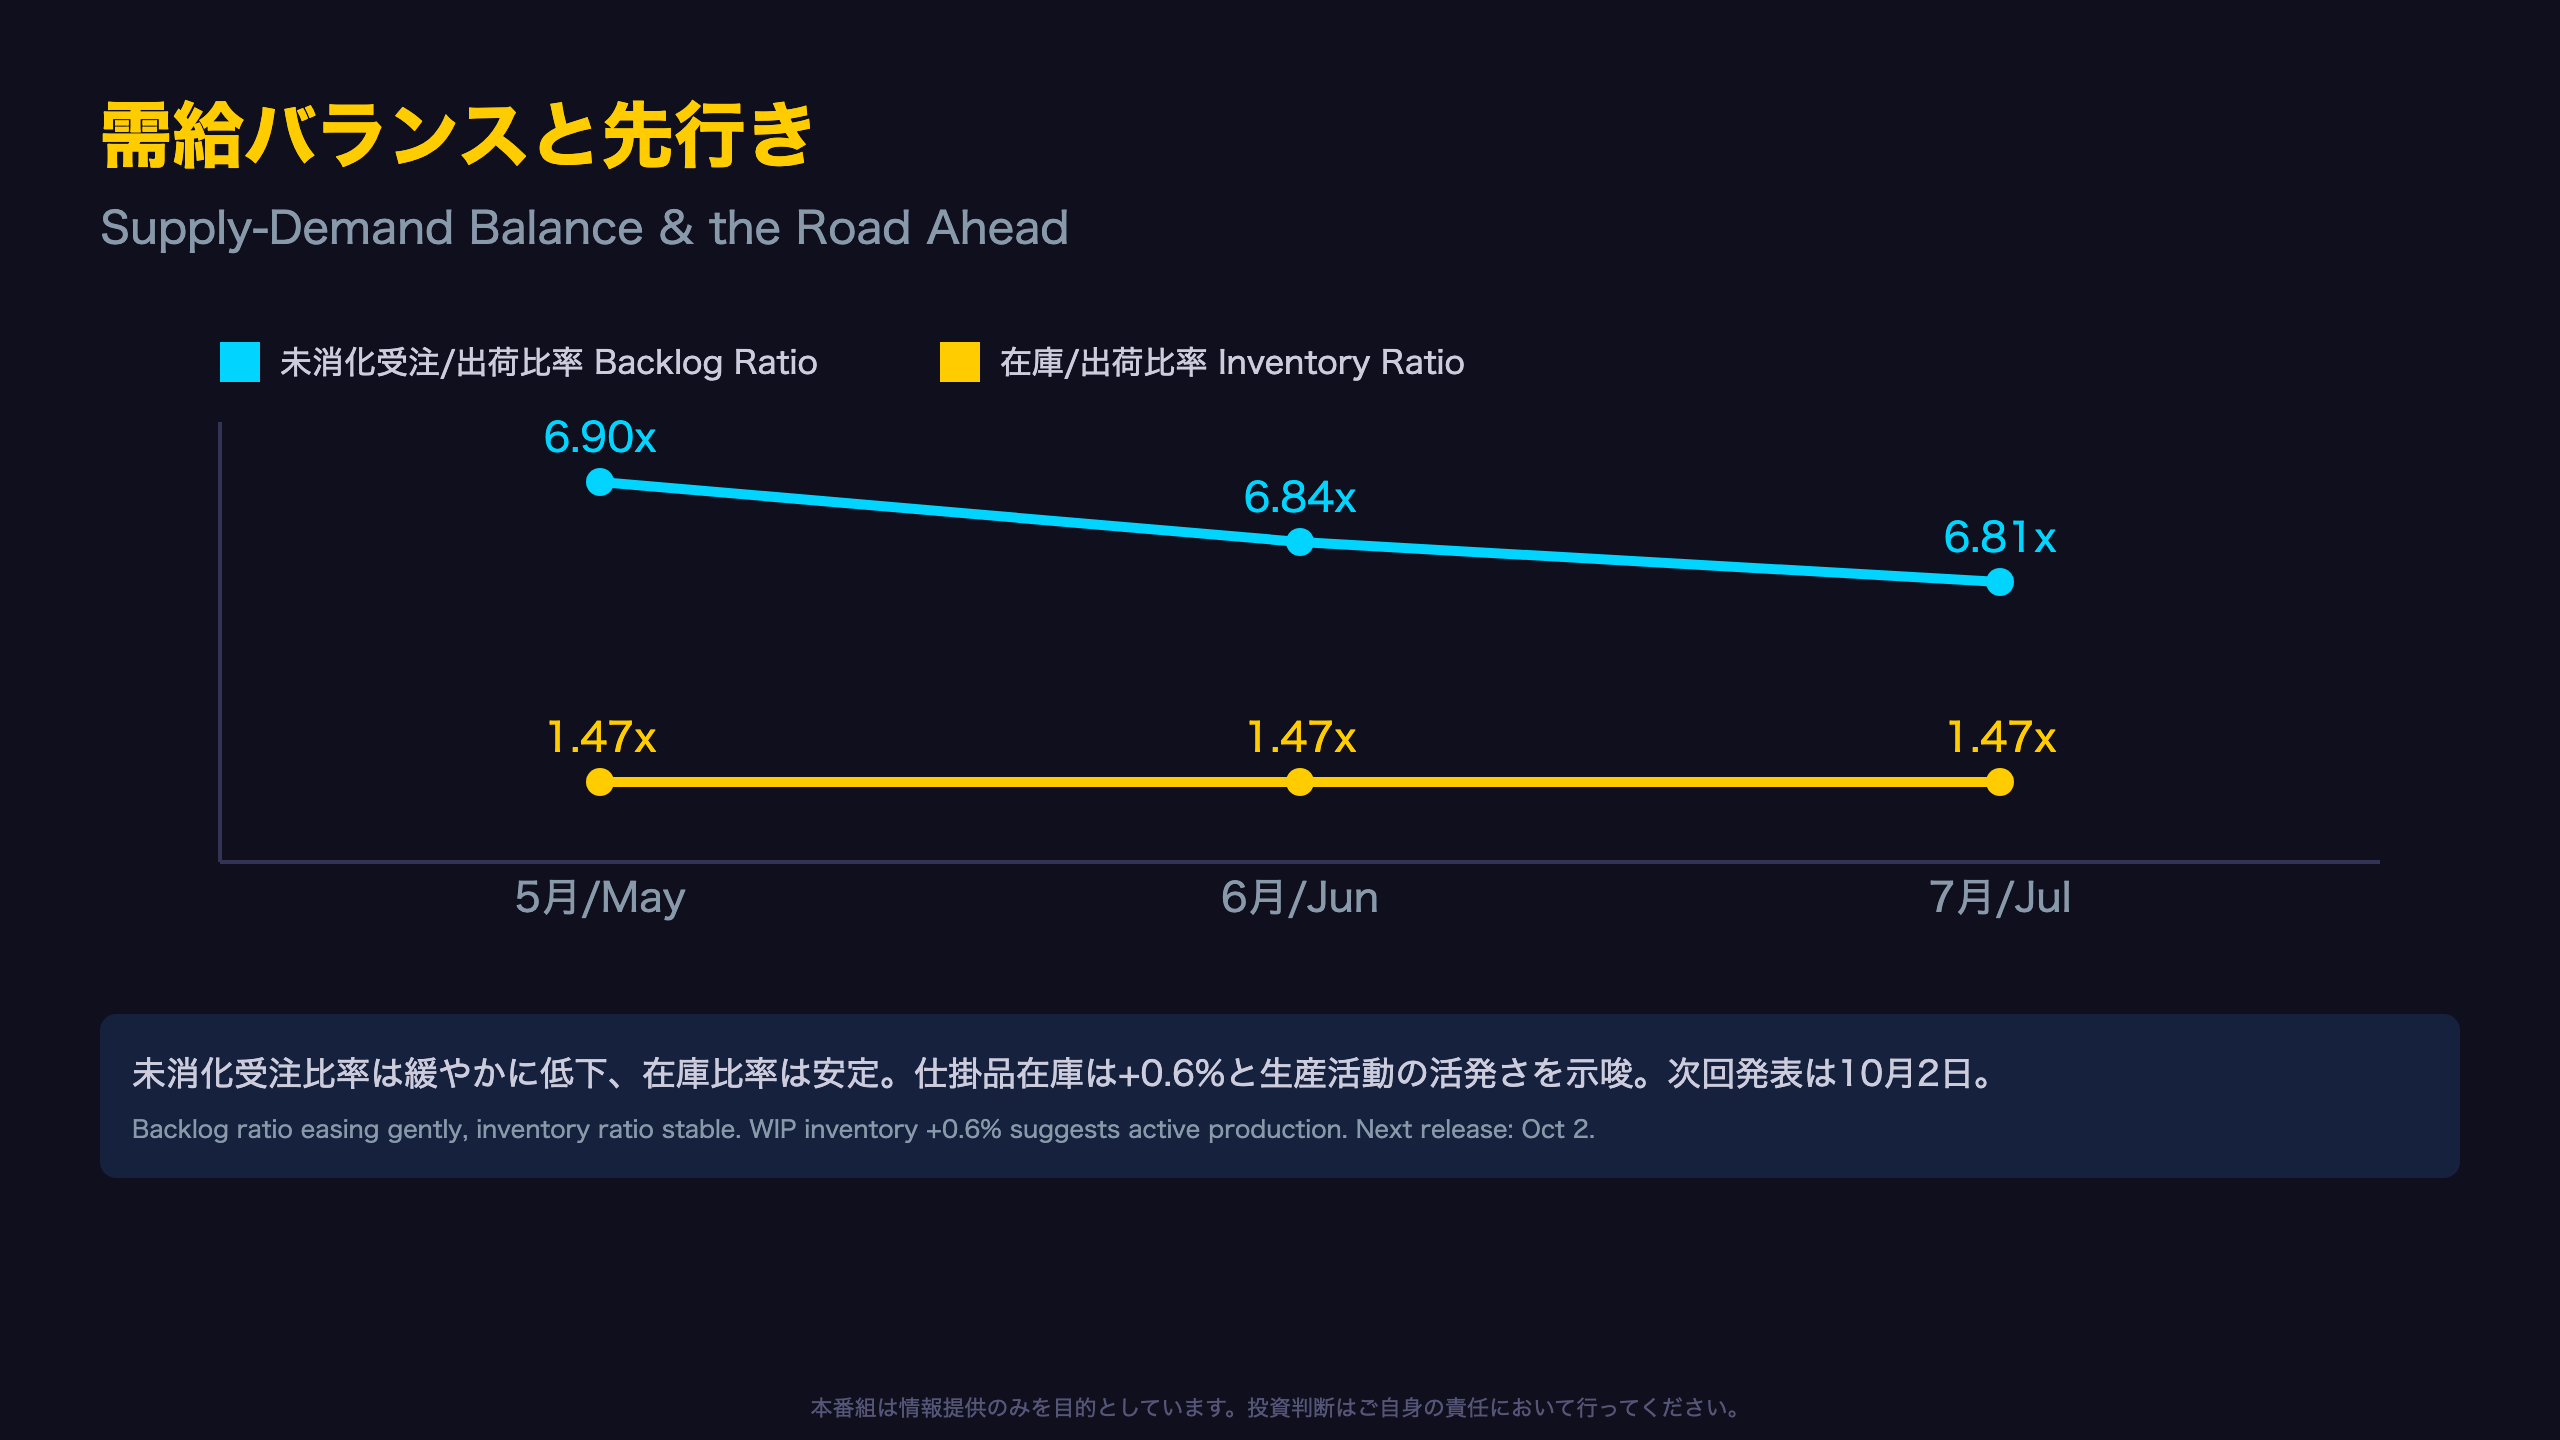
Per Table 7, the unfilled-orders-to-shipments ratio eased from 6.90 in May to 6.84 in June to 6.81 in July — a gentle decline suggesting shipments are catching up to backlog growth, not that demand is fading. The inventory-to-shipments ratio held flat at 1.47 for three straight months, showing neither excess buildup nor drawdown.
Market Implications
For equity investors in industrials, this combination — rising backlog, stable inventory ratio — is a constructive setup, implying visibility into forward production schedules without inventory-driven risk.
コア資本財:受注は足踏み、出荷は加速
Orders vs. Shipments: A Growing Gap
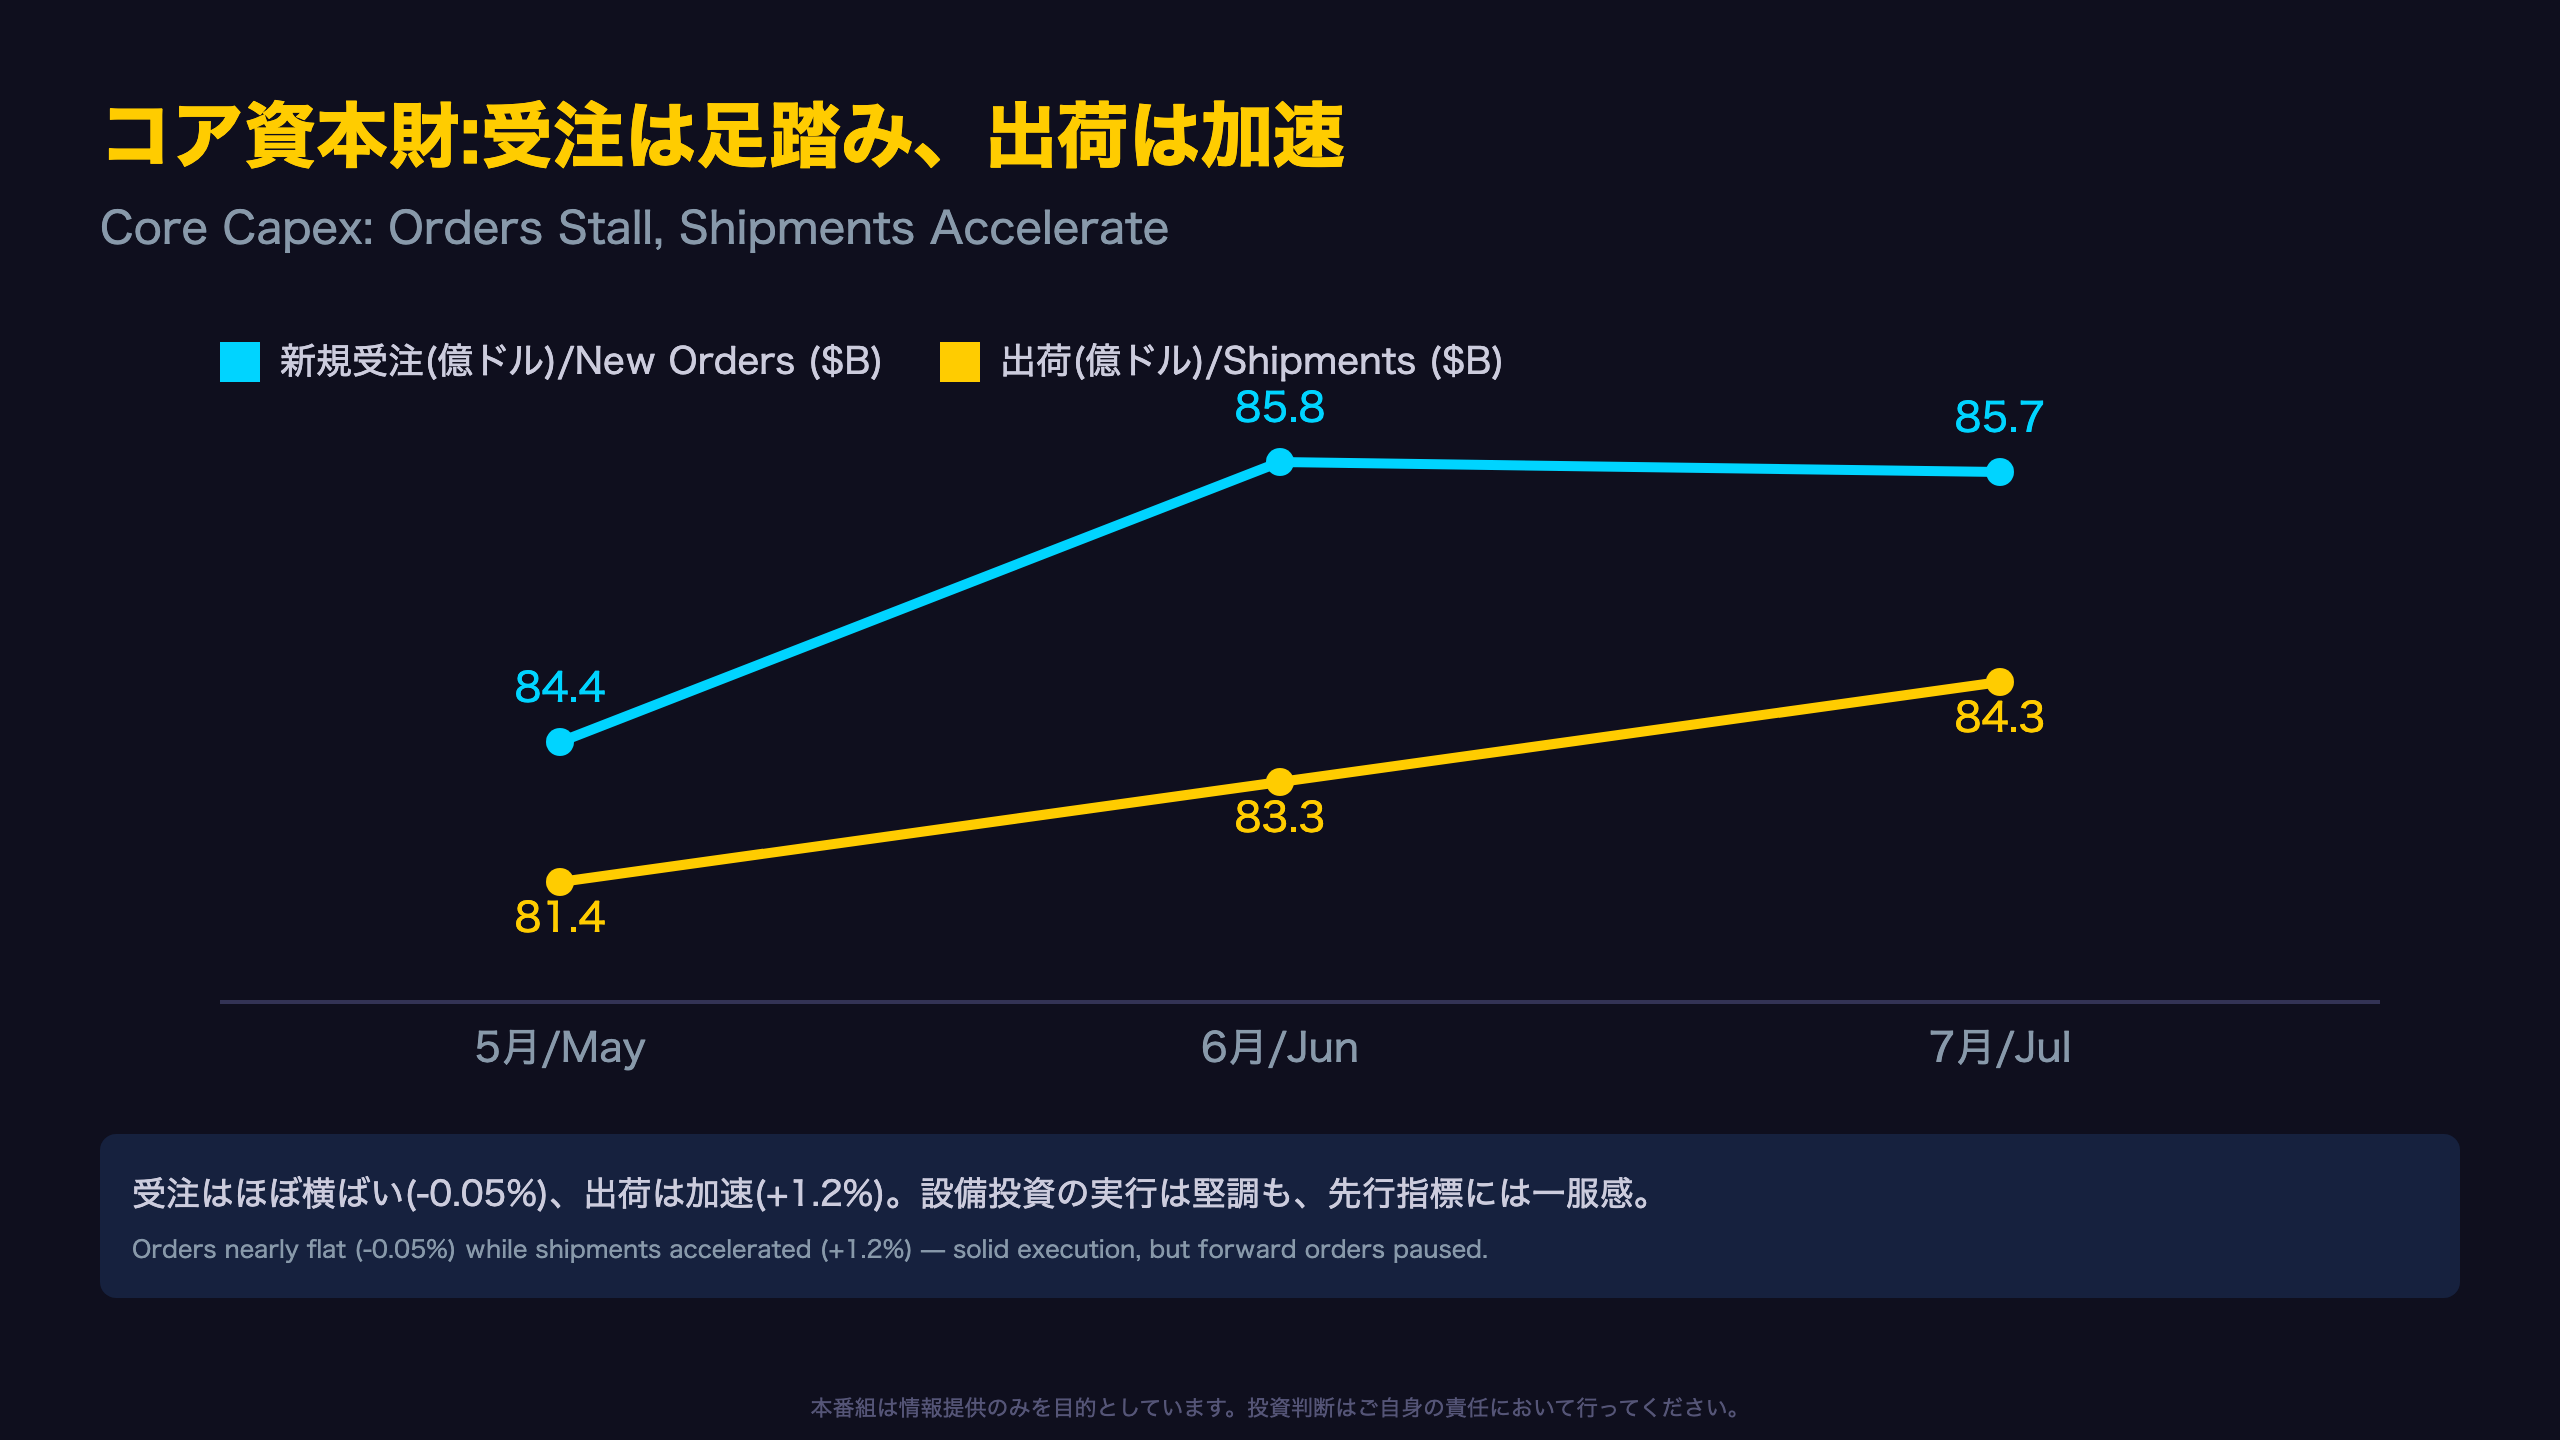
Core capital goods (nondefense capital goods excluding aircraft) — widely used by economists as a proxy for U.S. business equipment investment in GDP — show a three-month divergence:
| Month | New Orders | Shipments |
|---|---|---|
| May | $84.4B | $81.4B |
| June | $85.8B | $83.3B |
| July | $85.7B | $84.3B |
Orders were essentially flat month-over-month (-0.05%, within the Census Bureau’s own “virtually unchanged” threshold of under 0.05%), while shipments rose 1.2%, extending June’s 2.4% gain.
Two Readings
- Bullish: Shipments — which map more directly into the equipment investment line of GDP — show capex execution remains solid; the order pause is a natural breather after two strong months.
- Cautious: Orders lead shipments by design. A sustained order plateau could eventually translate into softer shipment growth in coming months.
Why This Matters for Markets
This is the exact metric the Federal Reserve and equity analysts watch when gauging real business investment appetite — more reliable than the noisy headline durable goods figure, which is often skewed by aircraft and defense contracts (see next slide). The August Advance Report, due September 25, will be the next data point to confirm whether orders reaccelerate.
輸送機器・防衛の振れが数字を歪める
The Transportation Rebound, Unpacked
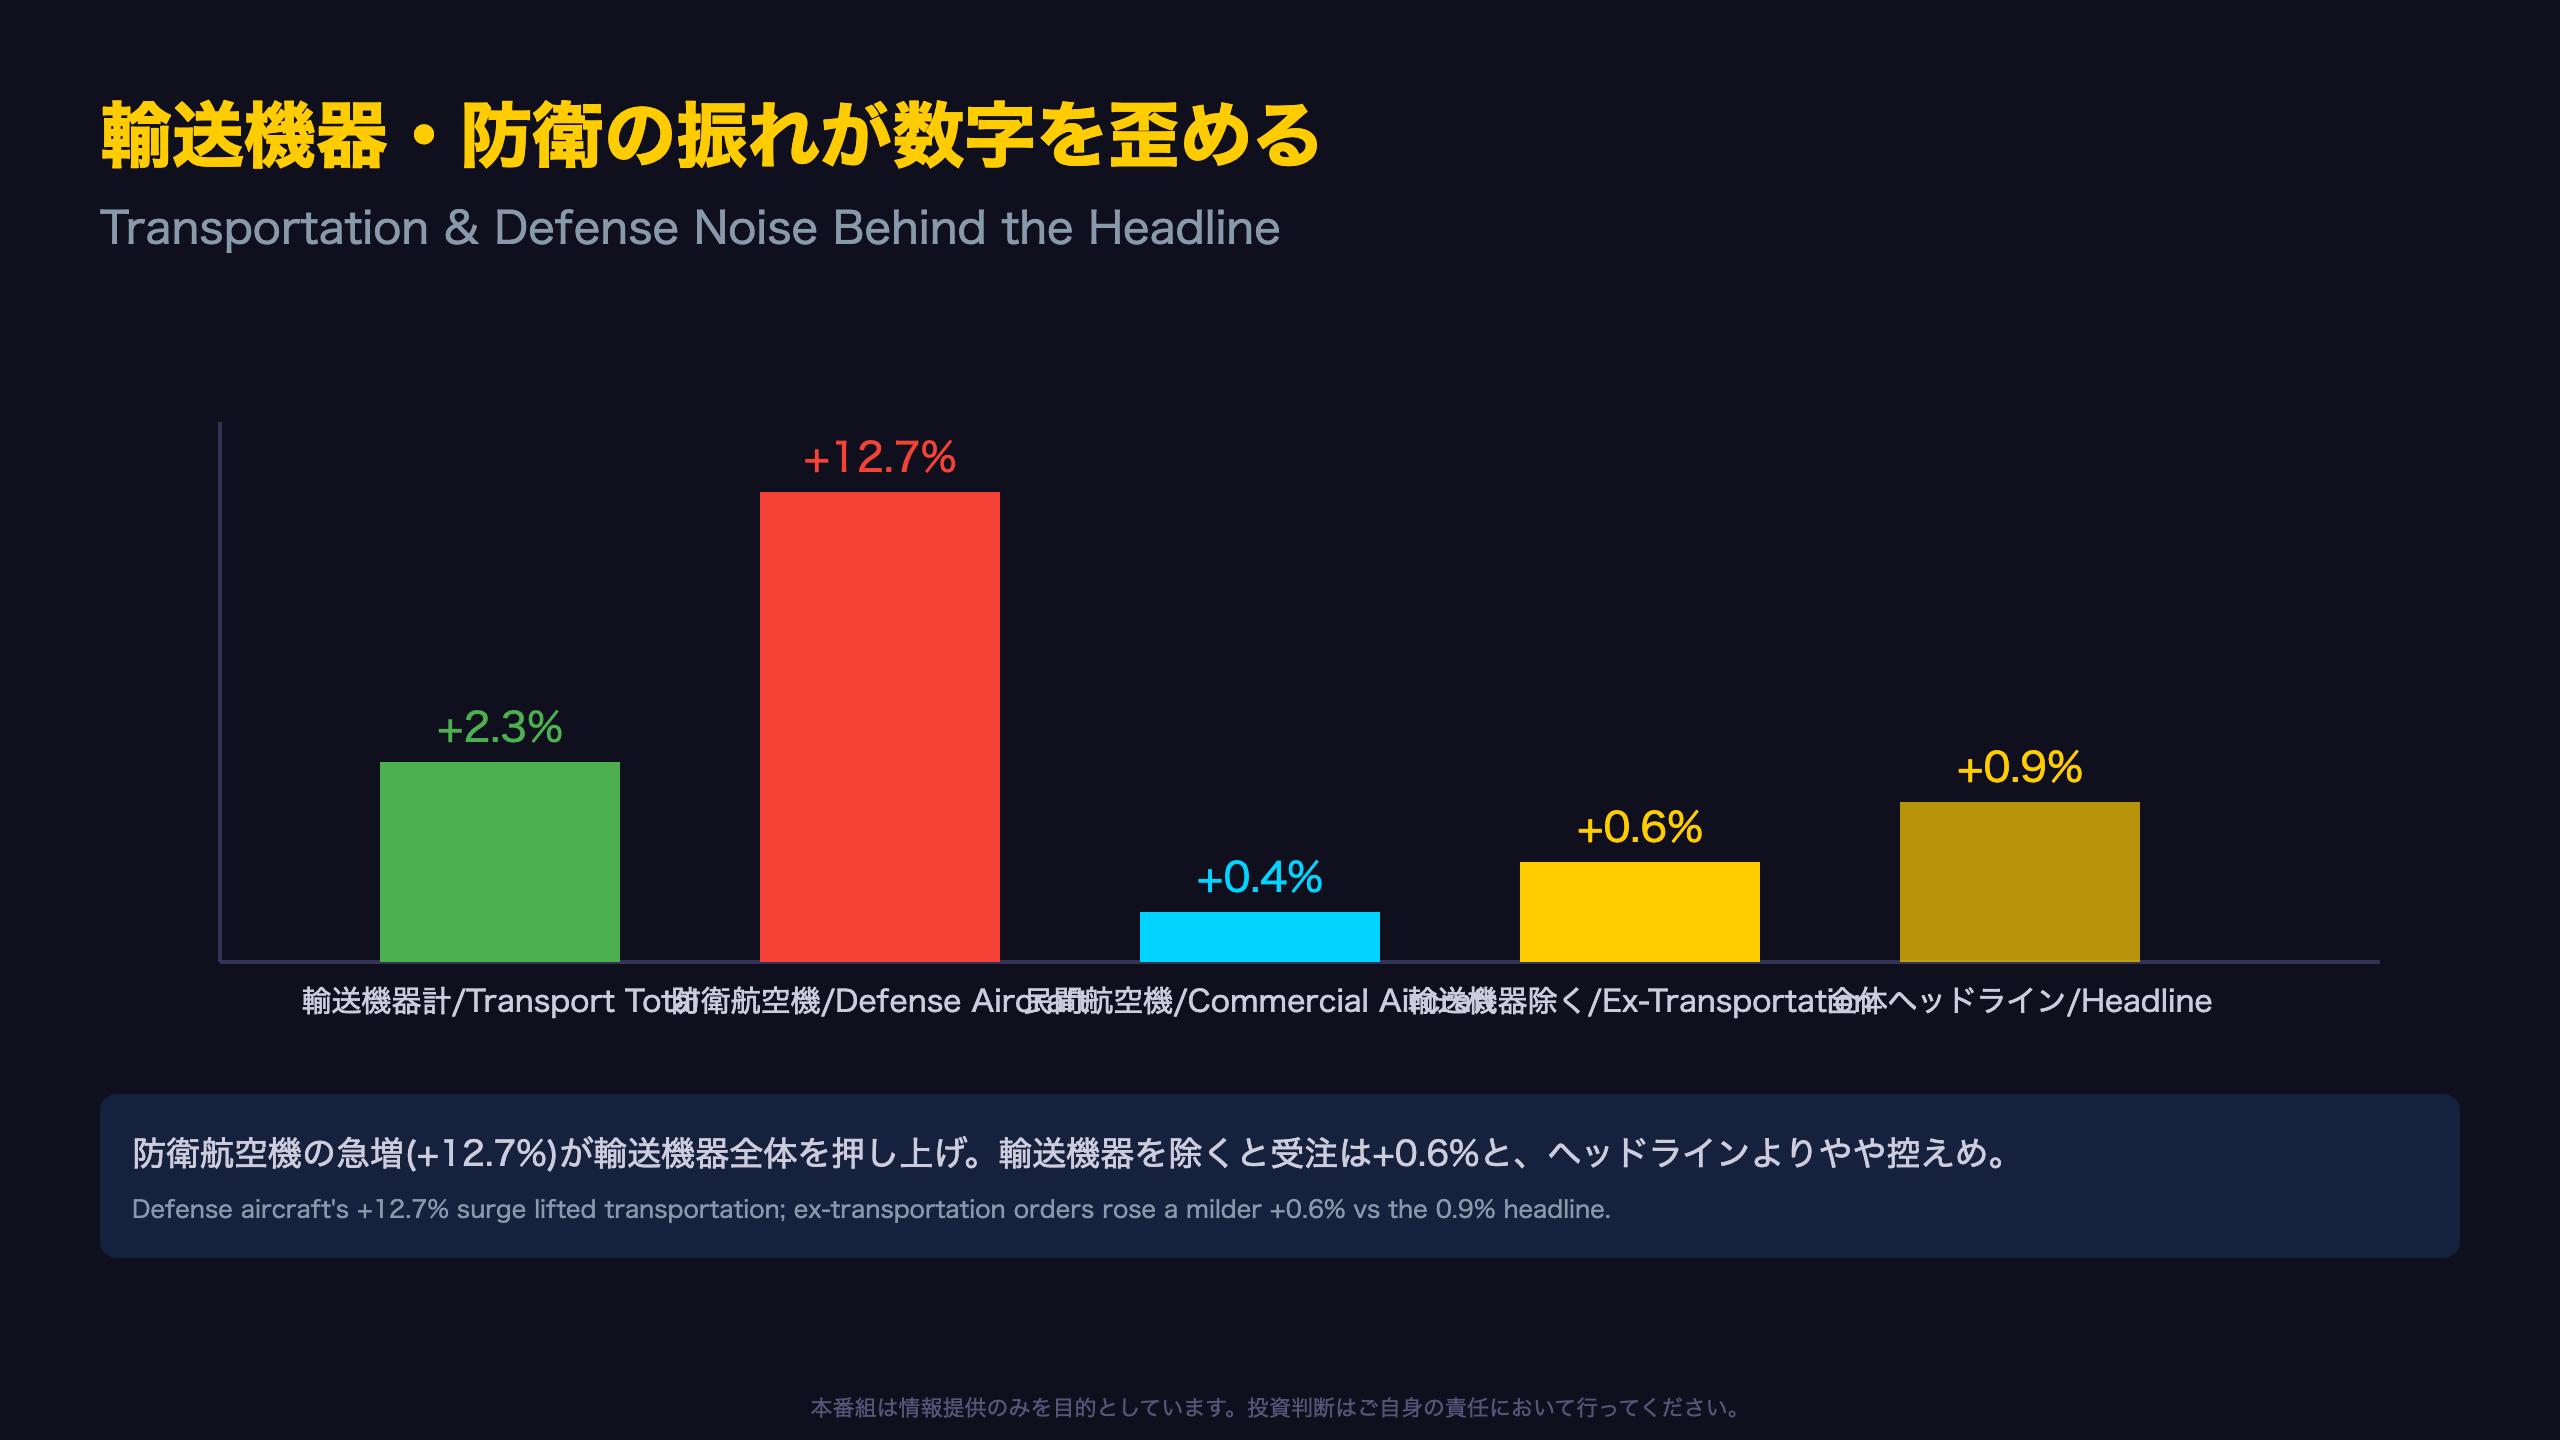
The release states: “Transportation equipment, up following two consecutive monthly decreases, led the increase, $2.6 billion or 2.3 percent to $116.2 billion.”
Within that category, defense aircraft and parts orders jumped 12.7% month-over-month (from $17.6B to $19.8B), while nondefense (commercial) aircraft orders rose just 0.4%. Defense contract bookings are notoriously lumpy — large multi-year awards can be recorded in a single month — a pattern investors will recognize from prior durable goods reports where Boeing or defense contracts single-handedly swung the headline figure.
Looking Ex-Transportation
Excluding transportation, new orders rose a more modest 0.6% — below the 0.9% headline — indicating that non-transportation industrial and consumer goods demand did not lead the July bounce. Ex-transportation shipments similarly rose 0.7%.
A Balanced Read
It would be an overreach to dismiss the entire order gain as “defense noise.” The ex-transportation figure of +0.6% is itself a respectable, broad-based increase. The correct takeaway is nuance, not dismissal: transportation/defense timing amplified, but did not fabricate, the headline improvement — a distinction that matters for anyone extrapolating this report into a broader industrial recovery narrative.
需給バランスと先行き
Reading the Production Pipeline
The release notes: “By stage of fabrication, July materials and supplies increased 0.2 percent in durable goods and decreased 0.1 percent in nondurable goods. Work in process increased 0.6 percent in durable goods and 1.1 percent in nondurable goods. Finished goods increased 0.4 percent in durable goods and 0.3 percent in nondurable goods.”
Rising work-in-process inventory typically signals active manufacturing throughput — materials being converted into finished products — rather than passive stockpiling. Finished goods inventories also rose 0.4%, which could reflect either healthy demand-matched restocking or a mild slowdown in sell-through; only subsequent shipment data will clarify which.
Ratio Trend Context
The unfilled-orders-to-shipments ratio has now declined for three straight months (6.90 → 6.84 → 6.81), though the absolute level remains historically elevated, meaning backlogs are still substantial even as the pace of accumulation slows. Whether this reflects accelerating backlog clearance or decelerating new order flow will only become clear with additional months of data.
What to Watch Next
The August Advance Report is due September 25, 2026, with the Full Report following October 2. Whether core capital goods orders reaccelerate from their current plateau — or decelerate further — will be a key signal for the trajectory of the U.S. business investment cycle, closely watched by both equity and rates markets ahead of Q3 GDP estimates.
Disclaimer: This article is for informational purposes only. All investment decisions are made solely at your own risk.