📺 Watch the Full Video Analysis
This article was automatically generated by the NFC Market Live AI analysis system. (Updated: 2026-08-10 21:55 JST)
📄 Primary Source
Banco Central do Brasil
https://www.bcb.gov.br/content/focus/focusmarketreadout/R20260807.pdf
📊 Breaking down Brazil’s central bank (BCB) Focus Market Readout, released August 7, 2026.
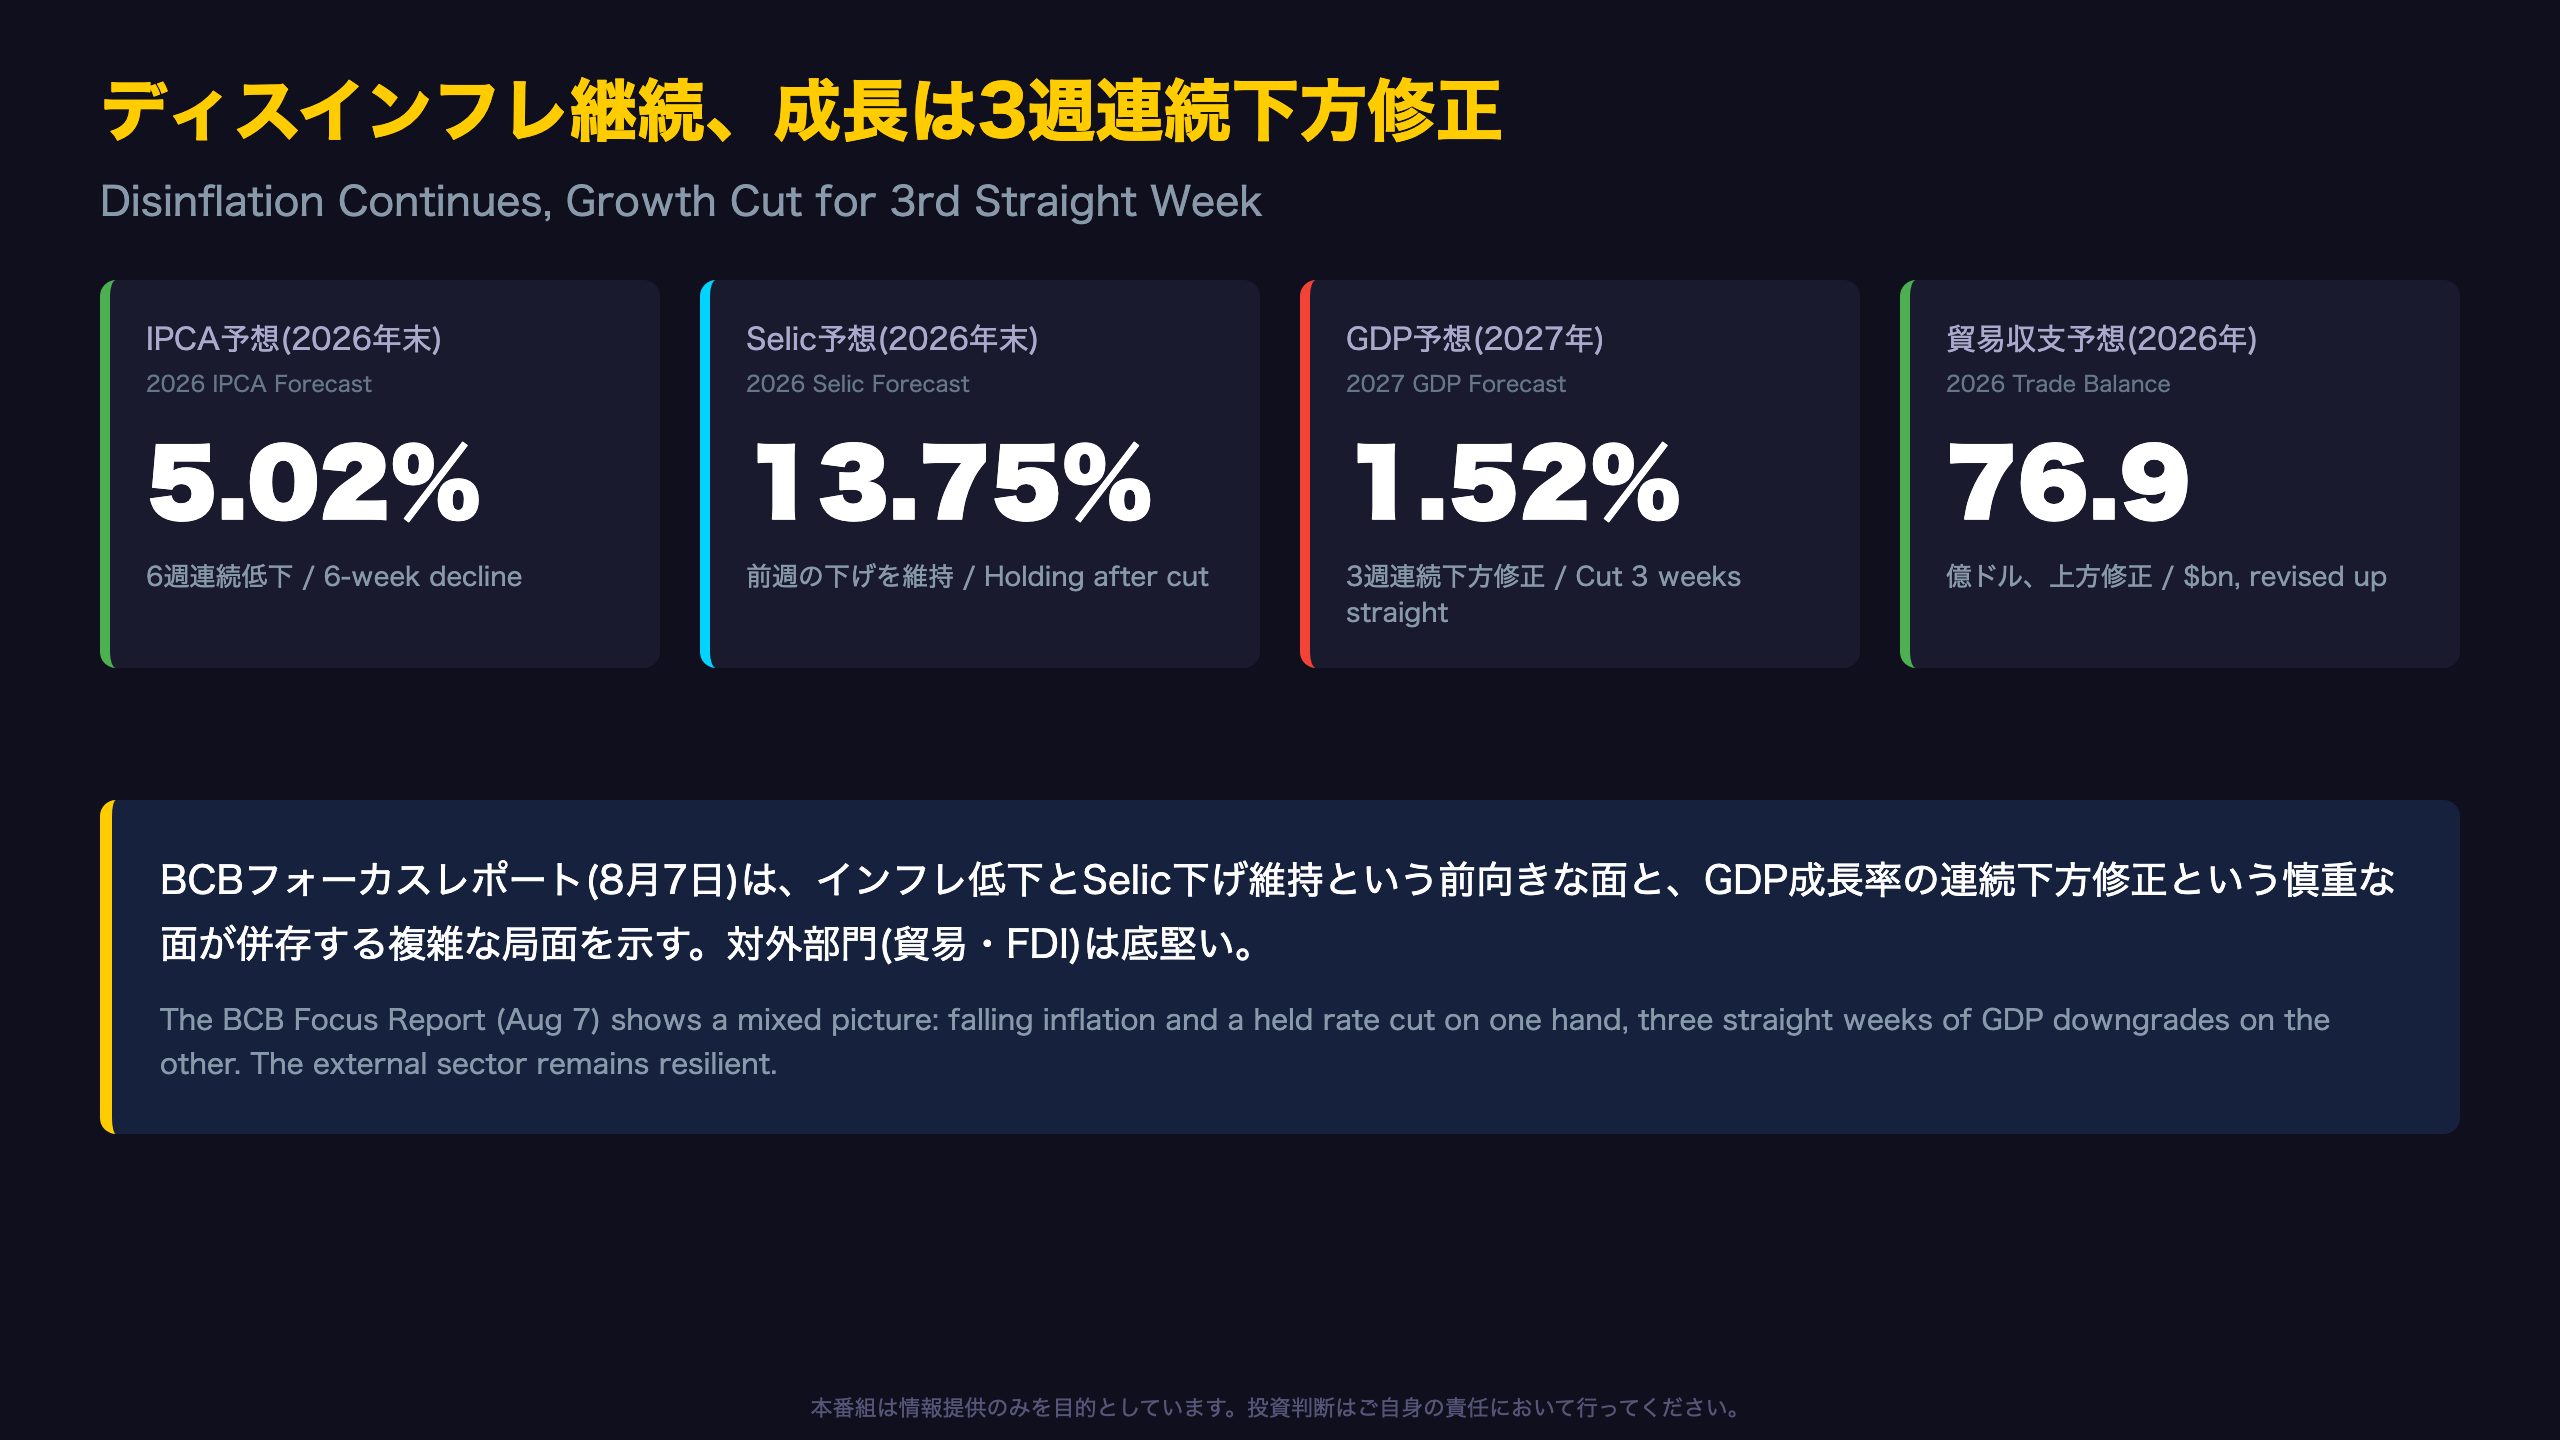
📉 The 2026 year-end inflation (IPCA) forecast fell to 5.02%, a sixth straight weekly decline.
💰 The Selic rate forecast held at 13.75%, confirming last week’s cut.
⚠️ But the 2027 GDP growth forecast was cut for a third straight week, to 1.52%.
🌎 Trade balance and FDI forecasts kept rising, showing external-sector resilience.
🇯🇵 We also break down the ~12.91-point Selic-BOJ rate gap and what it means for BRL/JPY carry trades.
総括:ディスインフレ継続と成長減速の同時進行
What the Focus Report Represents
The BCB Focus Market Readout aggregates weekly forecasts from more than 130 economists and financial institutions across Brazil, and critically, it is not just a private-sector survey. Brazil’s central bank (Banco Central do Brasil, BCB) formally uses this median dataset as an input into its own COPOM (Monetary Policy Committee) decisions. In effect, this report shows how the BCB itself is tracking market expectations in real time, making it one of the most closely watched data releases for anyone trading Brazilian rates or the real (BRL).
Four-Week Trend Context
- IPCA (2026 year-end): 5.16% to 5.03% to 5.02%, a sixth consecutive weekly decline
- Selic (2026 year-end): cut from 14.00% to 13.75% in the week of July 31, now held steady for two weeks
- GDP (2027): revised down for a third straight week, from 1.65% to 1.52%
Reading Both Sides
For investors used to the Fed or ECB, the closest comparison is the New York Fed’s Survey of Consumer Expectations or the ECB Survey of Professional Forecasters, except Focus is published weekly, not quarterly, giving a much higher-frequency read on shifting sentiment.
The continued disinflation trend and confirmed Selic cut support the case that Brazil’s historically restrictive real interest rates are working as intended. But the parallel downgrade in 2027 growth forecasts hints that this disinflation may be partly demand-driven rather than purely supply-side, a nuance that neither a purely bullish nor bearish reading captures well.
The next Focus release is due August 14, following the next COPOM decision window, and will be the key test of whether the 13.75% year-end Selic median holds.
Selic金利予想パス:長期ゾーンの安定性
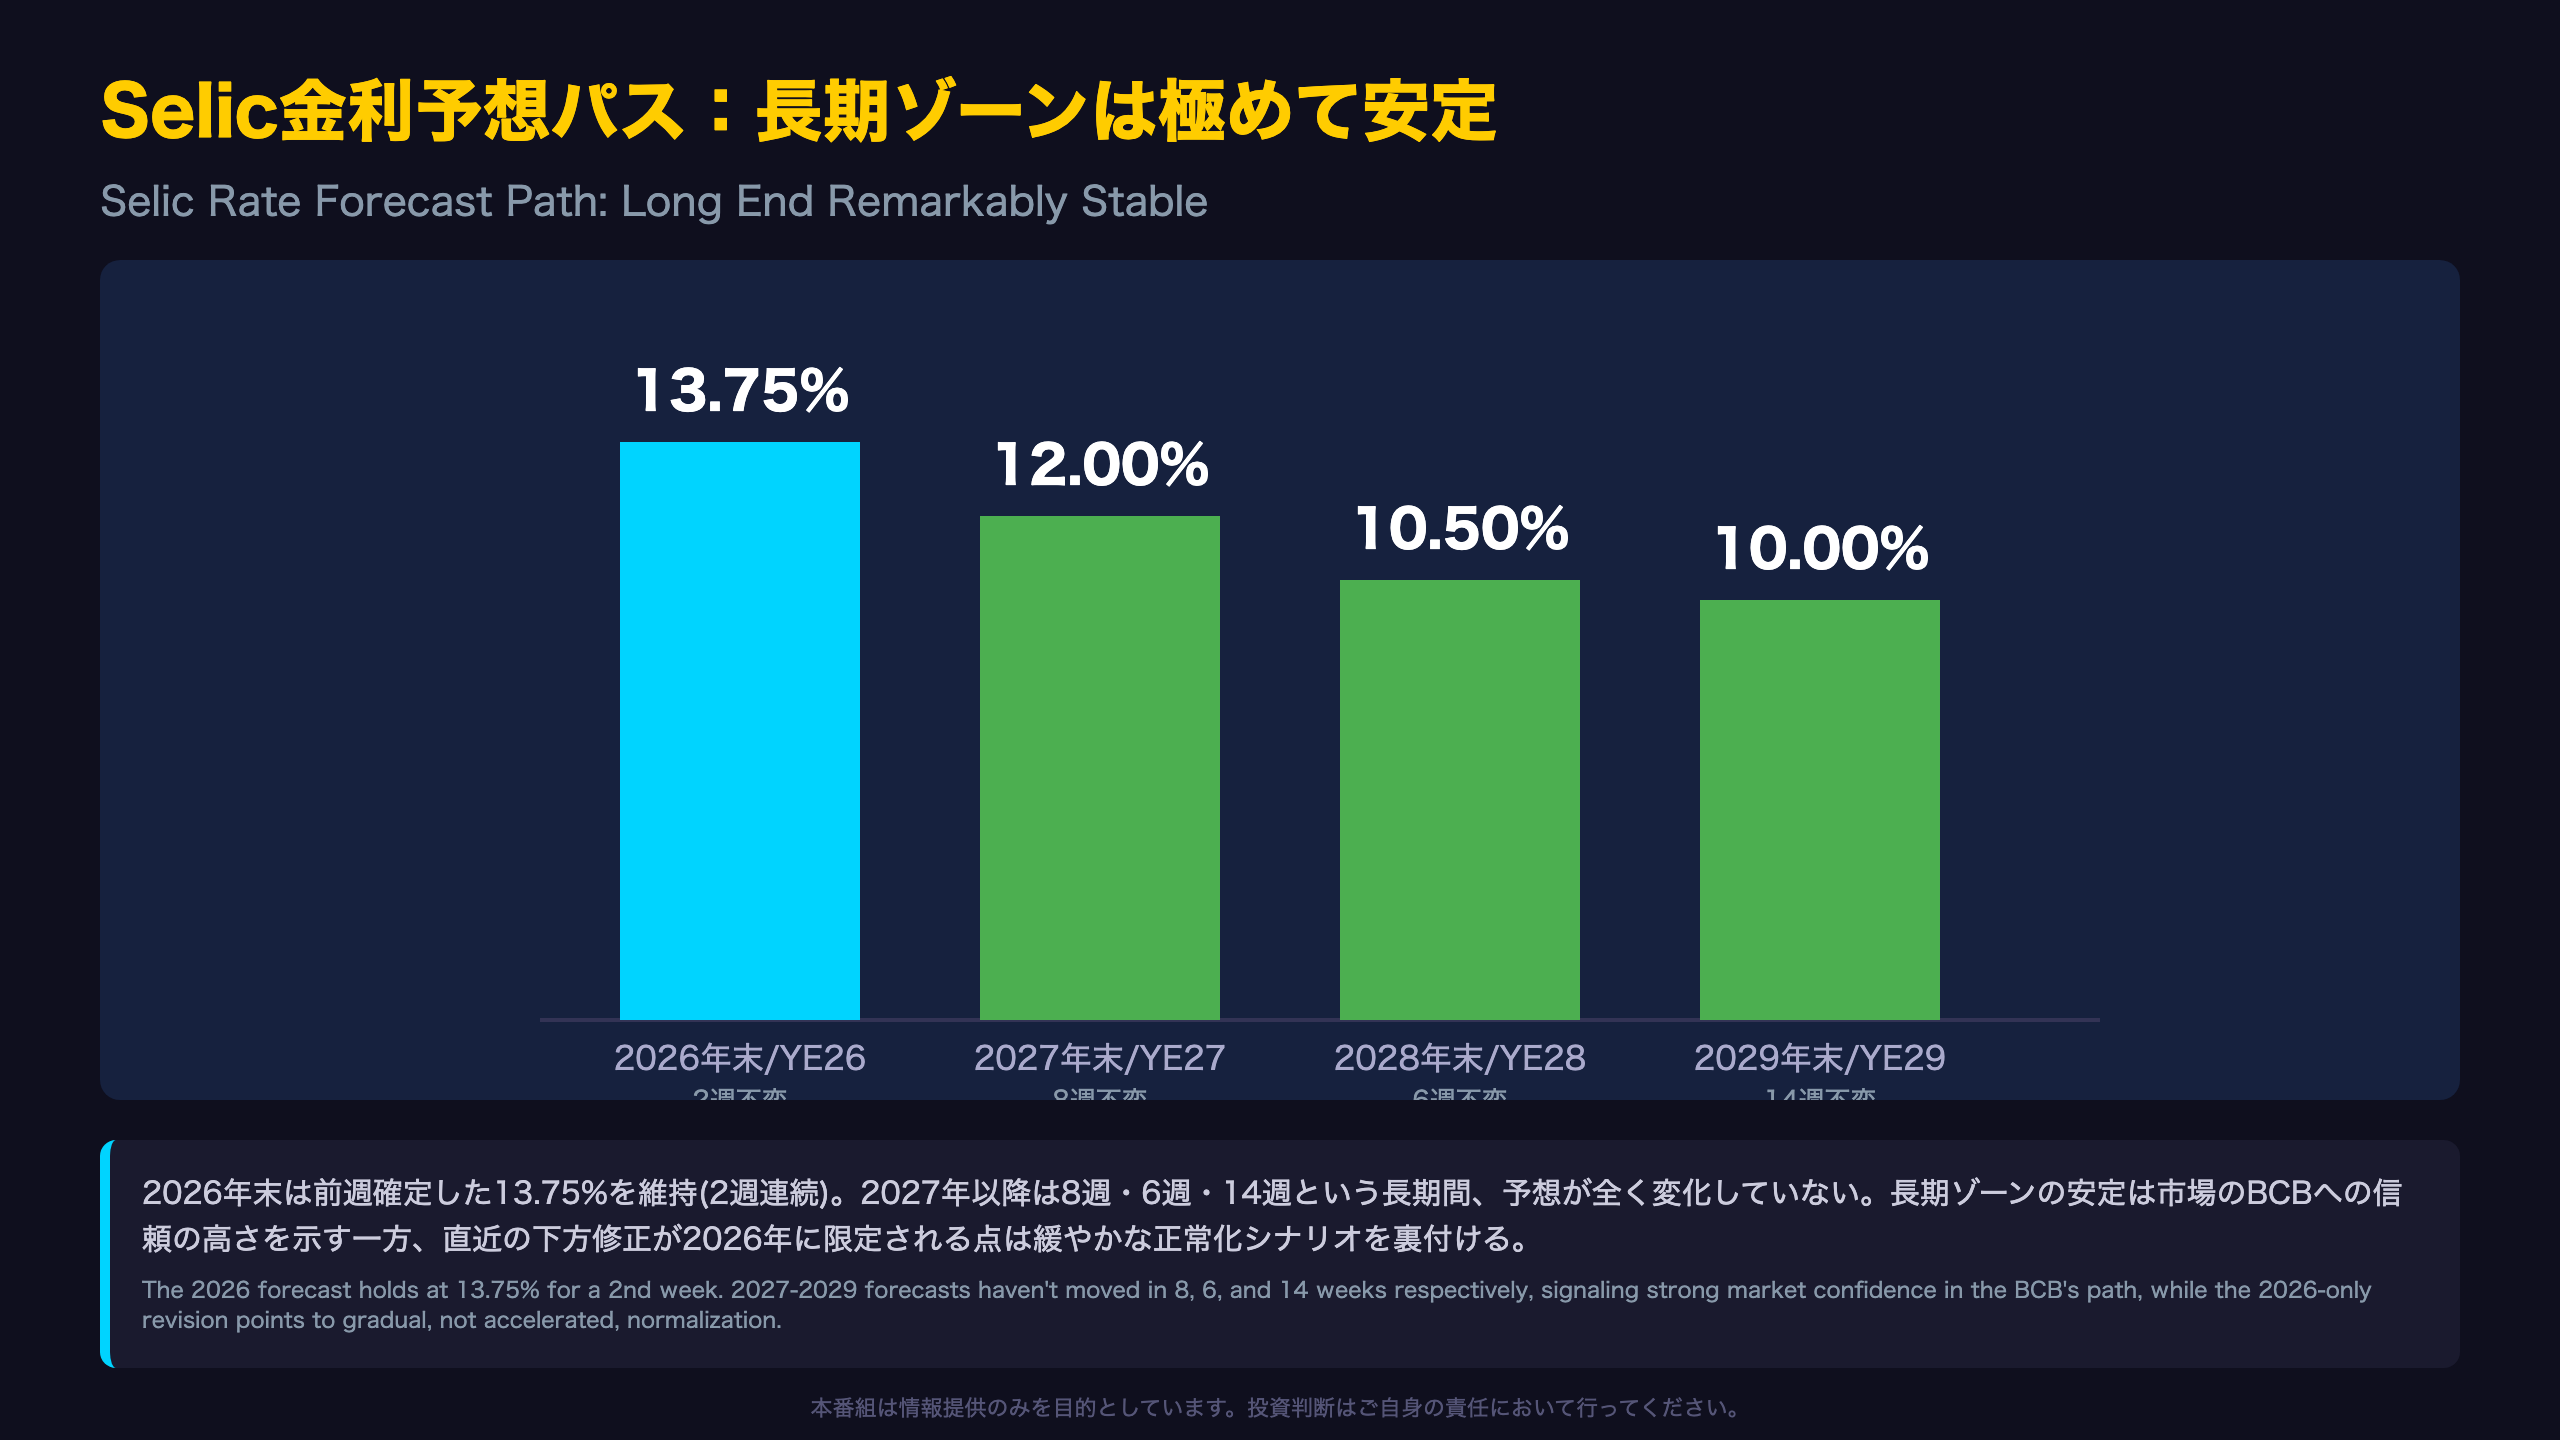
Decoding the Selic Forecast Curve
| Year-end | Median forecast | Weeks unchanged |
|---|---|---|
| 2026 | 13.75% | 2 (after cut from 14.00%) |
| 2027 | 12.00% | 8 |
| 2028 | 10.50% | 6 |
| 2029 | 10.00% | 14 |
For context, Brazil’s Selic rate is the equivalent of the U.S. Fed Funds Rate or Japan’s policy rate, the BCB’s main tool for setting the cost of credit economy-wide. A rate near 14% (as recently as late July) is extraordinarily high by developed-market standards, reflecting Brazil’s structurally elevated inflation risk premium and historically volatile currency.
Why Long-Dated Forecasts Barely Move
The remarkable stability of the 2027-2029 forecasts, unchanged for 8, 6, and 14 weeks respectively, signals that professional forecasters have high conviction in the BCB’s medium-term disinflation and normalization path. The 2029 terminal estimate of 10.00% is consistent with the equally stable 3.50% IPCA forecast for that year (unchanged for 49 weeks), suggesting the market has converged on a scenario where Selic gradually declines toward a neutral real rate as inflation approaches, but doesn’t fully reach, the BCB’s 3.0% target.
By contrast, the 2026 revision, a cut from 14.00% to 13.75%, is a single, recent event that hasn’t yet built a multi-week track record. Whether the next Focus release (due August 14) shows further movement in the 2026 figure will be the key signal for whether the BCB’s near-term easing pace is accelerating or holding steady.
IPCA予想:目標レンジとの距離
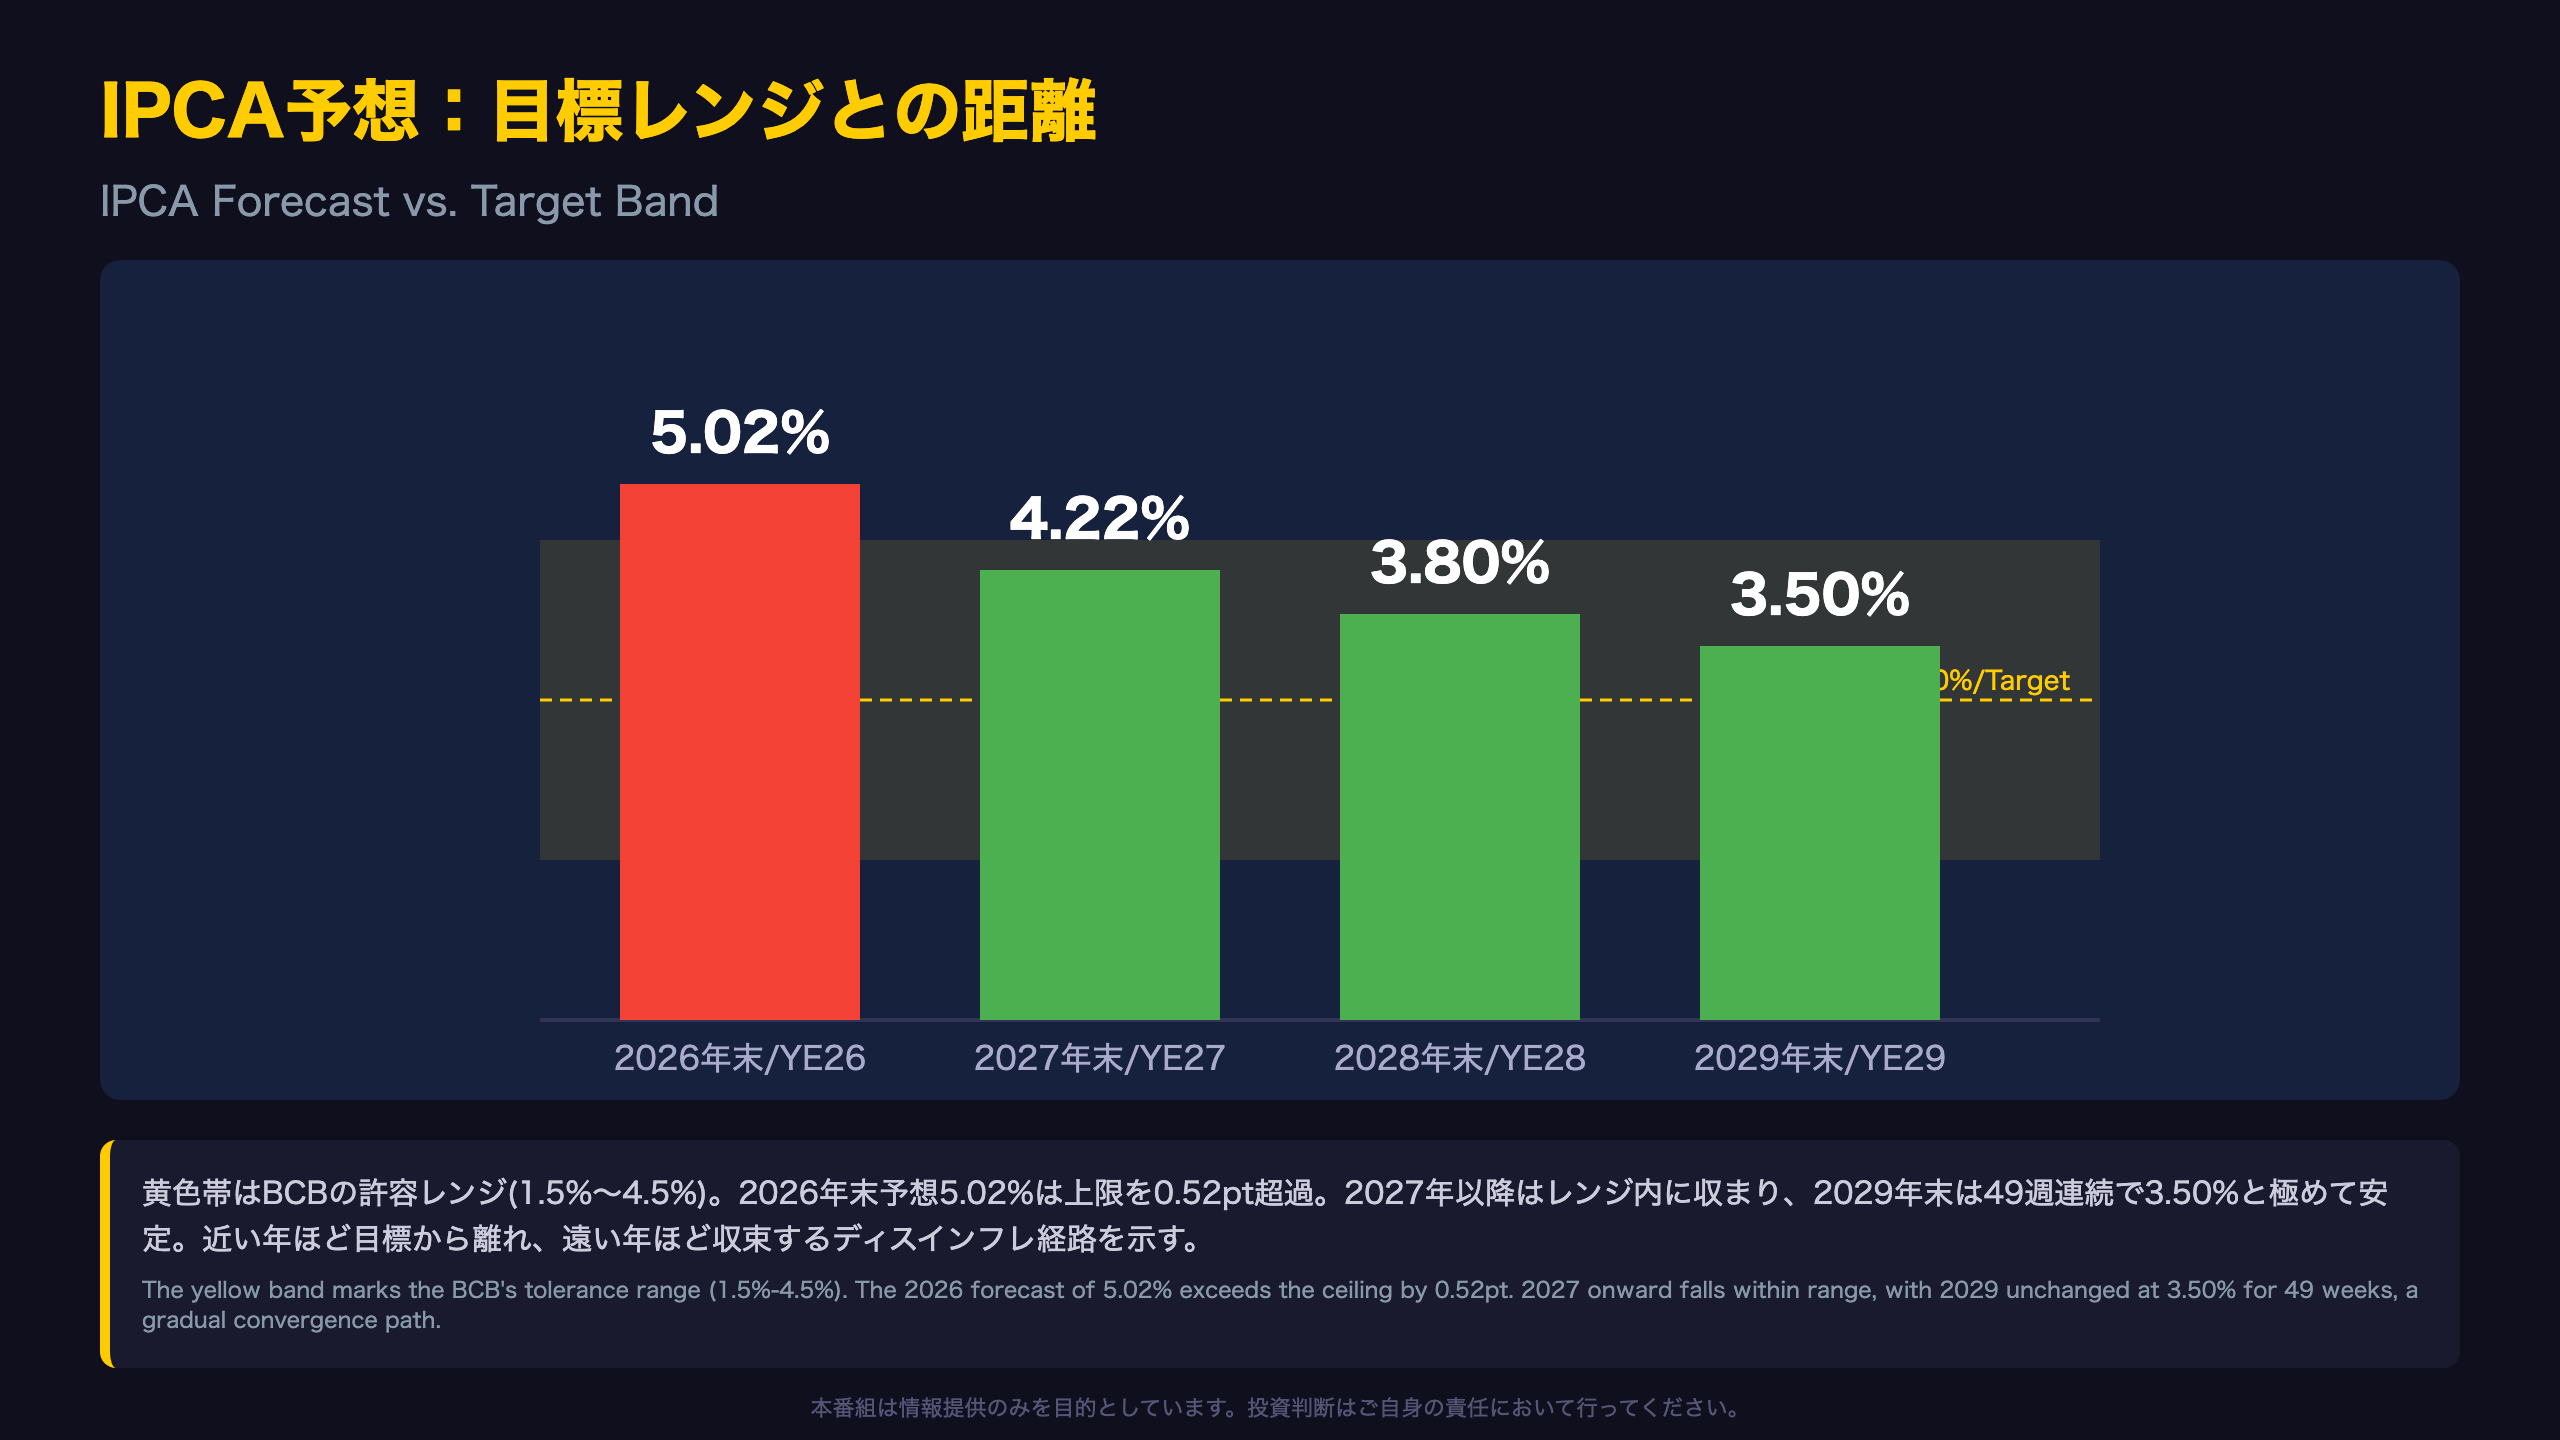
Measuring IPCA Against the Target Band
The BCB’s inflation target is 3.0%, with a tolerance band of 1.5% to 4.5%, a framework broadly similar to the Fed’s 2% target or the ECB’s close-to-2% mandate, except Brazil’s band is notably wider given its history of inflation volatility.
| Year-end | Forecast | Status vs. target band |
|---|---|---|
| 2026 | 5.02% | 0.52pt above the 4.5% ceiling |
| 2027 | 4.22% | Inside the band, near ceiling |
| 2028 | 3.80% | Inside the band |
| 2029 | 3.50% | Inside the band, unchanged 49 weeks |
The report’s own \”Weekly Trend\” column marks 2026 with \”▼(6)\”, six straight weeks of decline, while 2029 carries no arrow at all, denoted \”(49)\”, meaning literally no change in nearly a year of weekly surveys.
Two Coexisting Narratives
The first narrative is \”sticky near-term inflation\”: the fact that the 2026 forecast remains above the BCB’s ceiling, even after six weeks of gradual improvement, suggests price stickiness is somewhat stronger than a simple base-effect story would imply.
The second narrative is \”durable long-term credibility\”: a forecast that hasn’t budged in 49 weeks is a strong signal that professional forecasters trust the BCB’s disinflation framework will eventually deliver inflation near target, even if the path there is slow.
Neither the \”inflation is beaten\” nor the \”inflation is out of control\” framing is supported by this data in isolation, the reality sits between the two, and international investors should resist forcing a binary read.
GDP減速シグナル vs 対外部門の強さ
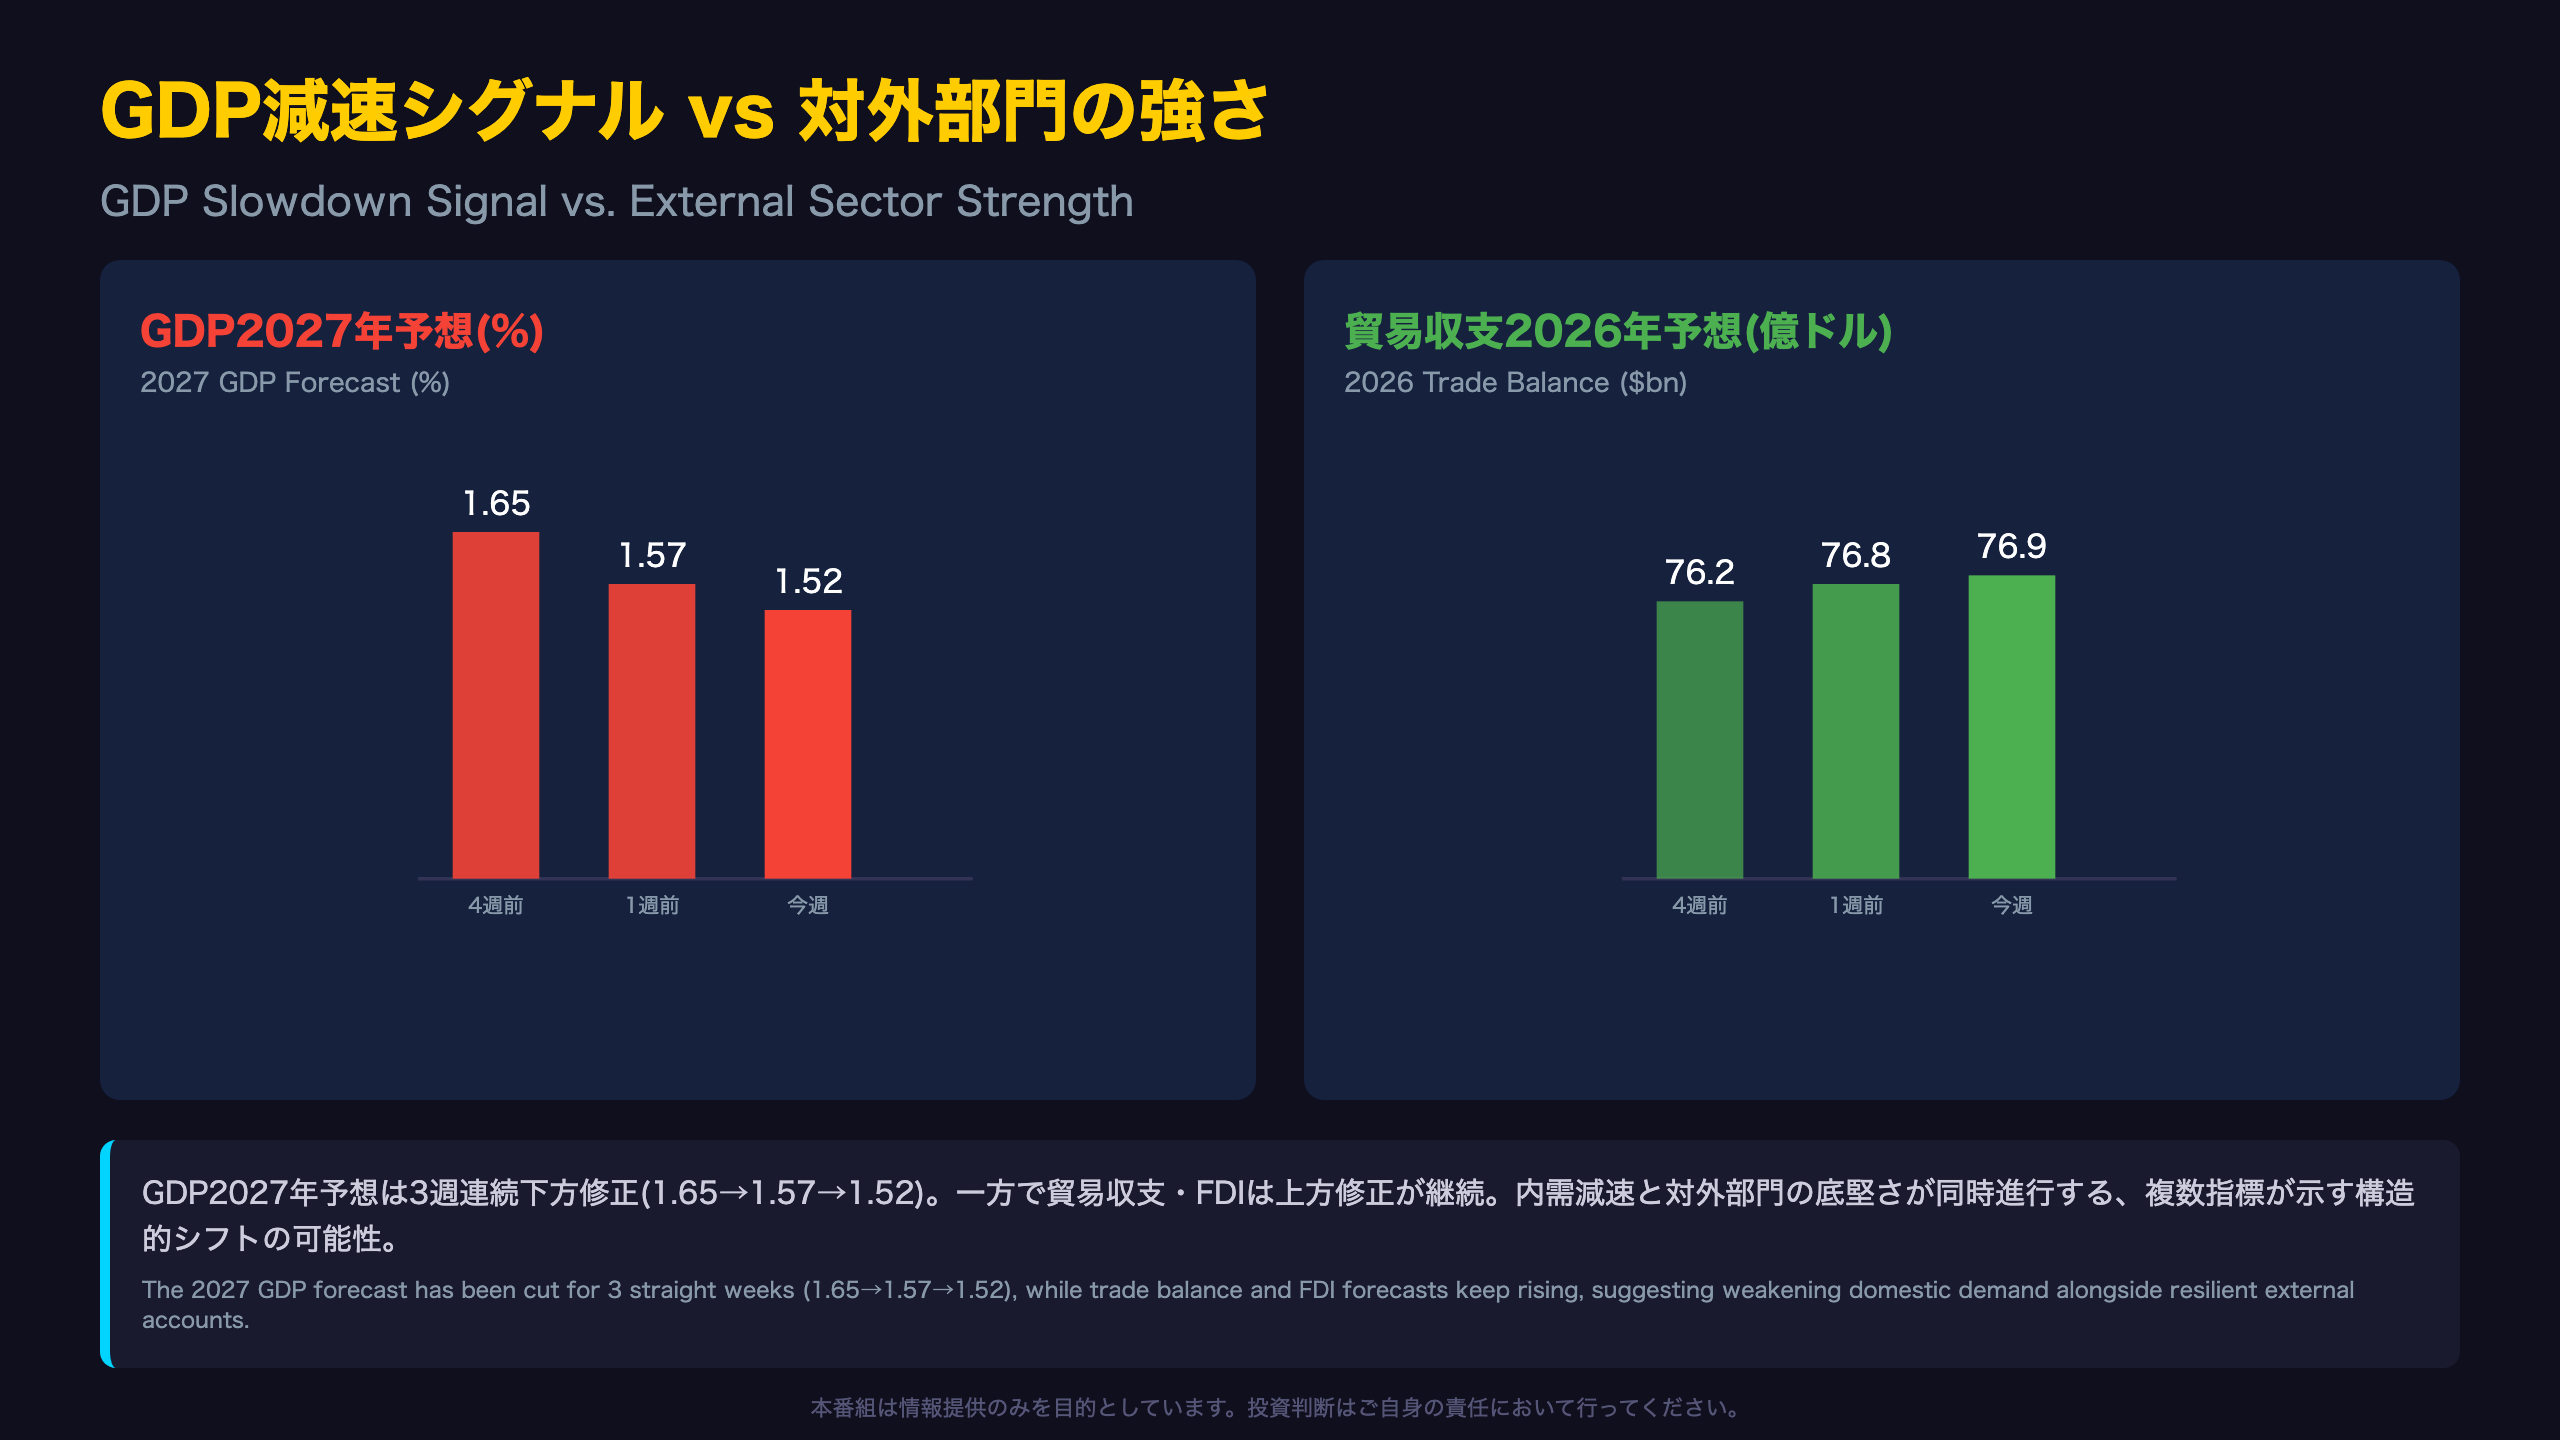
GDP and the External Sector Are Pointing in Opposite Directions
Looking back four weeks, the 2027 GDP growth forecast has moved from 1.65% to 1.57% to 1.52%, three consecutive weekly downgrades. The report’s own \”Weekly Trend\” column confirms this with a \”▼(3)\” marker, indicating this is a sustained multi-week revision rather than a single noisy data point.
The external sector tells a different story entirely:
| Indicator (2026) | 4 weeks ago | Today |
|---|---|---|
| Trade balance (US$ bn) | 76.20 | 76.90 |
| Foreign direct investment (US$ bn) | 76.00 | 78.48 |
Both trade balance and FDI forecasts have been revised upward for multiple consecutive weeks, this is not noise either.
Reconciling the Two Signals
For context, U.S. investors can think of this dynamic as somewhat analogous to a scenario where high policy rates cool domestic demand while simultaneously strengthening the currency’s external position through capital inflows and export competitiveness. Given that multiple independent indicators (GDP down, trade/FDI up) are moving in a consistent pattern, it’s reasonable to suggest, though not to conclusively prove from a single data release, that Brazil’s restrictive rate stance may be doing exactly what textbook monetary tightening is designed to do: suppress domestic consumption while supporting the currency and external accounts. This is a constructive-but-cautious signal, not an unambiguous win for either bulls or bears.
為替は安定、財政赤字は深いまま
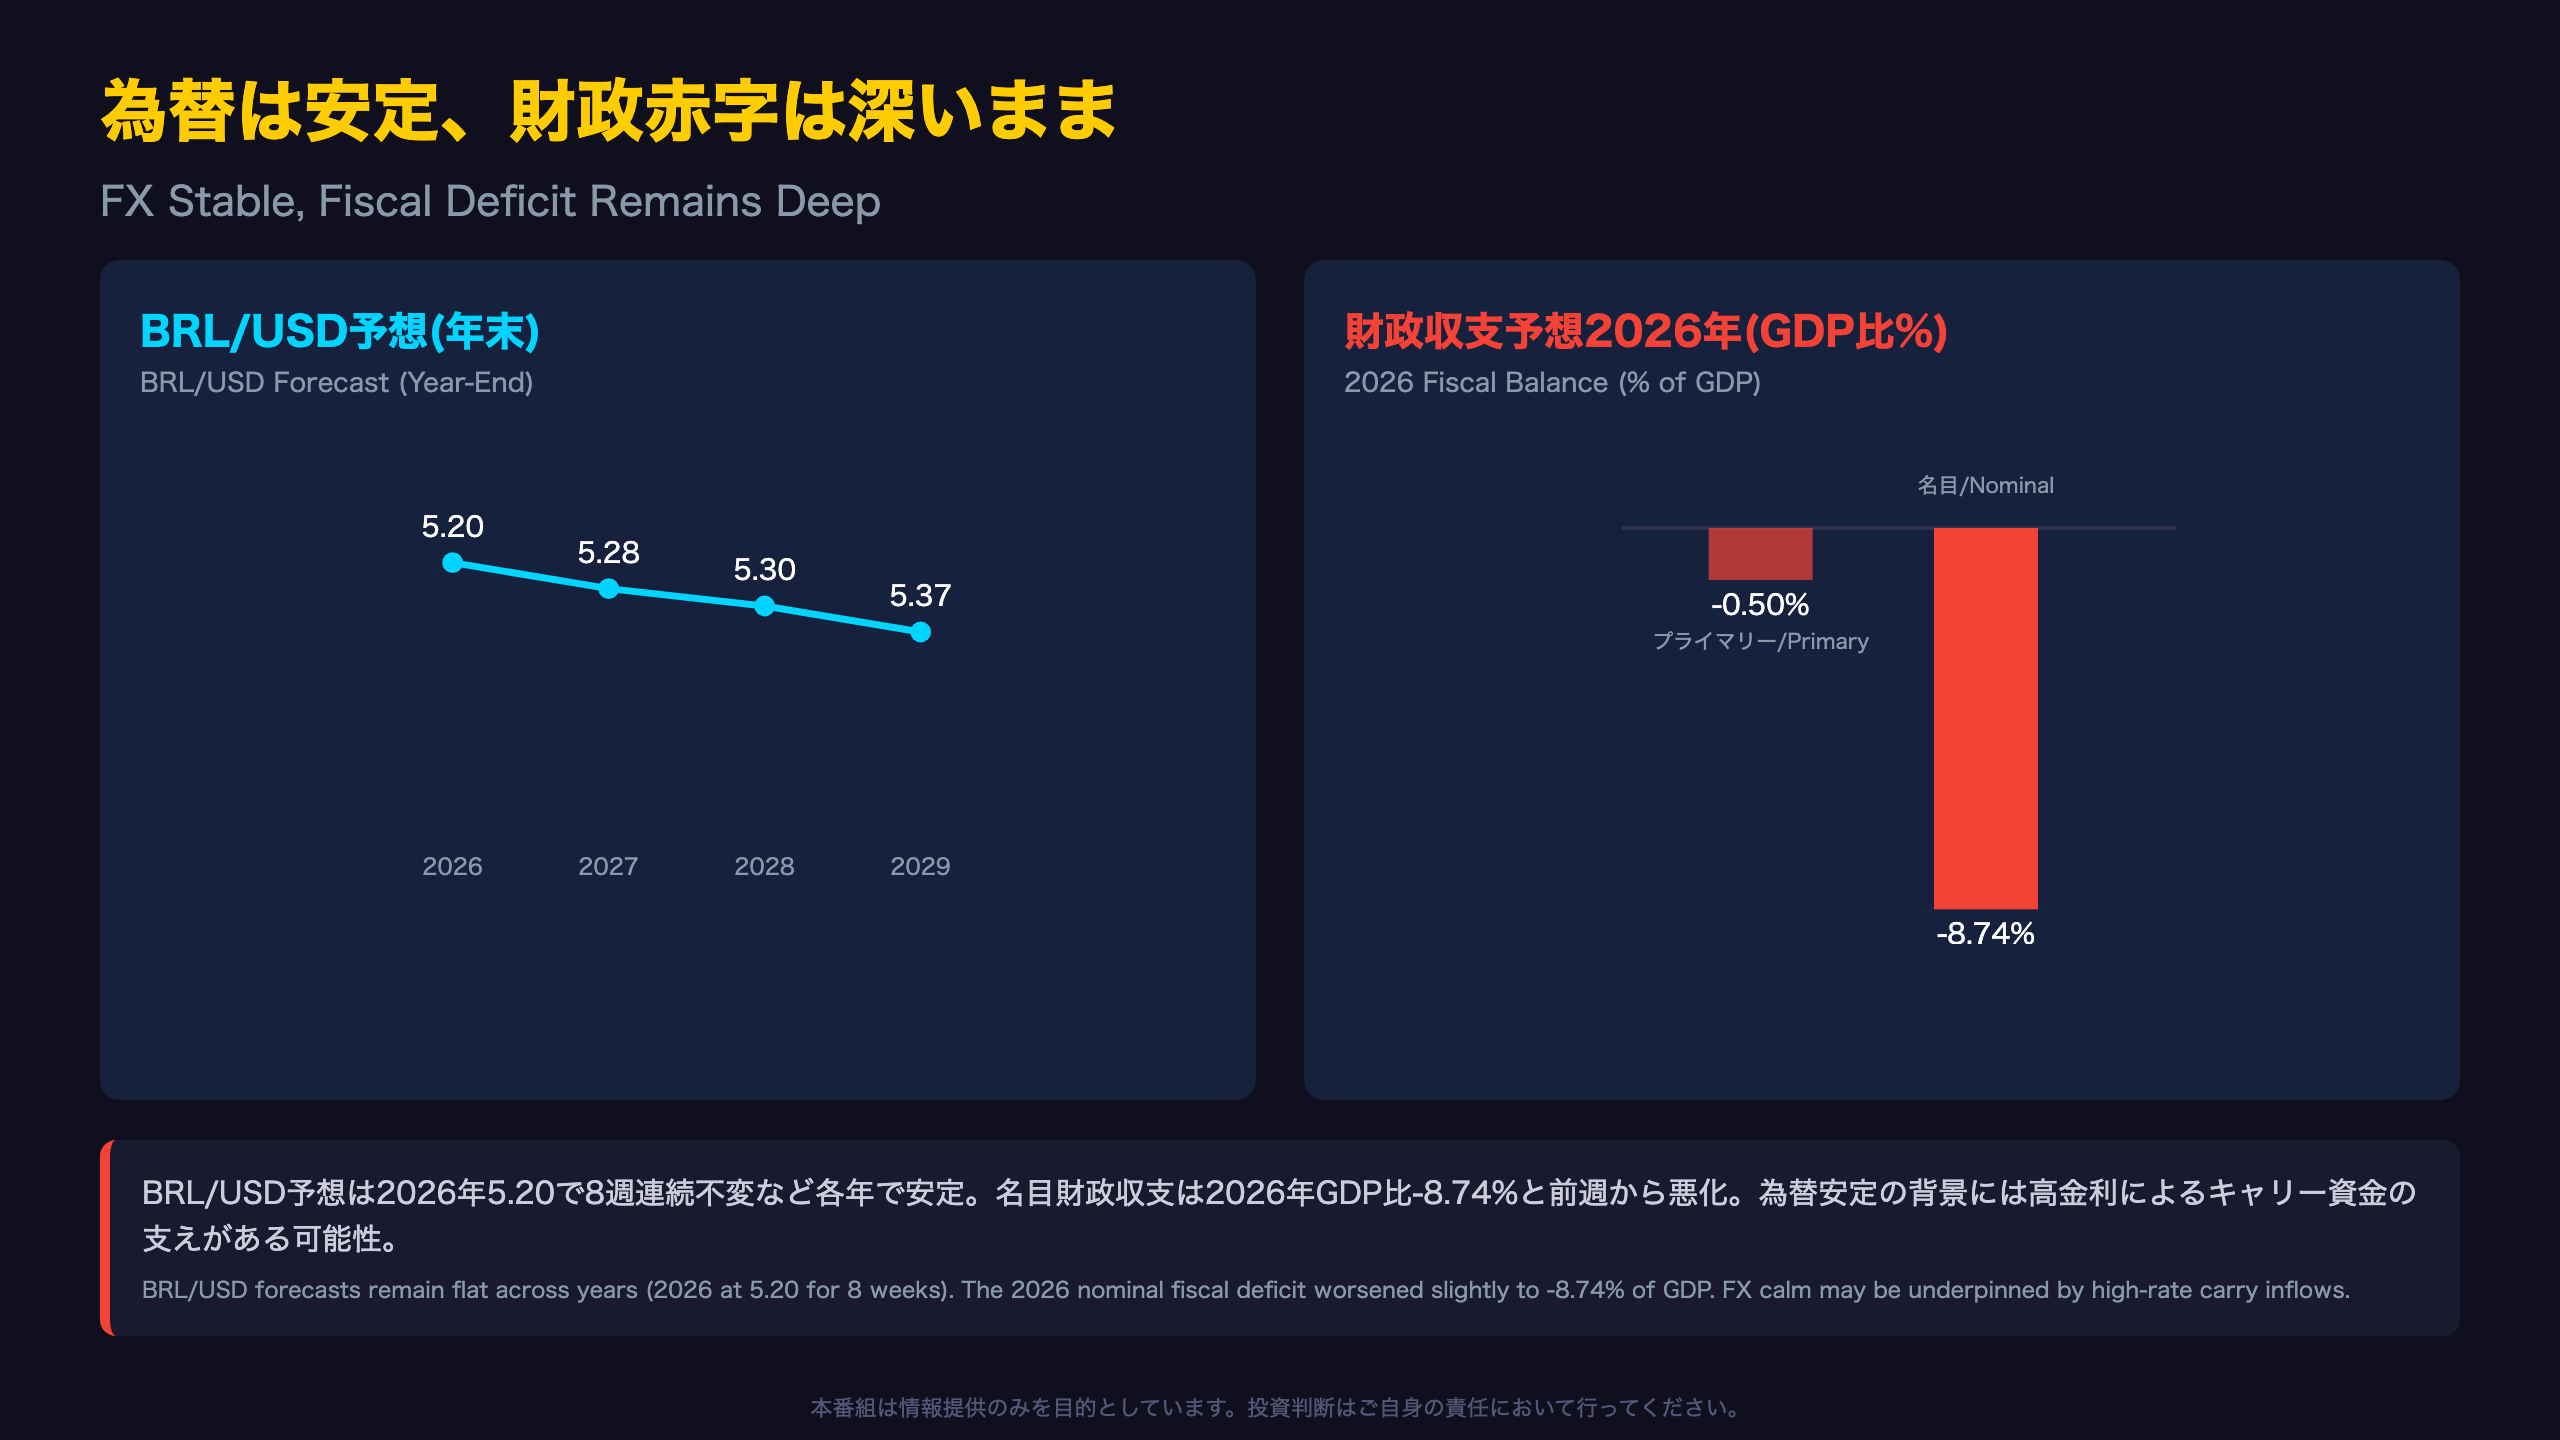
What FX Stability Actually Tells Us
A currency forecast that doesn’t move for eight straight weeks isn’t necessarily good news or bad news, it simply means no new information has changed the consensus view.
| Year-end | BRL/USD forecast | Weeks unchanged / change |
|---|---|---|
| 2026 | 5.20 | 8 weeks |
| 2027 | 5.28 | 1 week |
| 2028 | 5.30 | 3 weeks |
| 2029 | 5.37 | Down from 5.39 |
The Weight of Fiscal Deficits
The 2026 nominal fiscal result (equivalent to the \”headline\” budget balance including interest payments) stands at -8.74% of GDP, a slight deterioration from -8.70% the prior week. The primary balance (excluding interest payments) held steady at -0.50%. Net public debt is stable at 69.90% of GDP, a level that, for comparison, is roughly double the emerging-market median.
One plausible reading is that Brazil’s persistently large fiscal deficit is a factor keeping the long-run neutral Selic estimate elevated at 10.00% even as far out as 2029, investors may be demanding a structurally higher real rate to compensate for fiscal risk.
The apparent calm in the BRL forecast likely reflects the fact that Brazil’s still-high Selic rate continues to attract carry-trade capital inflows, supporting the currency. Should this equilibrium break, either through a faster-than-expected fiscal deterioration or an unexpectedly rapid pace of rate cuts, currency stability could prove more fragile than the past eight weeks of flat forecasts suggest.
BRL/JPYキャリートレードへの含意
Breaking Down the Carry Trade Math
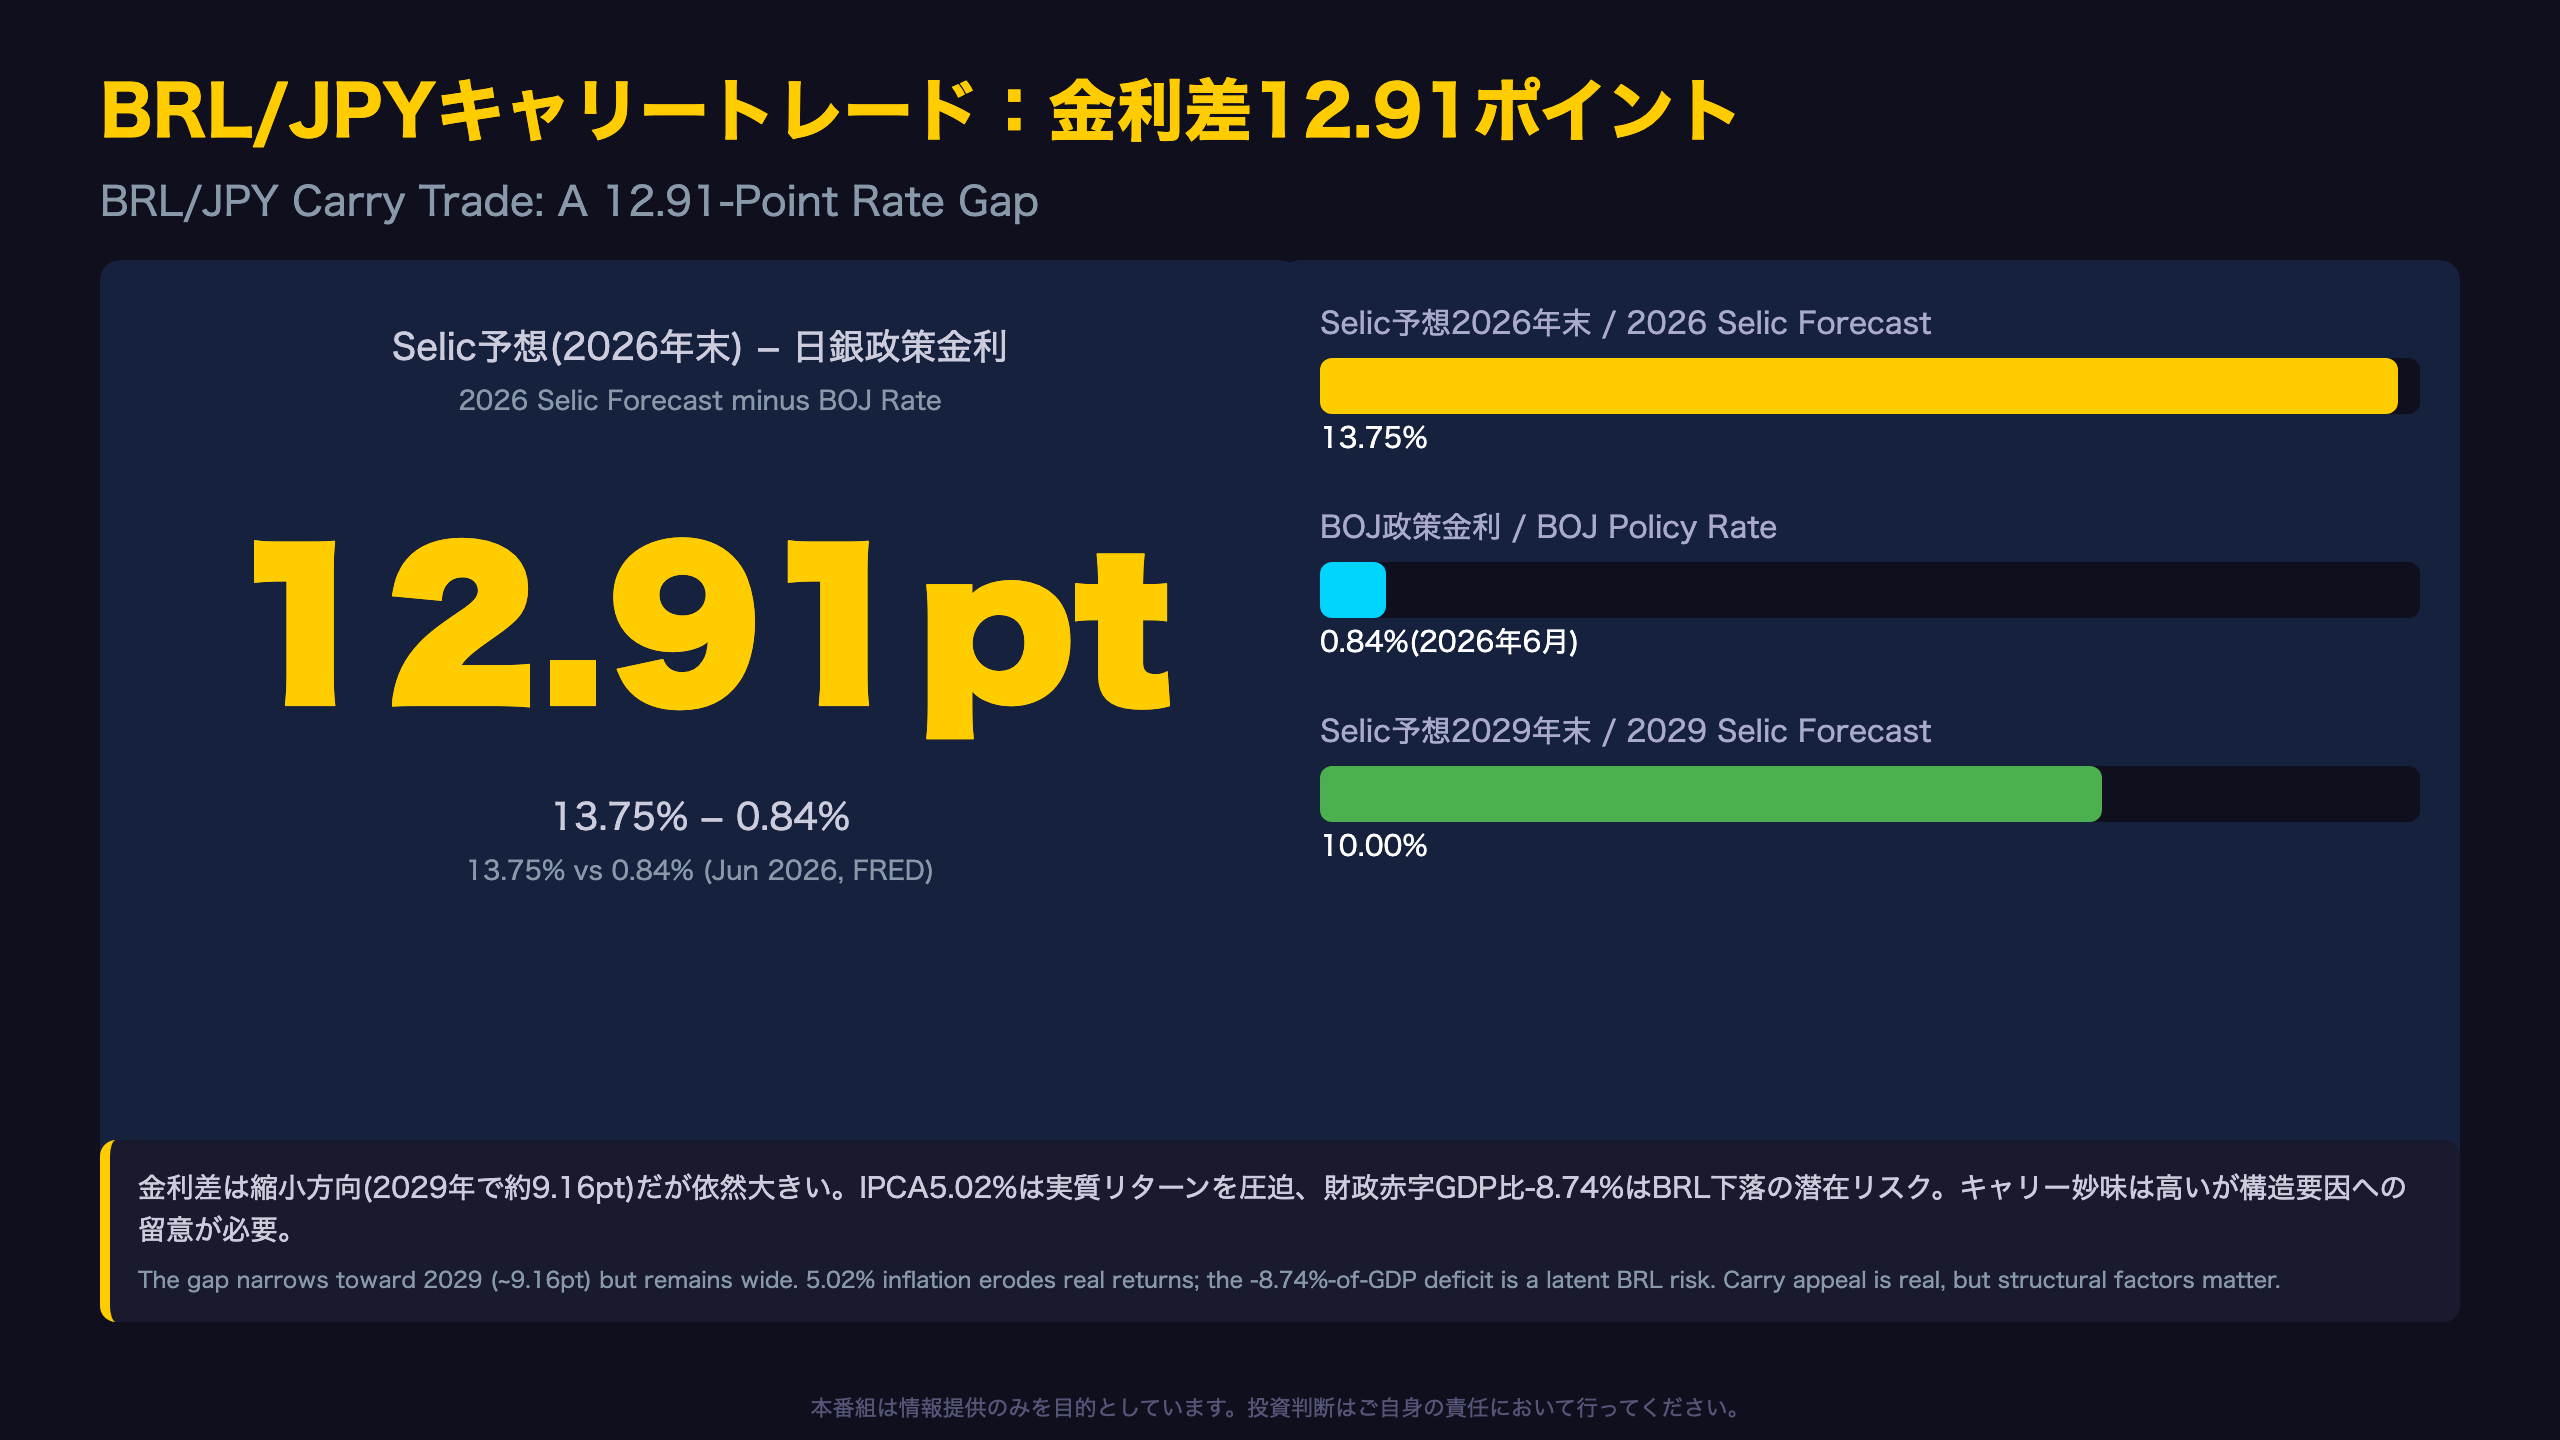
As of June 2026, the Bank of Japan’s policy rate stood at just 0.84% (FRED series IRSTCI01JPM156N). Against that, the BCB Focus survey’s 2026 year-end Selic forecast is 13.75%, a nominal rate differential of approximately 12.91 percentage points.
| Year | Selic forecast | Approx. gap vs. BOJ rate |
|---|---|---|
| 2026 year-end | 13.75% | ~12.91 pts |
| 2027 year-end | 12.00% | ~11.16 pts |
| 2028 year-end | 10.50% | ~9.66 pts |
| 2029 year-end | 10.00% | ~9.16 pts |
(These differentials hold the BOJ rate fixed at 0.84% for reference only; the BOJ’s own future rate path is outside the scope of this report.)
Three Risk Factors for Japanese Investors
For Japanese retail investors accustomed to near-zero domestic yields, a double-digit rate differential is extraordinarily attractive on paper, this is precisely why Brazilian government bonds and BRL-denominated funds (\”Uridashi bonds\” in Japan) have long been popular carry-trade vehicles among Japanese households.
- Narrowing differential risk: If Selic falls to 10.00% by 2029 as forecast, carry returns will shrink versus current levels, a purely mechanical effect of the projected easing path.
- Inflation erosion of real returns: With 2026 IPCA forecast at 5.02%, the real (inflation-adjusted) return on a 13.75% nominal Selic yield is meaningfully lower than the headline rate suggests.
- Fiscal/currency tail risk: Brazil’s -8.74%-of-GDP nominal fiscal deficit is a structural factor that could, over a longer horizon, pressure BRL weaker, though this week’s data alone does not show any acute stress signal.
Notably, the BRL/USD forecast itself has been flat at 5.20 for eight consecutive weeks, this specific report provides no evidence of an imminent, sharp BRL depreciation.
The carry trade’s nominal appeal remains real, but treating that appeal in isolation, without weighing the underlying inflation and fiscal structure driving Brazil’s high rates, would be an oversimplification that ignores the very reasons the rate differential exists in the first place.
市場インプリケーション:根拠の鎖
Tracing the Chain of Market Implications
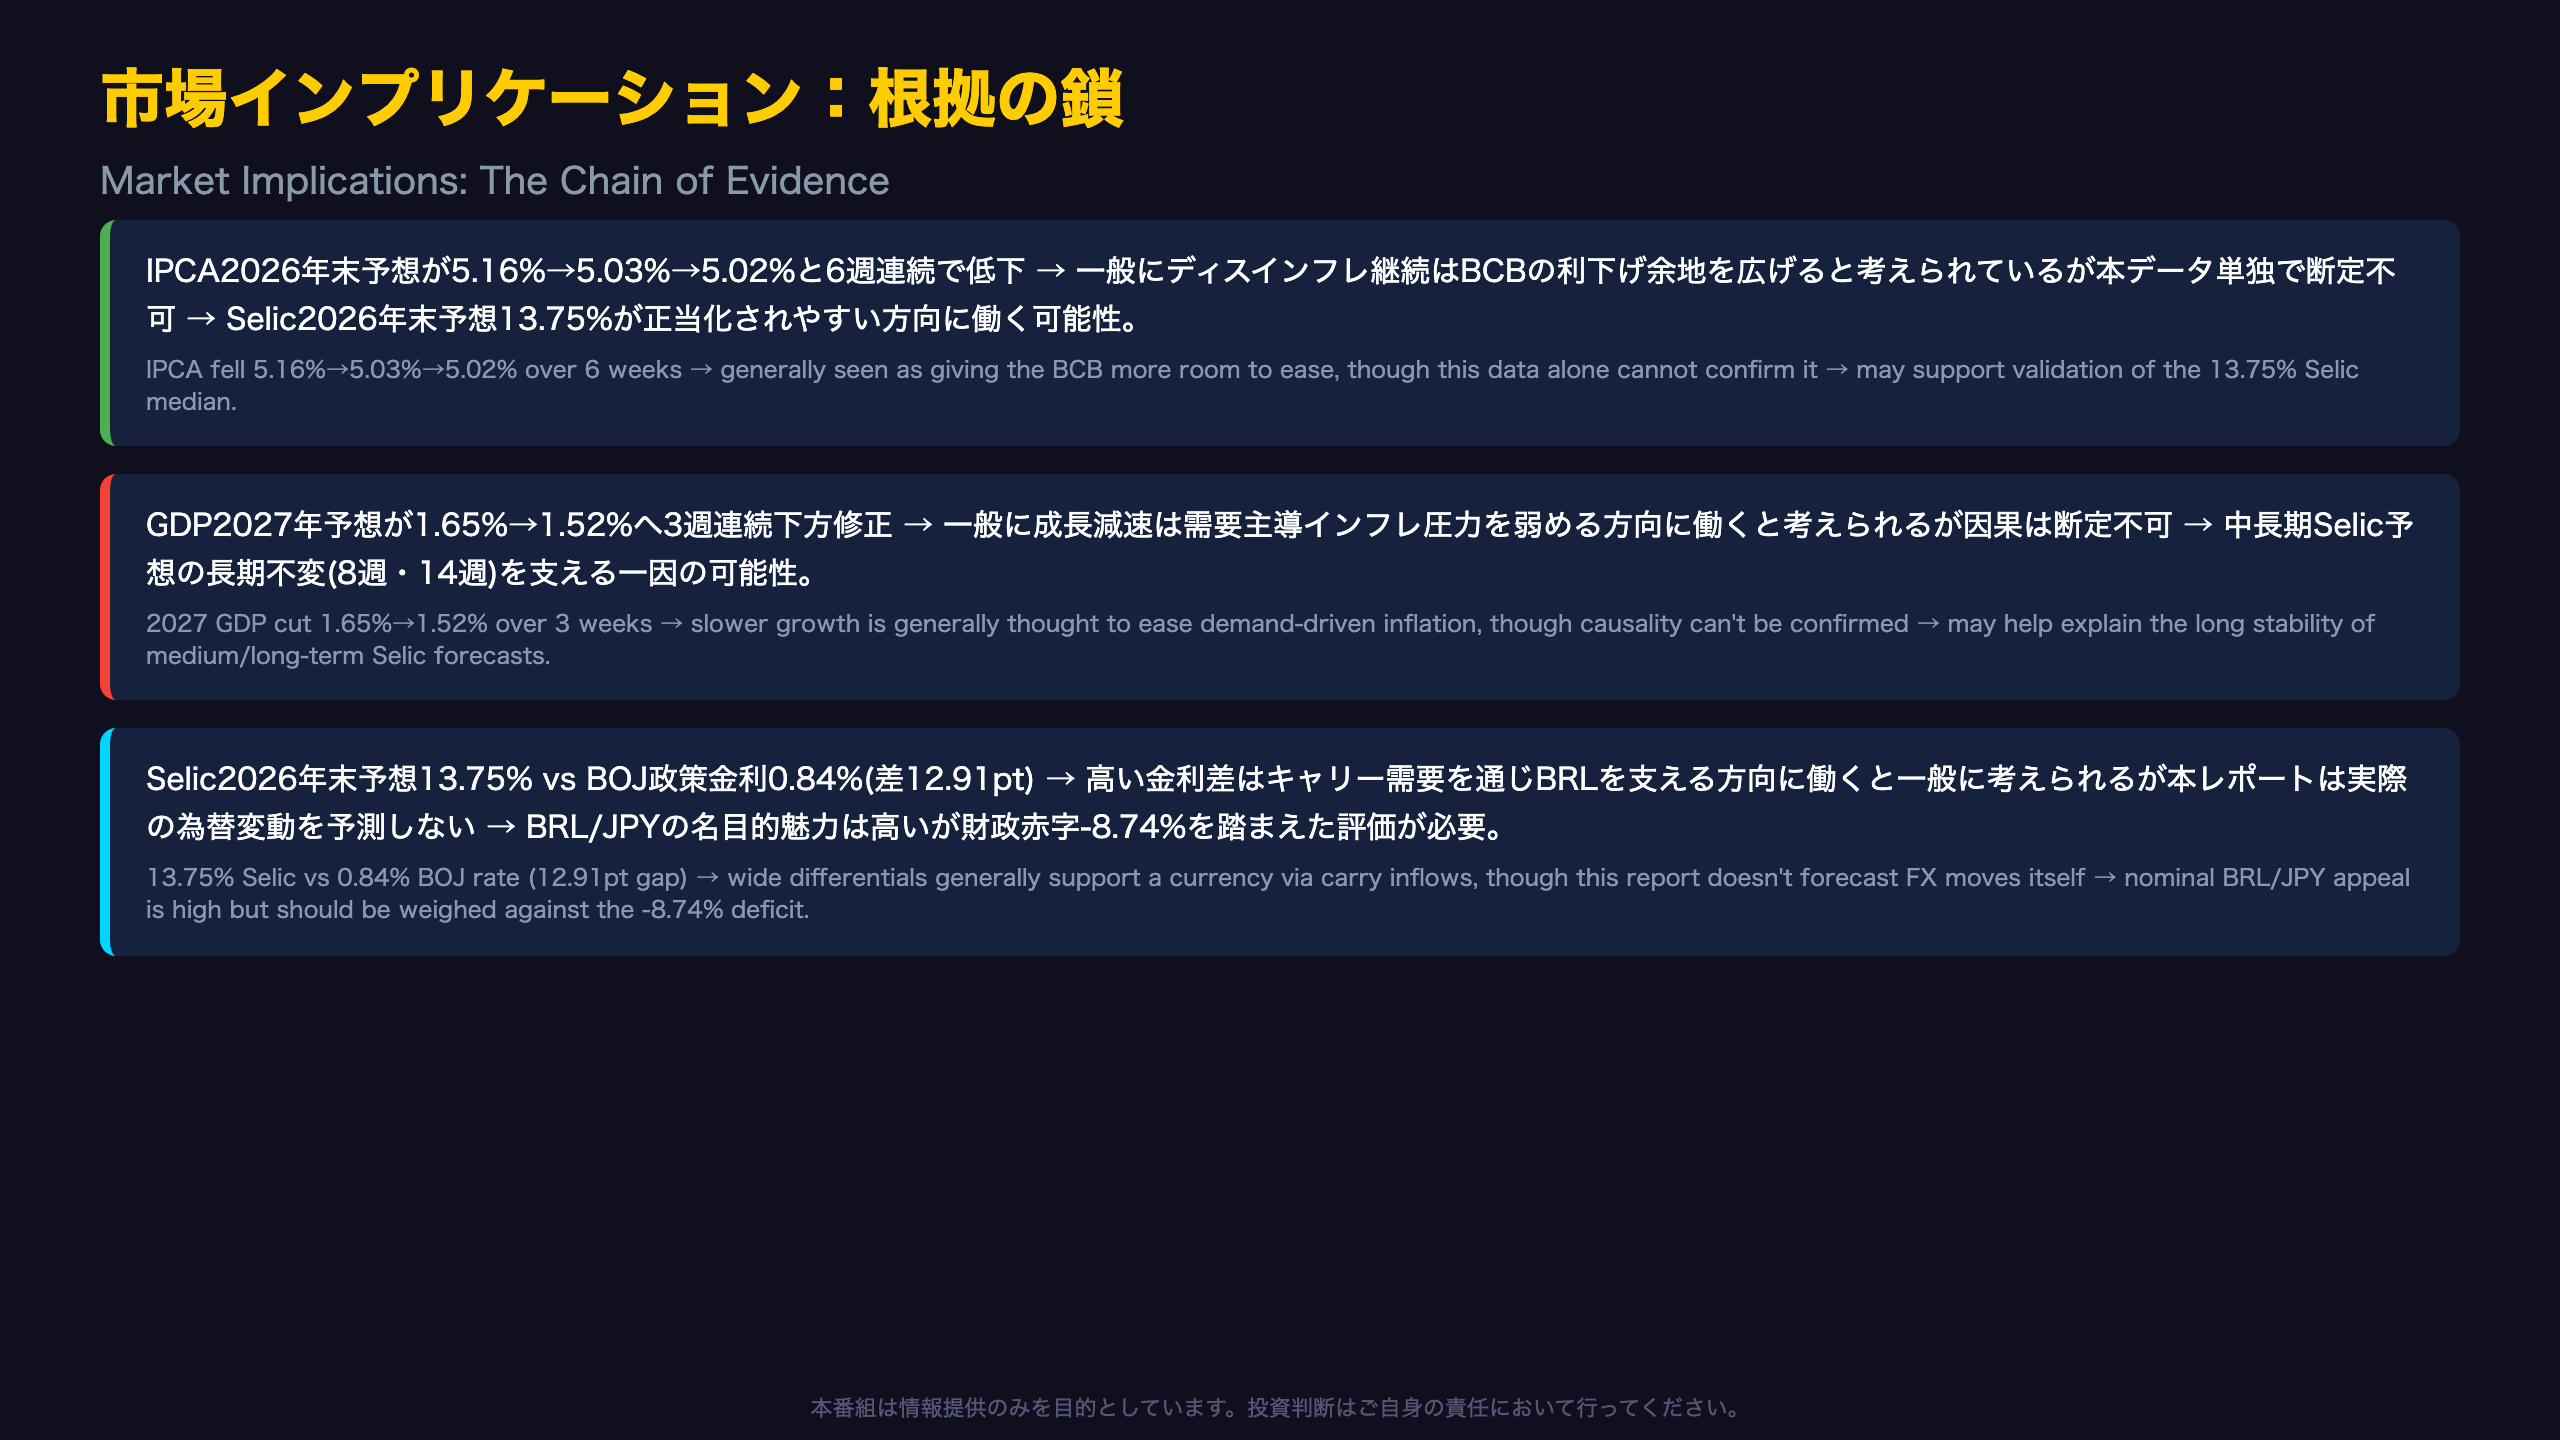
The 2026 IPCA forecast fell from 5.16% to 5.03% to 5.02% over six consecutive weeks → Disinflation trends are generally thought to give central banks more room to continue easing, though this single dataset cannot confirm the BCB’s actual internal reasoning → this may work in favor of the market’s current 13.75% year-end Selic median being validated rather than revised higher.
The 2027 GDP forecast was cut from 1.65% to 1.52% over three straight weeks → Slower growth is generally understood to reduce demand-driven inflation pressure, though causality cannot be confirmed from this data alone → this may be one contributing factor behind the extraordinary stability of the medium-to-long-term Selic forecasts (12.00% for 8 weeks, 10.00% for 14 weeks).
The 13.75% 2026 Selic forecast versus the BOJ’s 0.84% policy rate (a ~12.91-point gap) → Wide rate differentials are generally thought to support a currency via carry-trade capital inflows, though this report does not itself forecast actual currency movements → the nominal appeal of BRL/JPY carry positioning remains elevated, but should be weighed against Brazil’s -8.74%-of-GDP fiscal deficit as a structural counterweight.
What to Watch Next
The next Focus report is due August 14, 2026. Two thresholds matter most: whether the 2026 year-end Selic median moves away from 13.75%, and whether the GDP 2027 forecast is cut for a fourth consecutive week, either would meaningfully clarify whether this week’s mixed signals are strengthening into a clearer trend or beginning to reverse.
Disclaimer: This article is for informational purposes only. All investment decisions are made solely at your own risk.