This article was automatically generated by the NFC Market Live AI analysis system. (Updated: 2026-08-06 09:04 JST)
Deep dive into Japan’s MOF weekly securities flow data (week of Jul 26-Aug 1)📊
Foreign investors sold ¥392.5bn of Japanese stocks while buying ¥558.9bn of JGBs. Japanese investors flipped too — a complete week-over-week reversal📉📈
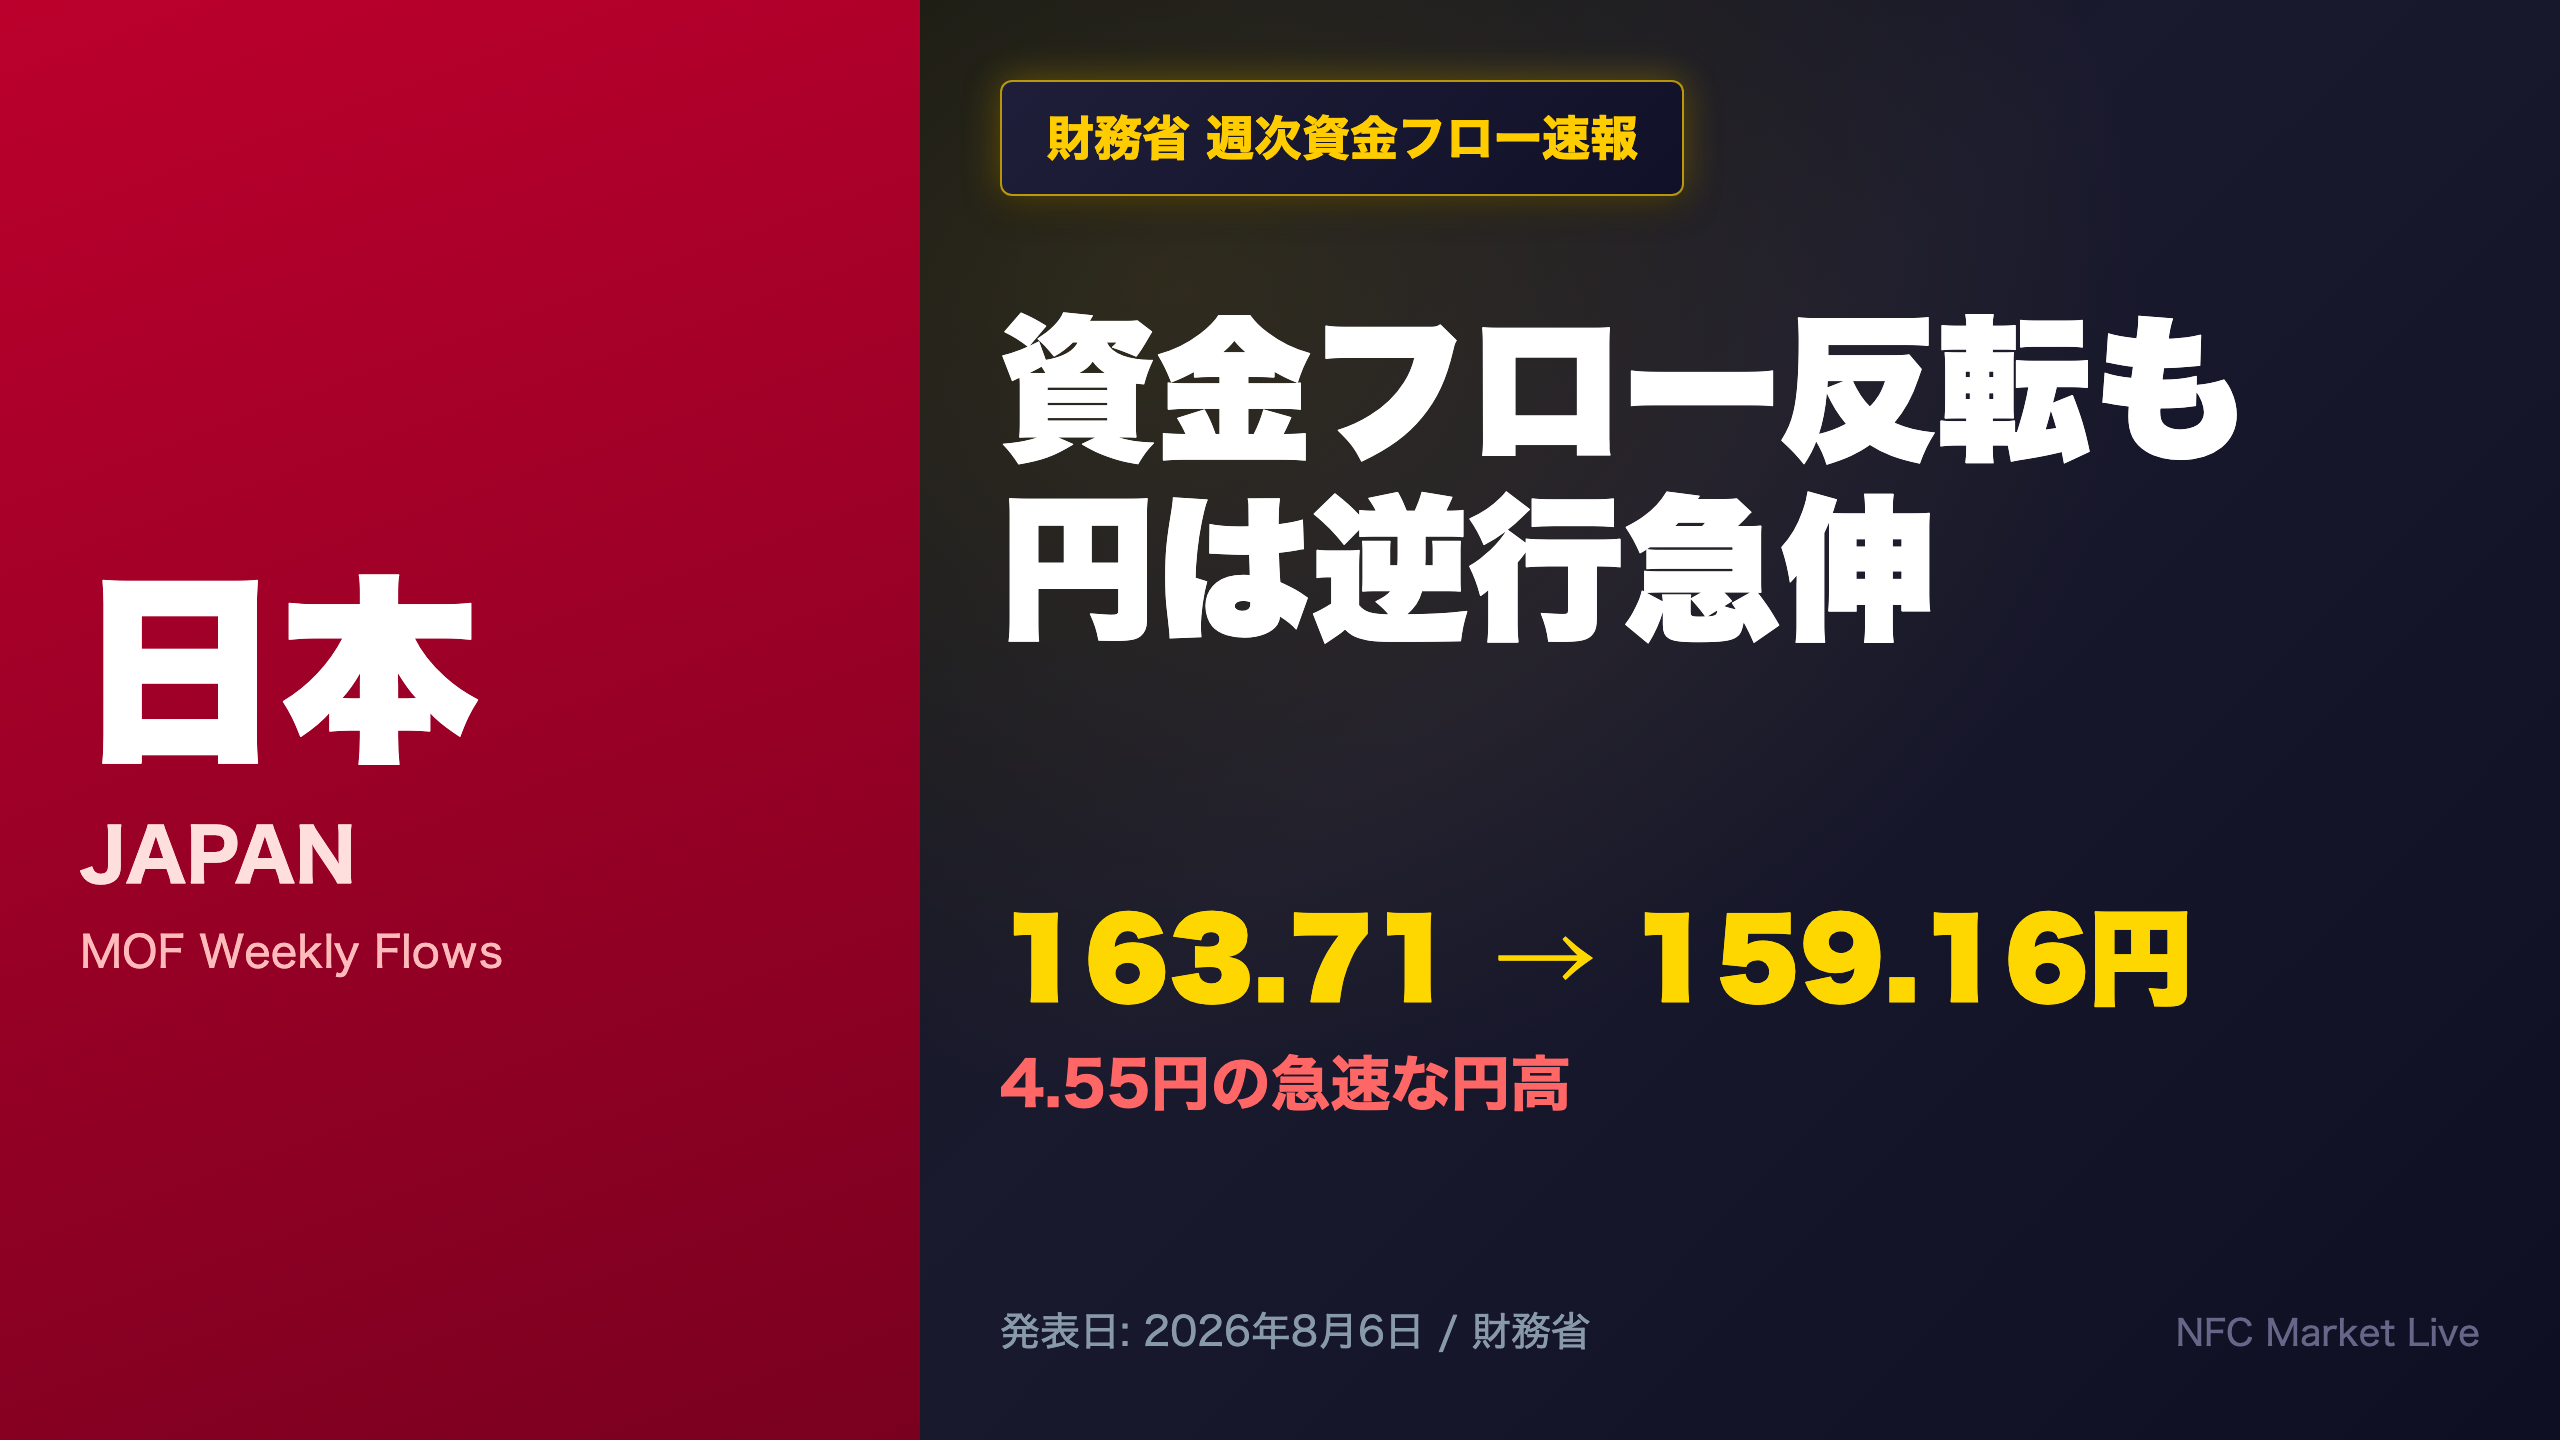
The real story is FX: net flow estimates were nearly balanced, yet USD/JPY dropped sharply from 163.71 to 159.16💹
This disconnect suggests factors beyond weekly flows — like rate expectations — were driving the move⚠️
We break down what to watch next.
週間資金フロー:完全反転のサマリー
Japan’s Weekly Capital Flows: A Complete Reversal
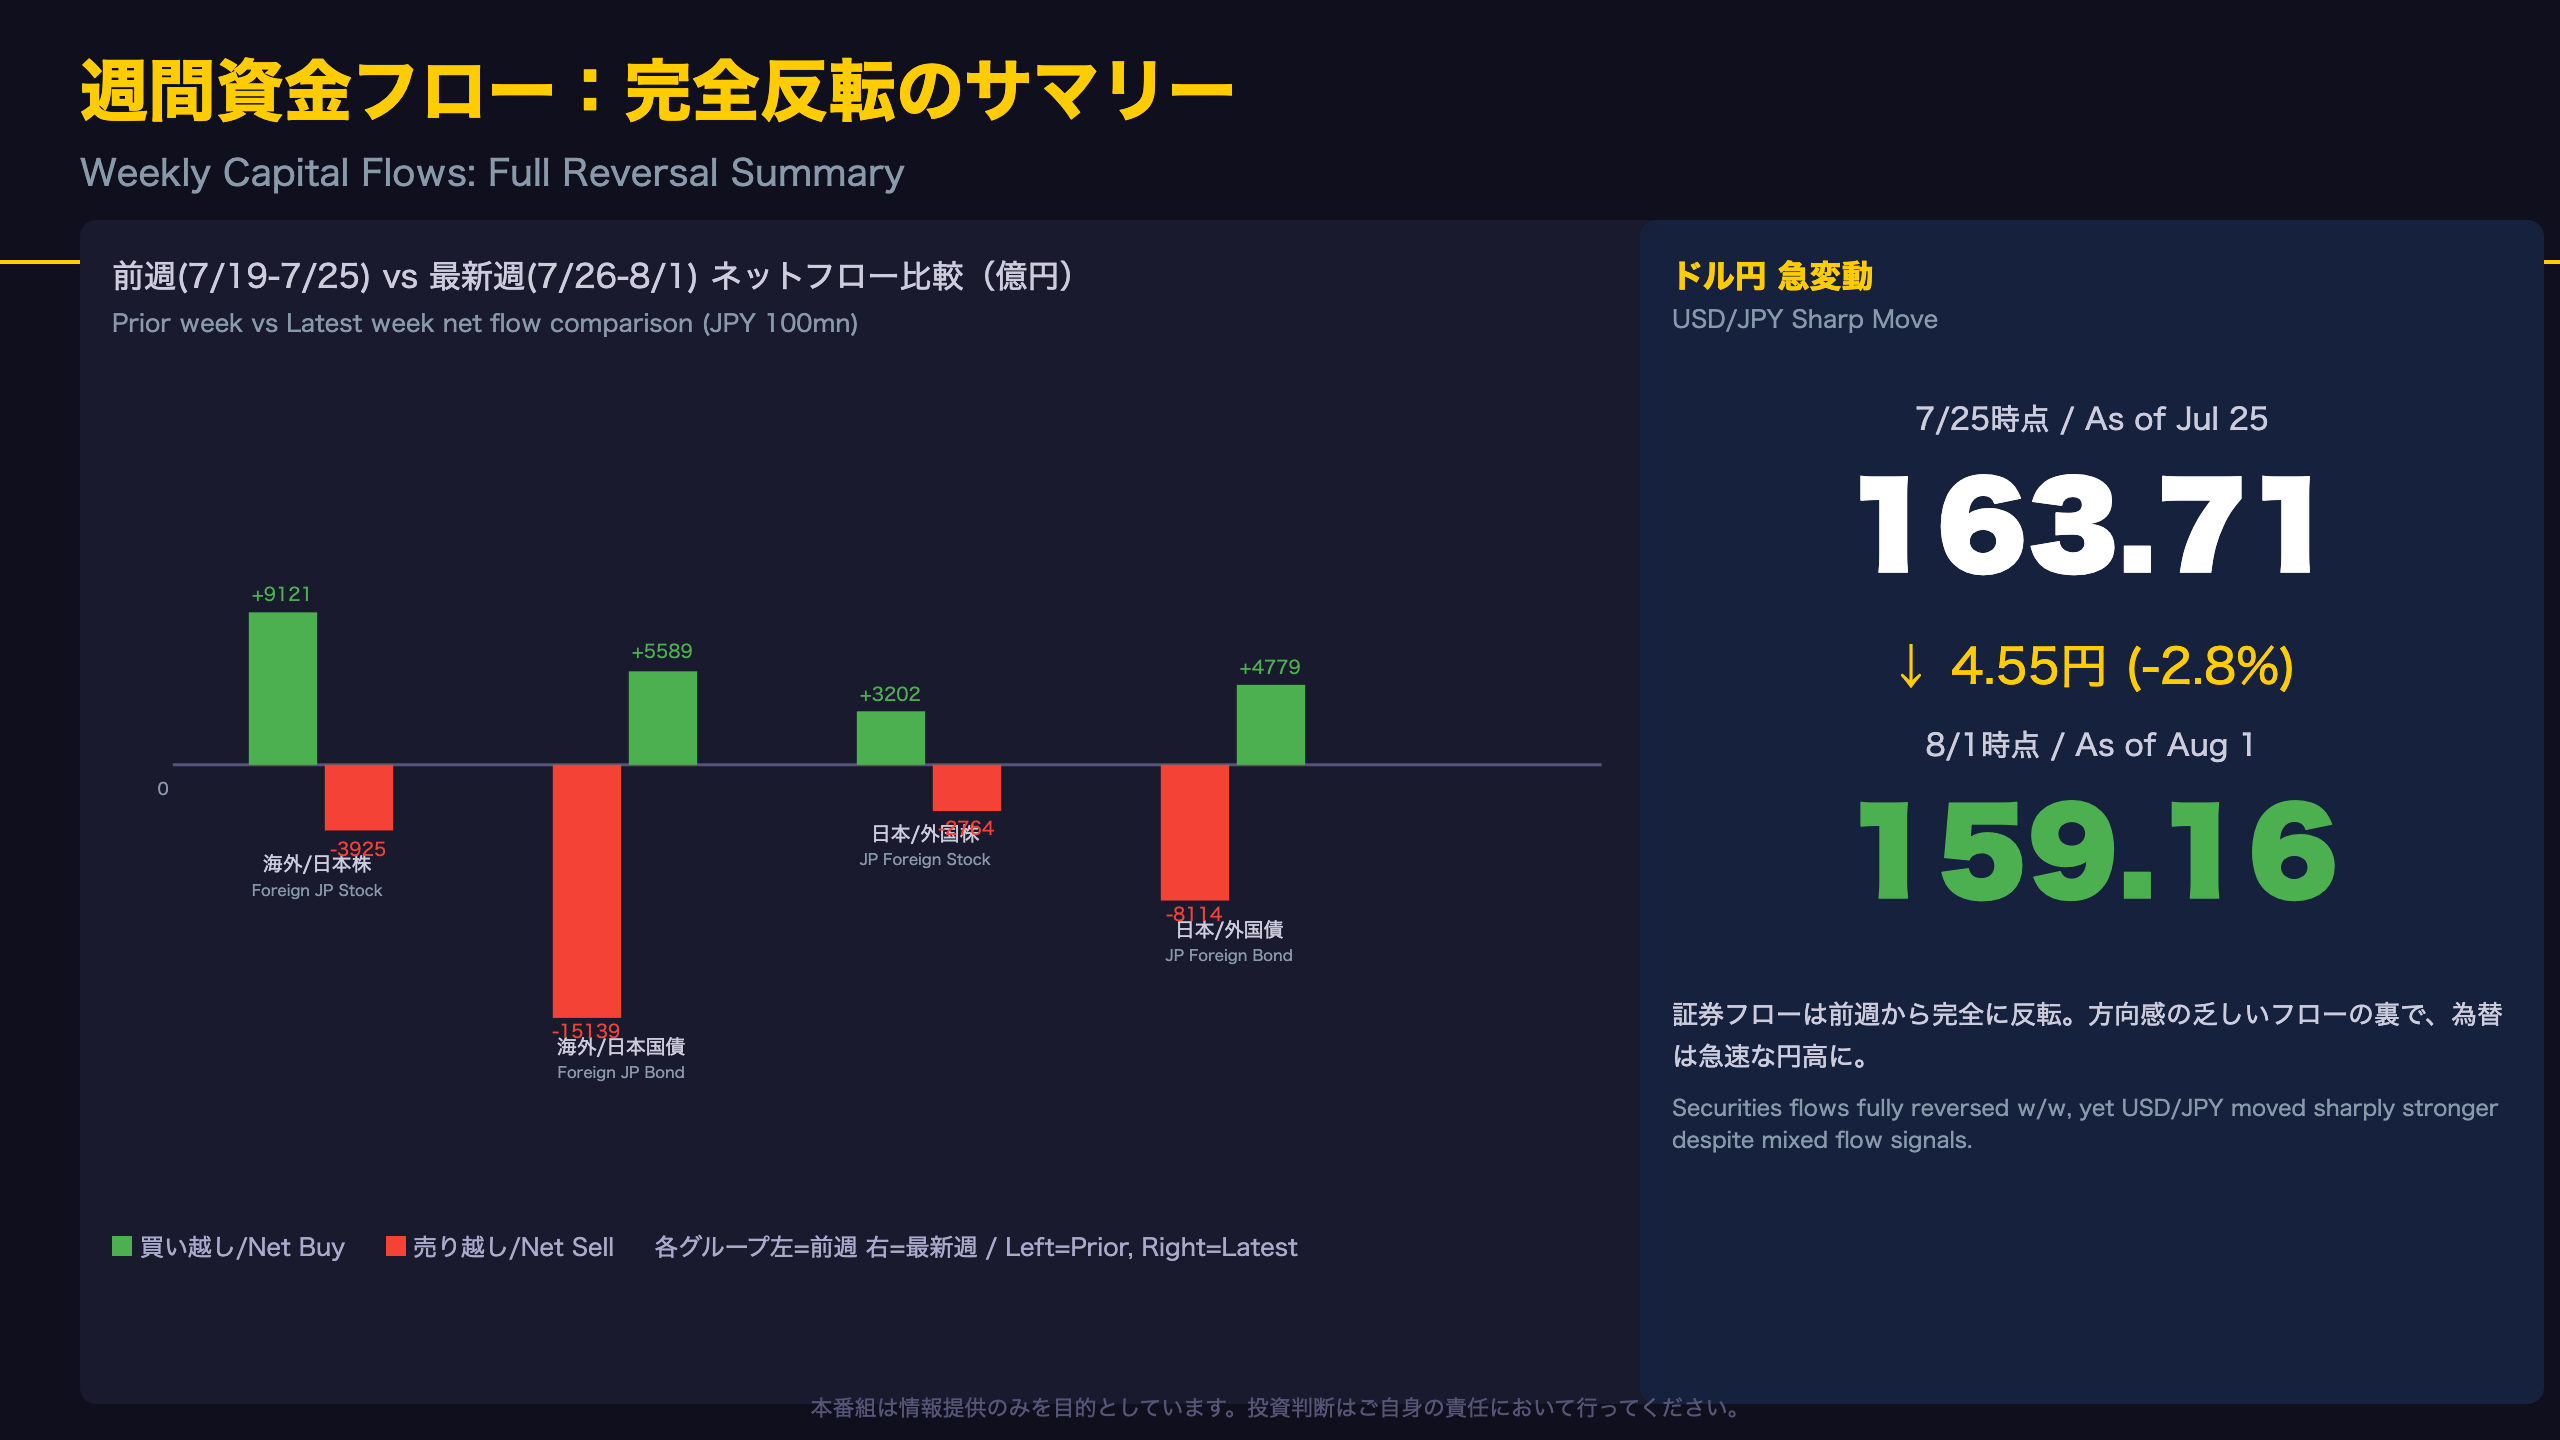
The Ministry of Finance’s (MOF) weekly “International Transactions in Securities” report, covering July 26-August 1, revealed a striking reversal from the prior week.
Key figures (JPY, approx.)
- Foreign investors, Japanese equities: +¥912.1bn (prior) to -¥392.5bn (latest)
- Foreign investors, Japanese long-term bonds: -¥1,513.9bn (prior) to +¥558.9bn (latest)
- Japanese investors, foreign equities: +¥320.2bn (prior) to -¥276.4bn (latest)
- Japanese investors, foreign long-term bonds: -¥811.4bn (prior) to +¥477.9bn (latest)
All four categories flipped sign week-over-week, an unusually symmetric reversal for a typically noisy weekly series.
For context, this MOF report (published weekly, covering Sunday-Saturday windows) is Japan’s most timely gauge of cross-border portfolio activity, though it only captures reporting institutions (banks, securities firms, trust banks) rather than the full universe of real-money flows — a narrower scope than the US Treasury’s monthly TIC data.
Over the same window, USD/JPY dropped sharply from 163.71 to 159.16, a 4.55 yen (roughly 2.8%) move toward yen strength in a single week.
The critical question, addressed in later slides, is whether this flow reversal can mechanically explain the yen’s move. A rough net calculation of yen-buying versus yen-selling flows suggests the securities data alone falls short, hinting that other drivers such as rate differential expectations or BOJ policy signals were likely also at play.
「株から債券へ」双方向シンクロ現象
A Synchronized Shift from Stocks to Bonds
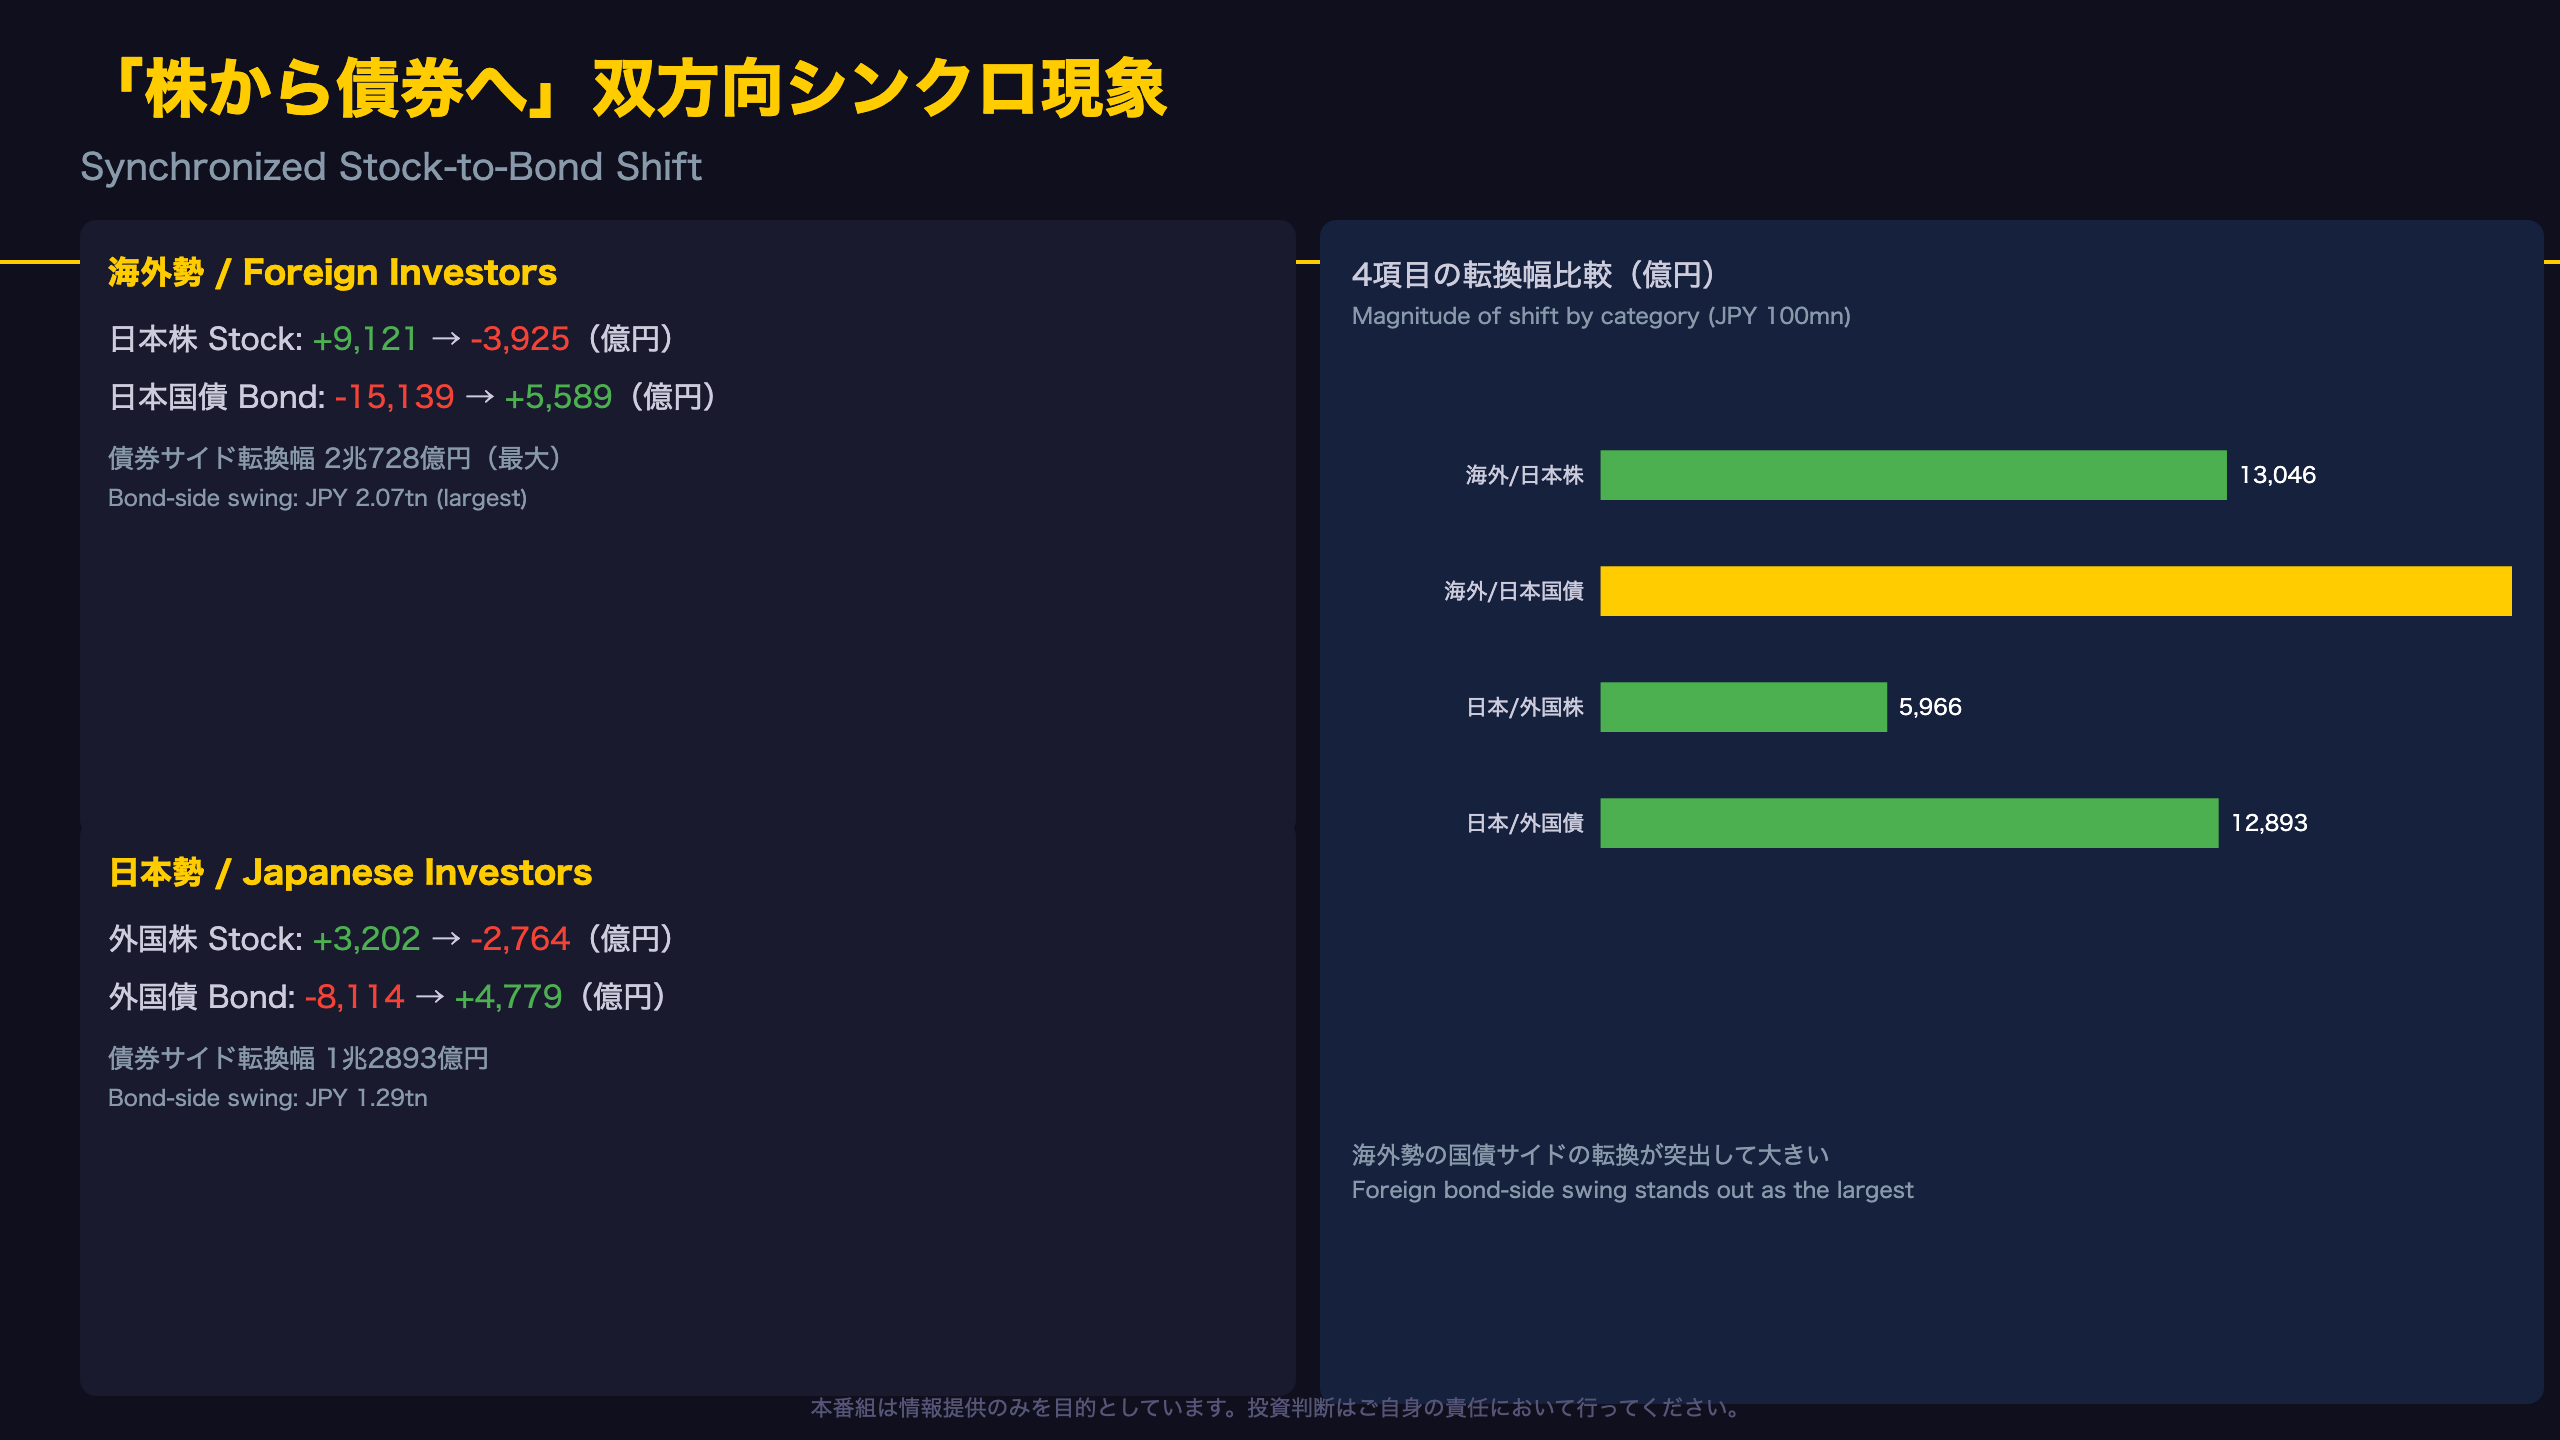
The standout feature of the latest week is that both foreign and Japanese investors executed the same directional shift: selling equities while buying bonds.
Foreign investors
- Japanese equities: +¥912.1bn to -¥392.5bn (a swing of ¥1,304.6bn)
- Japanese long-term bonds: -¥1,513.9bn to +¥558.9bn (a swing of ¥2,072.8bn)
Japanese investors
- Foreign equities: +¥320.2bn to -¥276.4bn (a swing of ¥596.6bn)
- Foreign long-term bonds: -¥811.4bn to +¥477.9bn (a swing of ¥1,289.3bn)
The foreign-bond swing (¥2.07 trillion) is the largest of the four, standing out as the dominant force behind this reallocation.
This kind of synchronized move is often associated with risk-off, “flight to quality” behavior. However, it could equally reflect simple mean-reversion or position-squaring after the prior week’s moves. Since MOF’s weekly release does not break down flows by investor type (pension funds, insurers, banks), it is not possible to confirm whether this reflects a structural shift or a short-term technical adjustment — that will depend on whether the pattern persists in subsequent weeks.
It’s worth noting that similar stock-to-bond crossovers have occurred multiple times over the past year (e.g., December 2025 and February 2026), so this is not necessarily an unprecedented event.
「3月ショック」と急速な巻き戻し
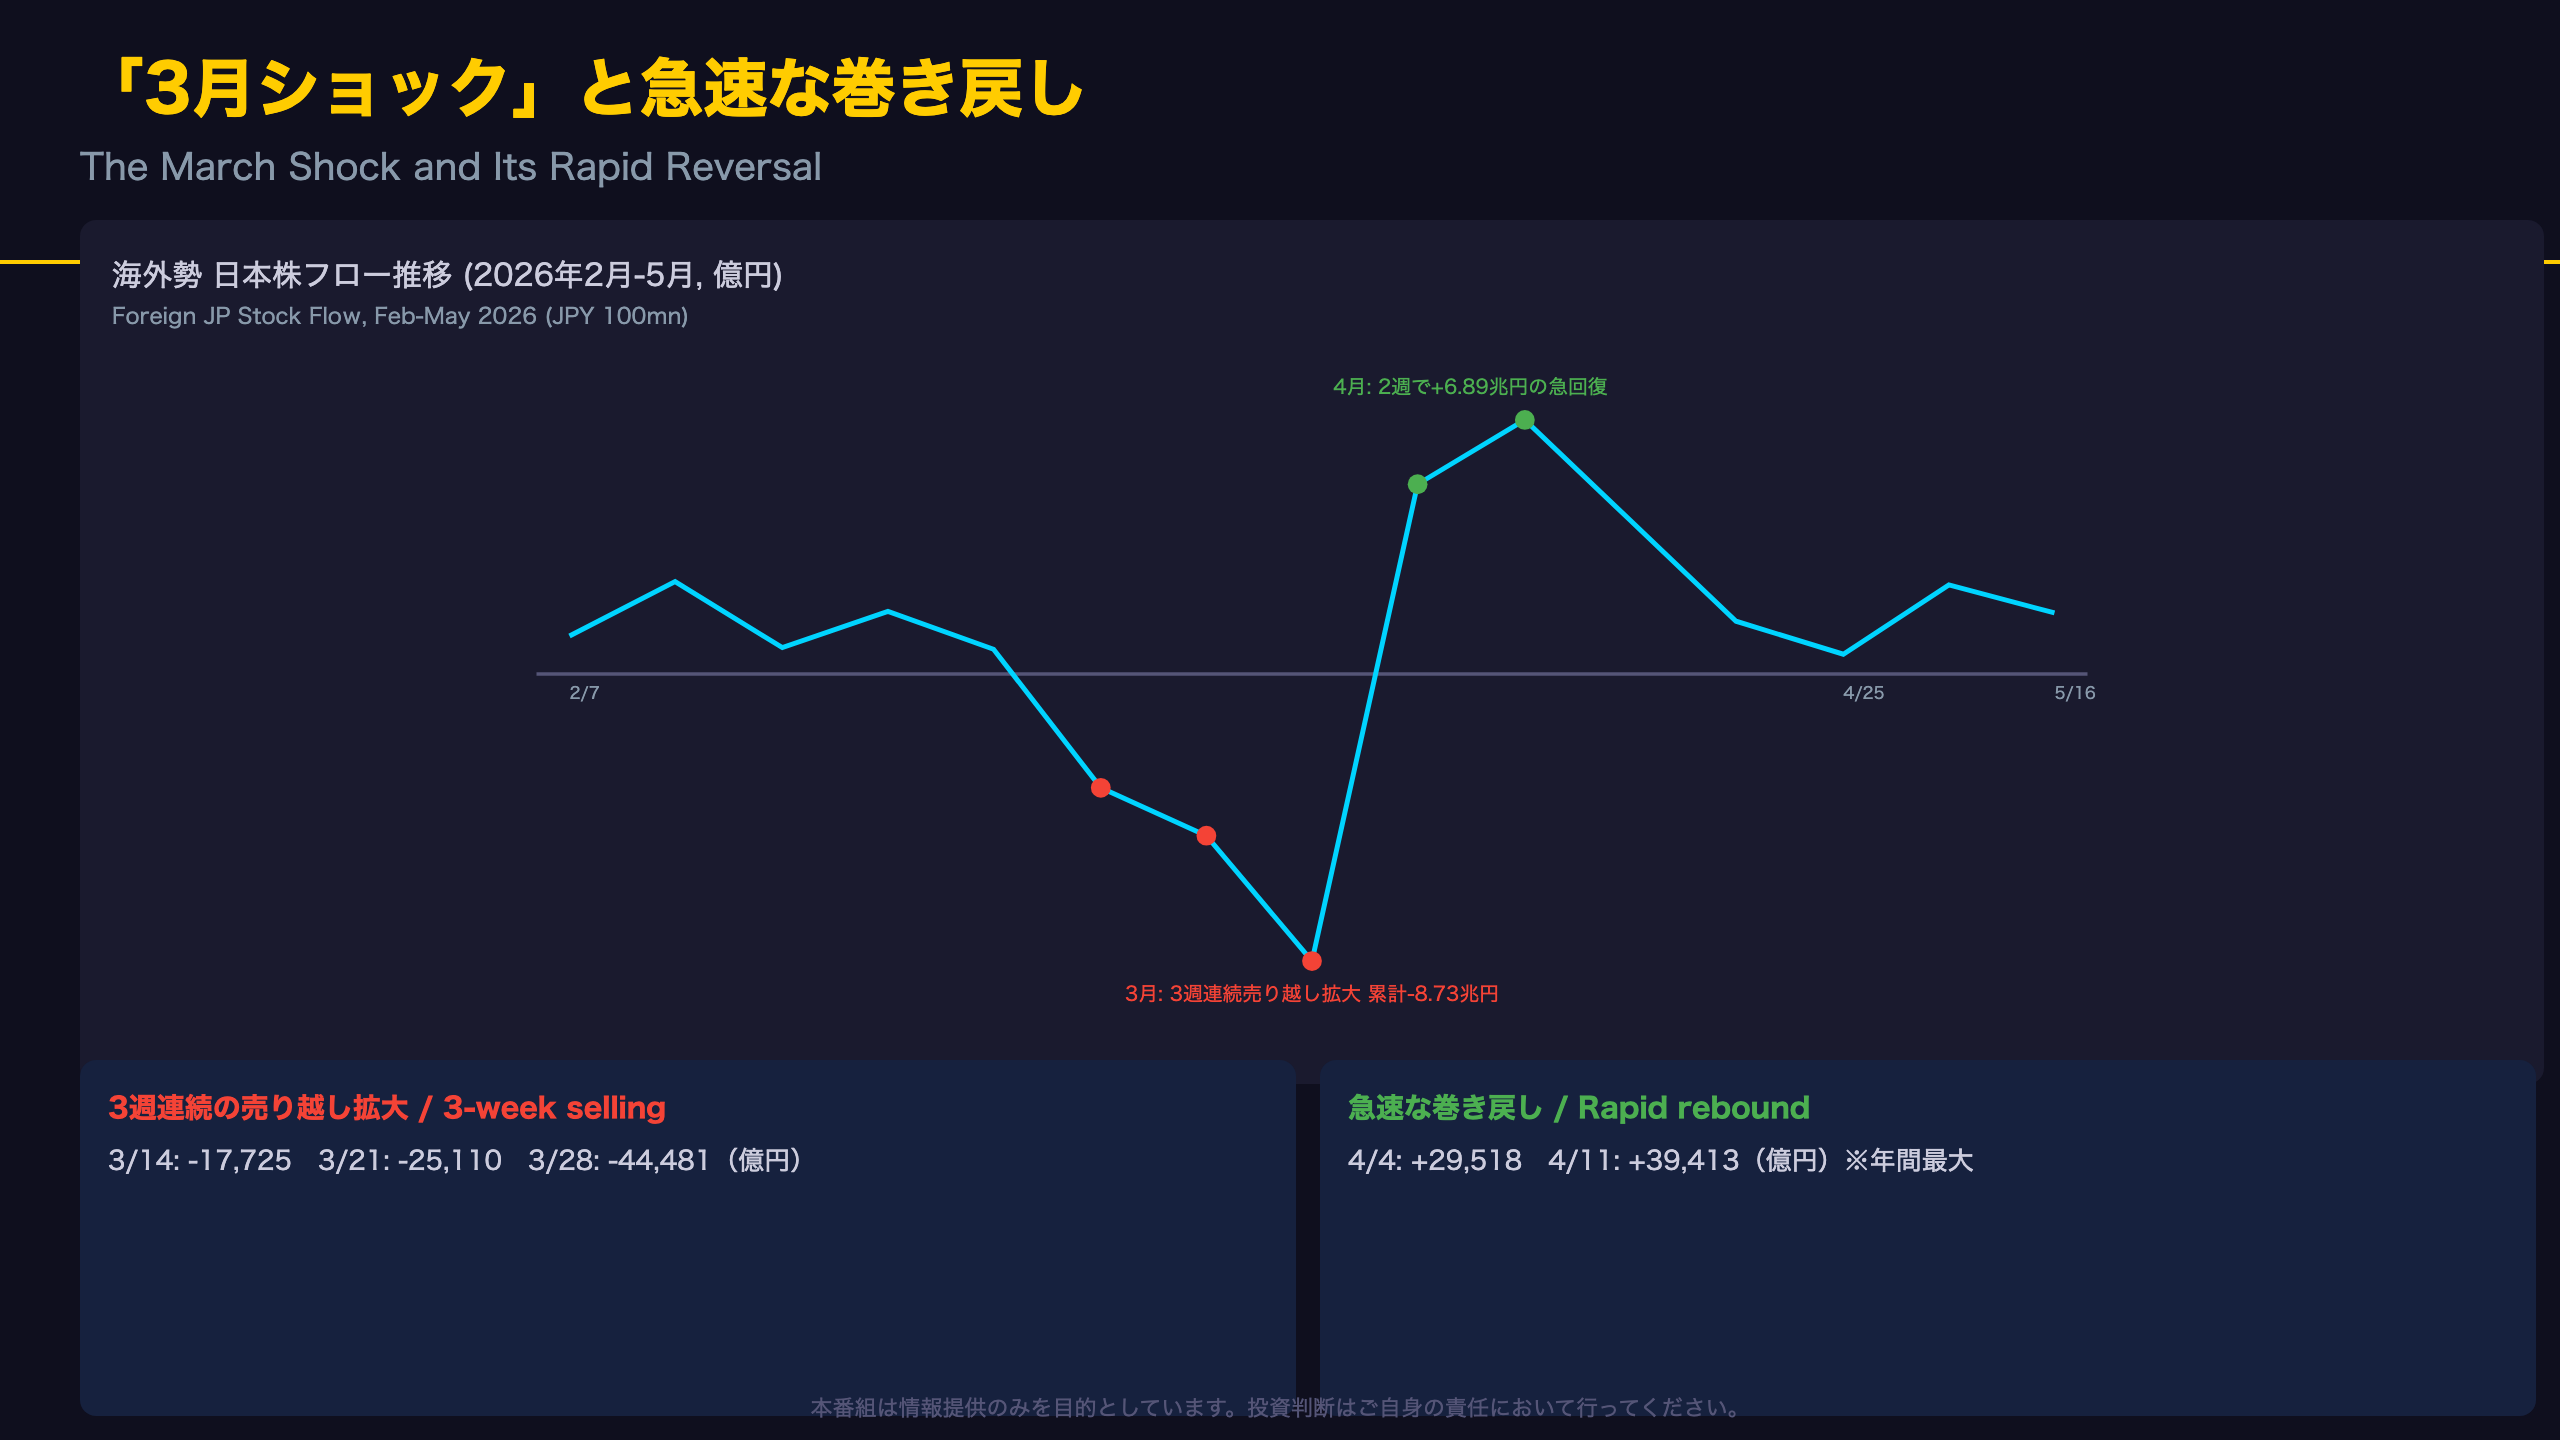
The “March Shock” and Its Rapid Reversal
The most striking episode in the past year of flow data is the sustained foreign selling of Japanese equities in March 2026.
Three weeks of escalating outflows
| Week | Foreign JP Stock Flow |
|---|---|
| Mar 8-14 | -¥1,772.5bn |
| Mar 15-21 | -¥2,511.0bn |
| Mar 22-28 | -¥4,448.1bn (largest of the year) |
Cumulative outflows over these three weeks reached ¥8,731.6bn. Notably, foreign JGB flows also turned negative (-¥2,646.1bn) in the week of March 22-28, suggesting a broader “Japan selling” episode spanning both equities and bonds.
A rapid rebound
The following month saw a dramatic reversal:
– Apr 5-11: +¥2,951.8bn
– Apr 12-18: +¥3,941.3bn (the largest weekly inflow of the year)
Over two weeks, ¥6,893.1bn flowed back in — recovering roughly 80% of March’s outflow.
Interestingly, USD/JPY held a relatively contained range of 159-160 throughout this period, showing far less volatility than the equity flows themselves. This could suggest the flows were partly hedged or involved domestic repatriation mechanics, though the source data does not allow us to confirm the specific cause.
For context, US and European investors familiar with sudden “basis point” moves in equity flows will recognize this pattern as reminiscent of episodes seen around Japan’s periodic volatility spikes — though of course, MOF’s data captures only reporting institutions, not the full market. Compared to the March-April shock, August’s weekly reversal remains modest in scale.
ドル円急落の背後にある乖離
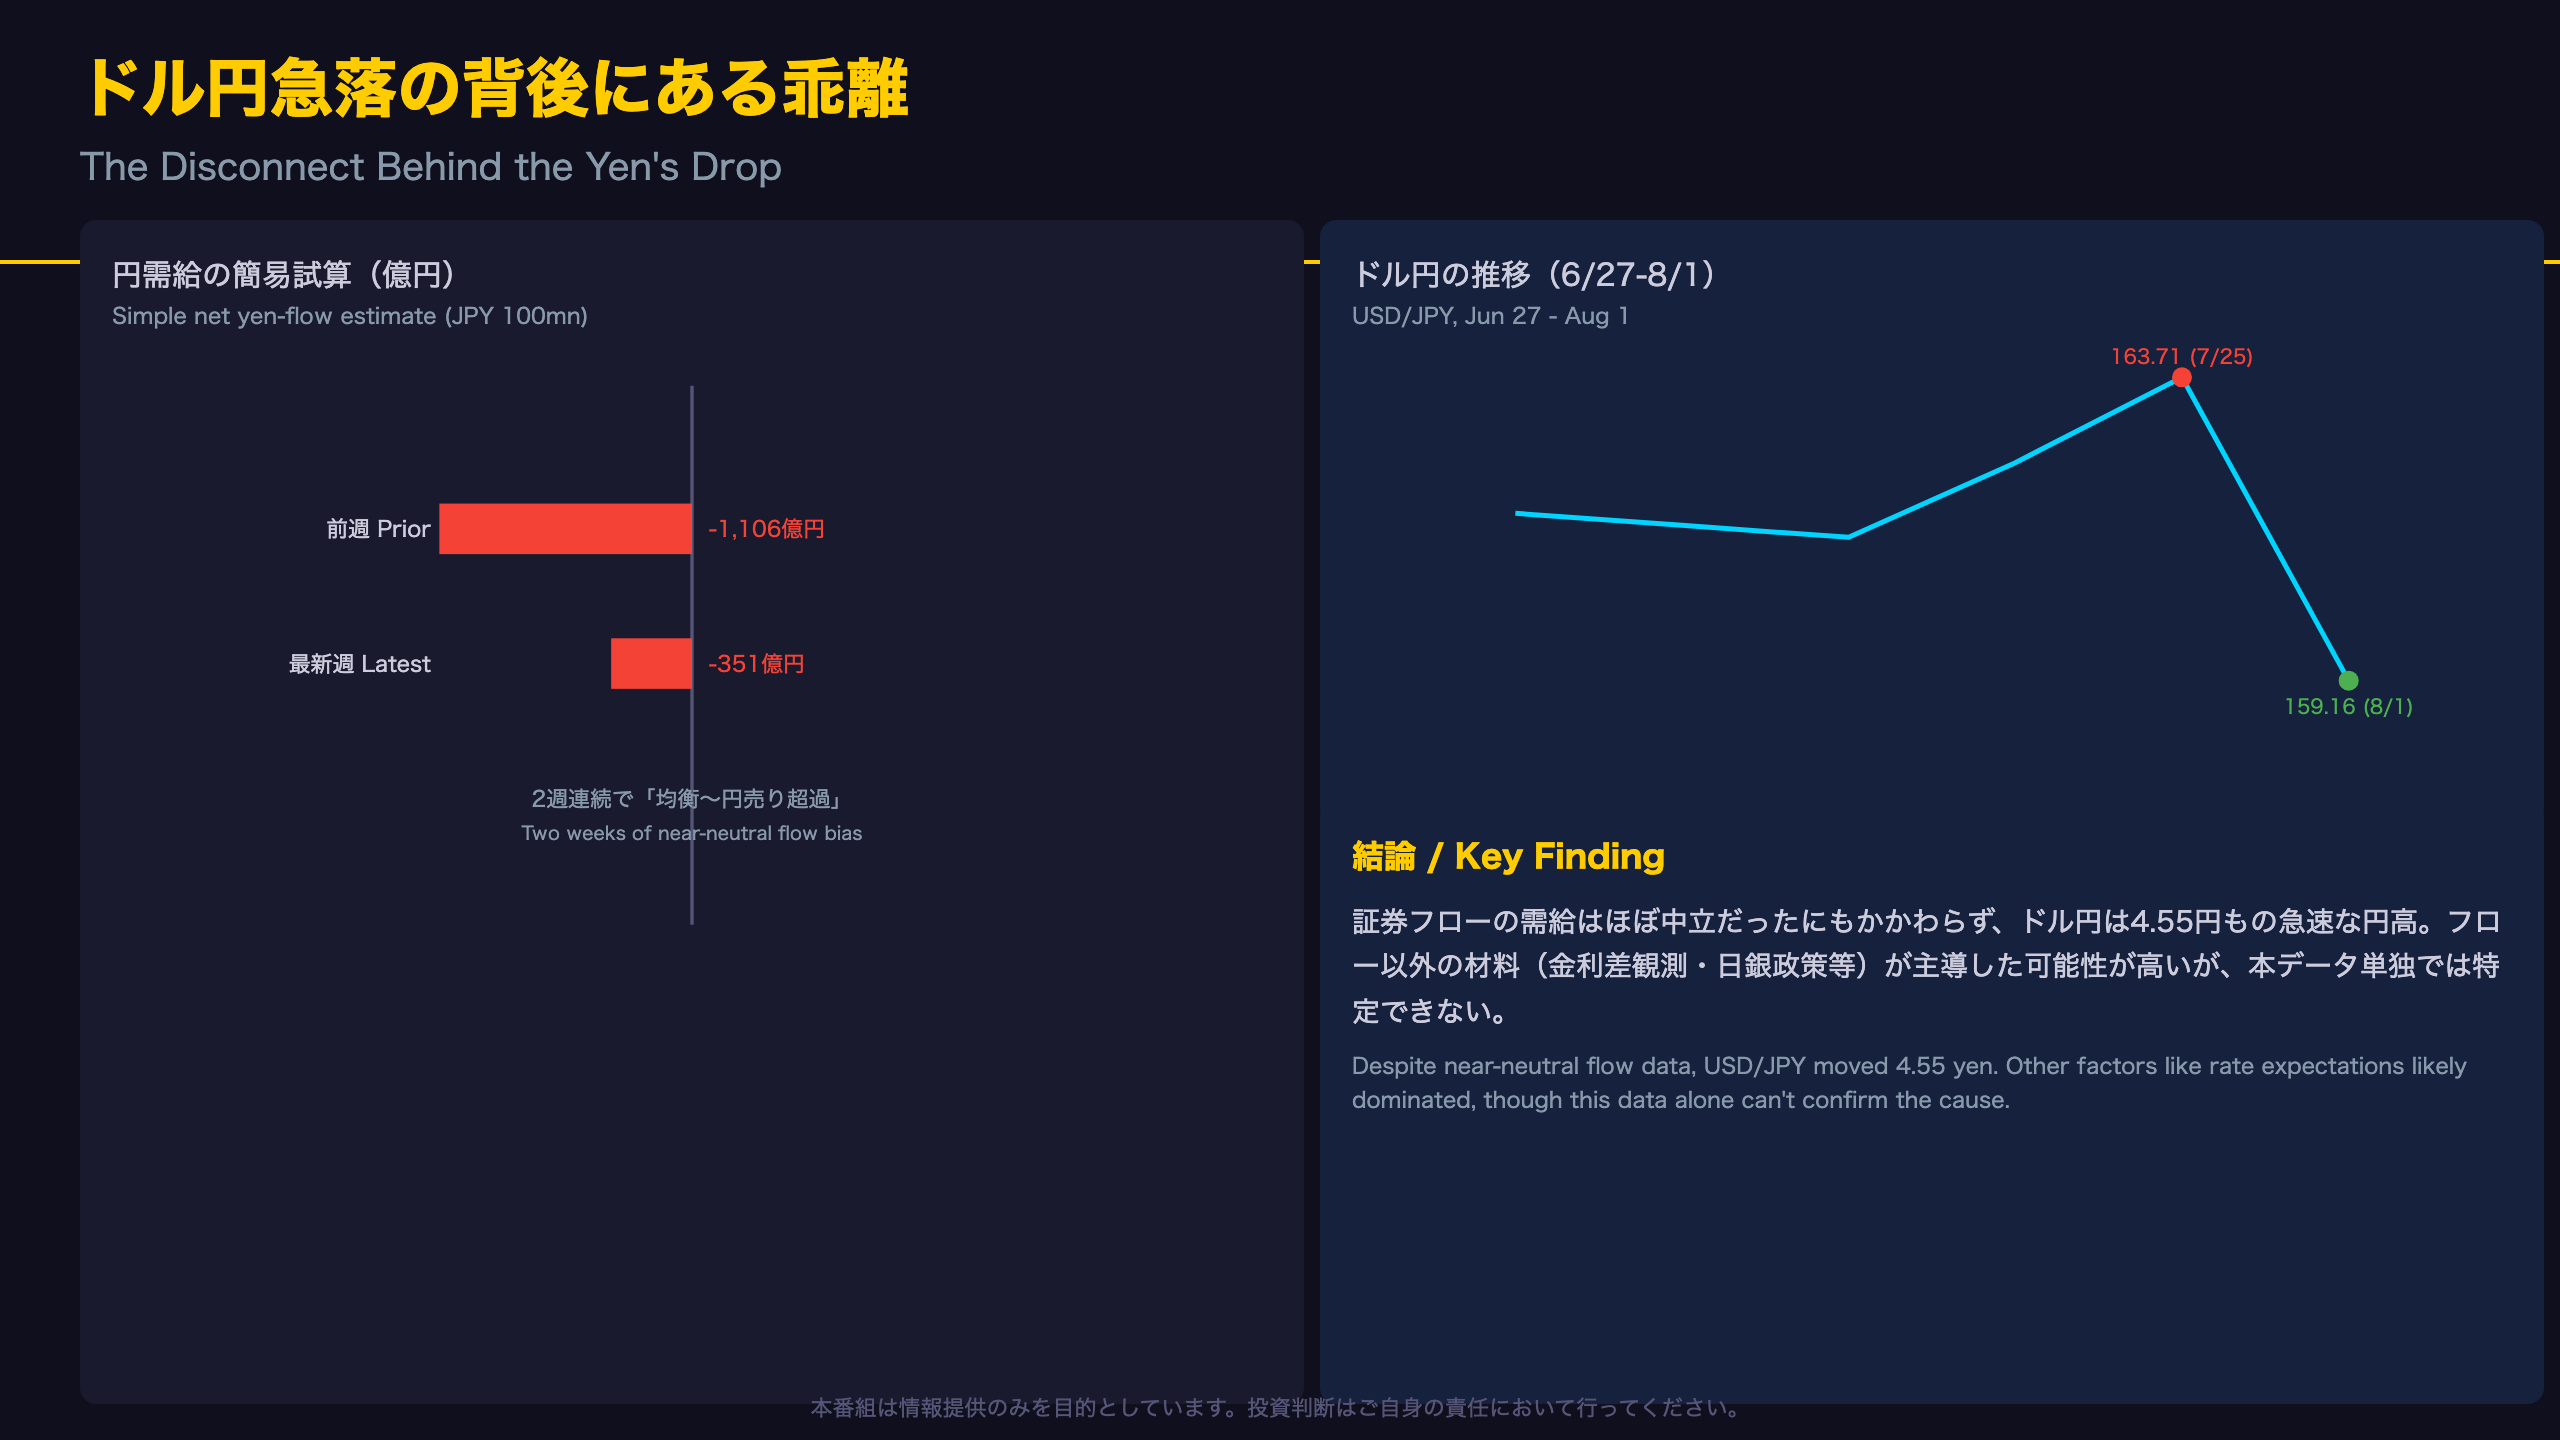
Examining the Paradox Between Flows and FX
The most thought-provoking finding in this data is the apparent disconnect between securities flow estimates and the actual currency move.
Simple net yen-flow calculation (latest week)
- Yen-buying: Foreign JGB purchases (+¥558.9bn) + Japanese foreign-stock sales (¥276.4bn) = ¥835.3bn
- Yen-selling: Foreign JP-stock sales (¥392.5bn) + Japanese foreign-bond purchases (¥477.9bn) = ¥870.4bn
- Net: -¥35.1bn (marginal yen-selling bias)
Prior week calculation
- Yen-buying: Foreign JP-stock purchases (¥912.1bn) + Japanese foreign-bond sales (¥811.4bn) = ¥1,723.5bn
- Yen-selling: Foreign JGB sales (¥1,513.9bn) + Japanese foreign-stock purchases (¥320.2bn) = ¥1,834.1bn
- Net: -¥110.6bn (yen-selling bias)
For two consecutive weeks, this rough estimate pointed to a “balanced to slightly yen-negative” bias, yet USD/JPY actually moved from 163.71 to 159.16 — a sharp 4.55 yen appreciation.
This calculation is a rough approximation based only on reporting-institution flows in long-term bonds and listed equities. It does not capture short-term instruments, FX swaps, real-money spot transactions, or speculative positioning — all of which can move the exchange rate independently of these reported flows.
It is generally believed that USD/JPY is driven by a combination of factors including US-Japan rate differential expectations, BOJ policy stance, and US economic data. However, this dataset alone cannot pinpoint the specific driver behind the yen’s move. What can be said with confidence is that weekly securities flow data alone fails to explain the recent yen strength — a useful reminder for anyone using flow data as a standalone FX signal, in contrast to, say, US TIC data which is even less frequent and thus even less useful for short-term FX calls.
日本人投資家の対外投資、構造的トレンド
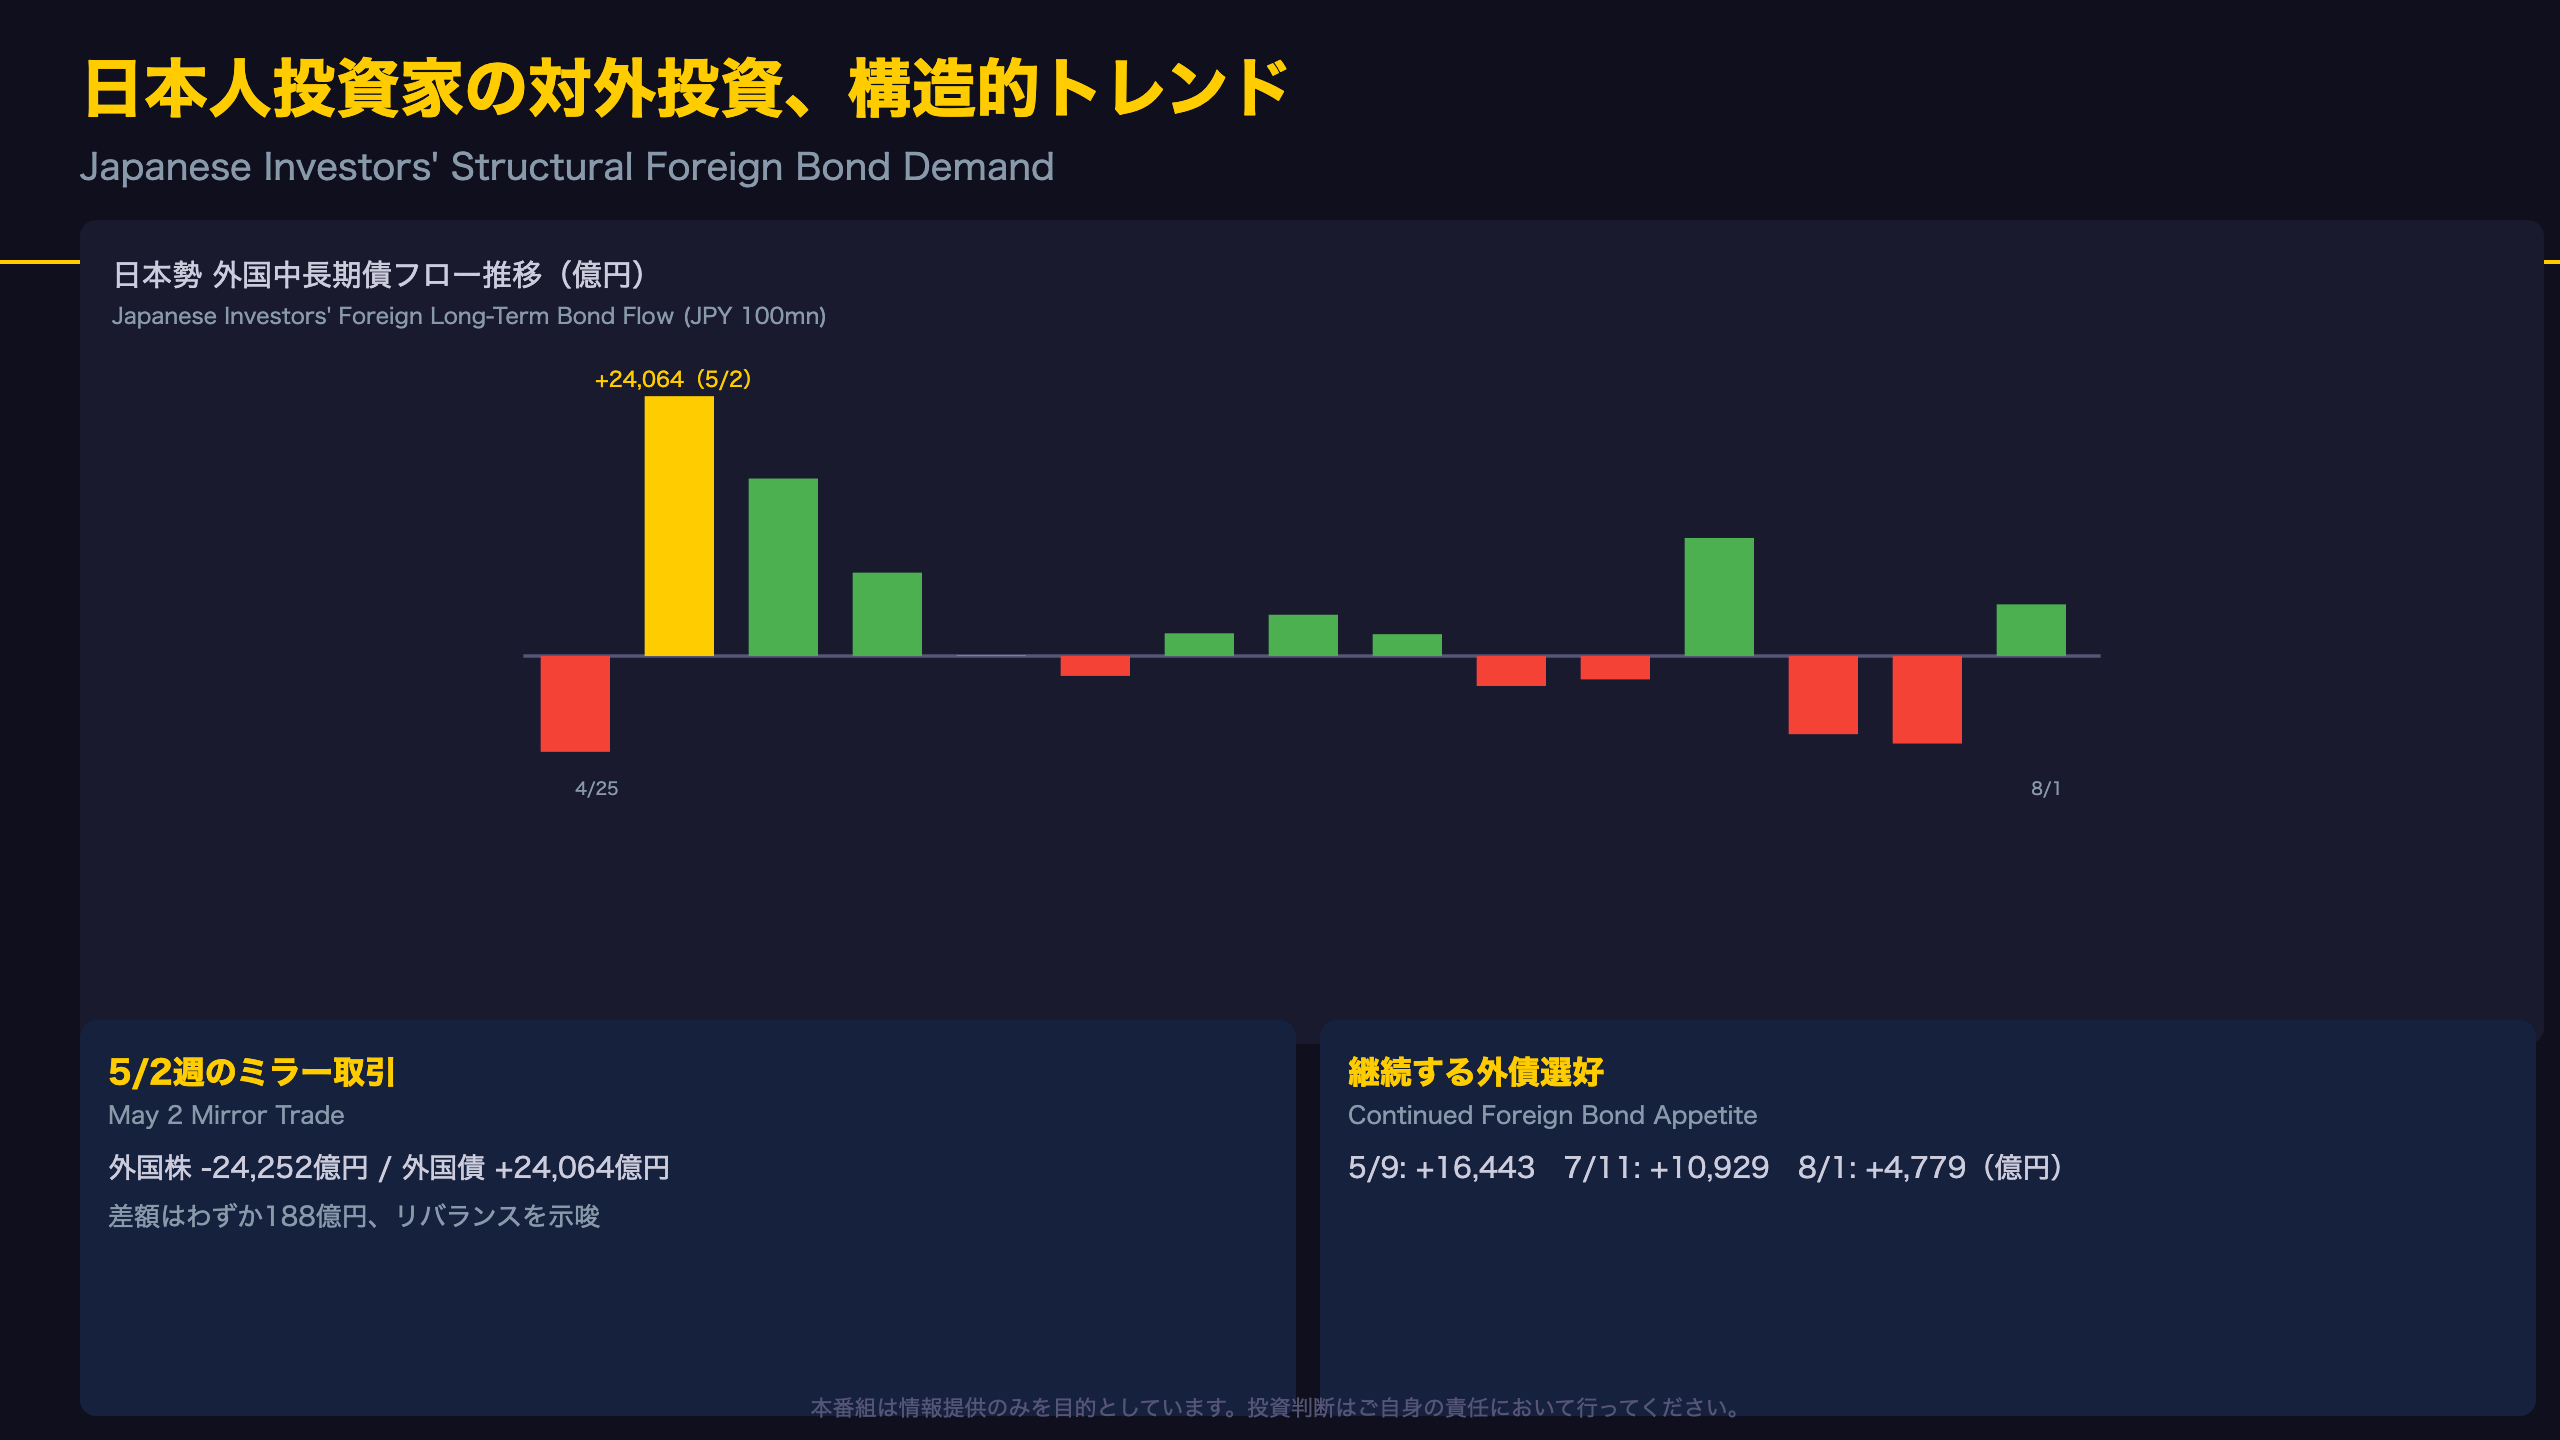
Signs of a GPIF-Style Rebalancing
One of the most notable episodes in the past year of data occurred in the week of May 2, 2026, when Japanese investors executed a striking asset allocation shift.
The May 2 mirror trade
- Foreign equities: -¥2,425.2bn (one of the largest sales of the year)
- Foreign long-term bonds: +¥2,406.4bn (nearly matching purchase)
The fact that the sale and purchase amounts differ by only ¥18.8bn — a striking degree of symmetry — suggests this was not a random coincidence, but likely a deliberate rebalancing trade by a large institutional investor such as a pension fund or life insurer. For readers unfamiliar with Japan’s investment landscape: GPIF (Government Pension Investment Fund), the world’s largest public pension fund, periodically rebalances its portfolio between domestic/foreign equities and bonds according to target allocation ratios, and such large mirror-image trades are consistent with that kind of activity. However, MOF’s weekly data does not break down flows by investor type, so this cannot be definitively attributed to GPIF or any specific institution.
Continued appetite for foreign bonds
| Week | Foreign Long-Term Bond Flow |
|---|---|
| May 9 | +¥1,644.3bn |
| Jul 11 | +¥1,092.9bn |
| Aug 1 (latest) | +¥477.9bn |
Beyond this one large rebalancing event, continued intermittent buying suggests that Japanese institutional investors’ structural preference for foreign bonds — seeking yield amid Japan’s persistently low domestic rates — has remained resilient across shifting rate differentials and exchange rate levels throughout the year.
Note that MOF’s weekly release reflects trade-date (contract) figures from reporting institutions such as banks and securities firms, not settlement-date figures, which is a key methodological distinction from some other countries’ capital flow data.
For international readers, this pattern echoes the well-documented “Japanese investor yield-seeking” theme that has been a structural driver of foreign bond demand for years, distinct from short-term speculative flows.
インプリケーション:次に見るべき指標
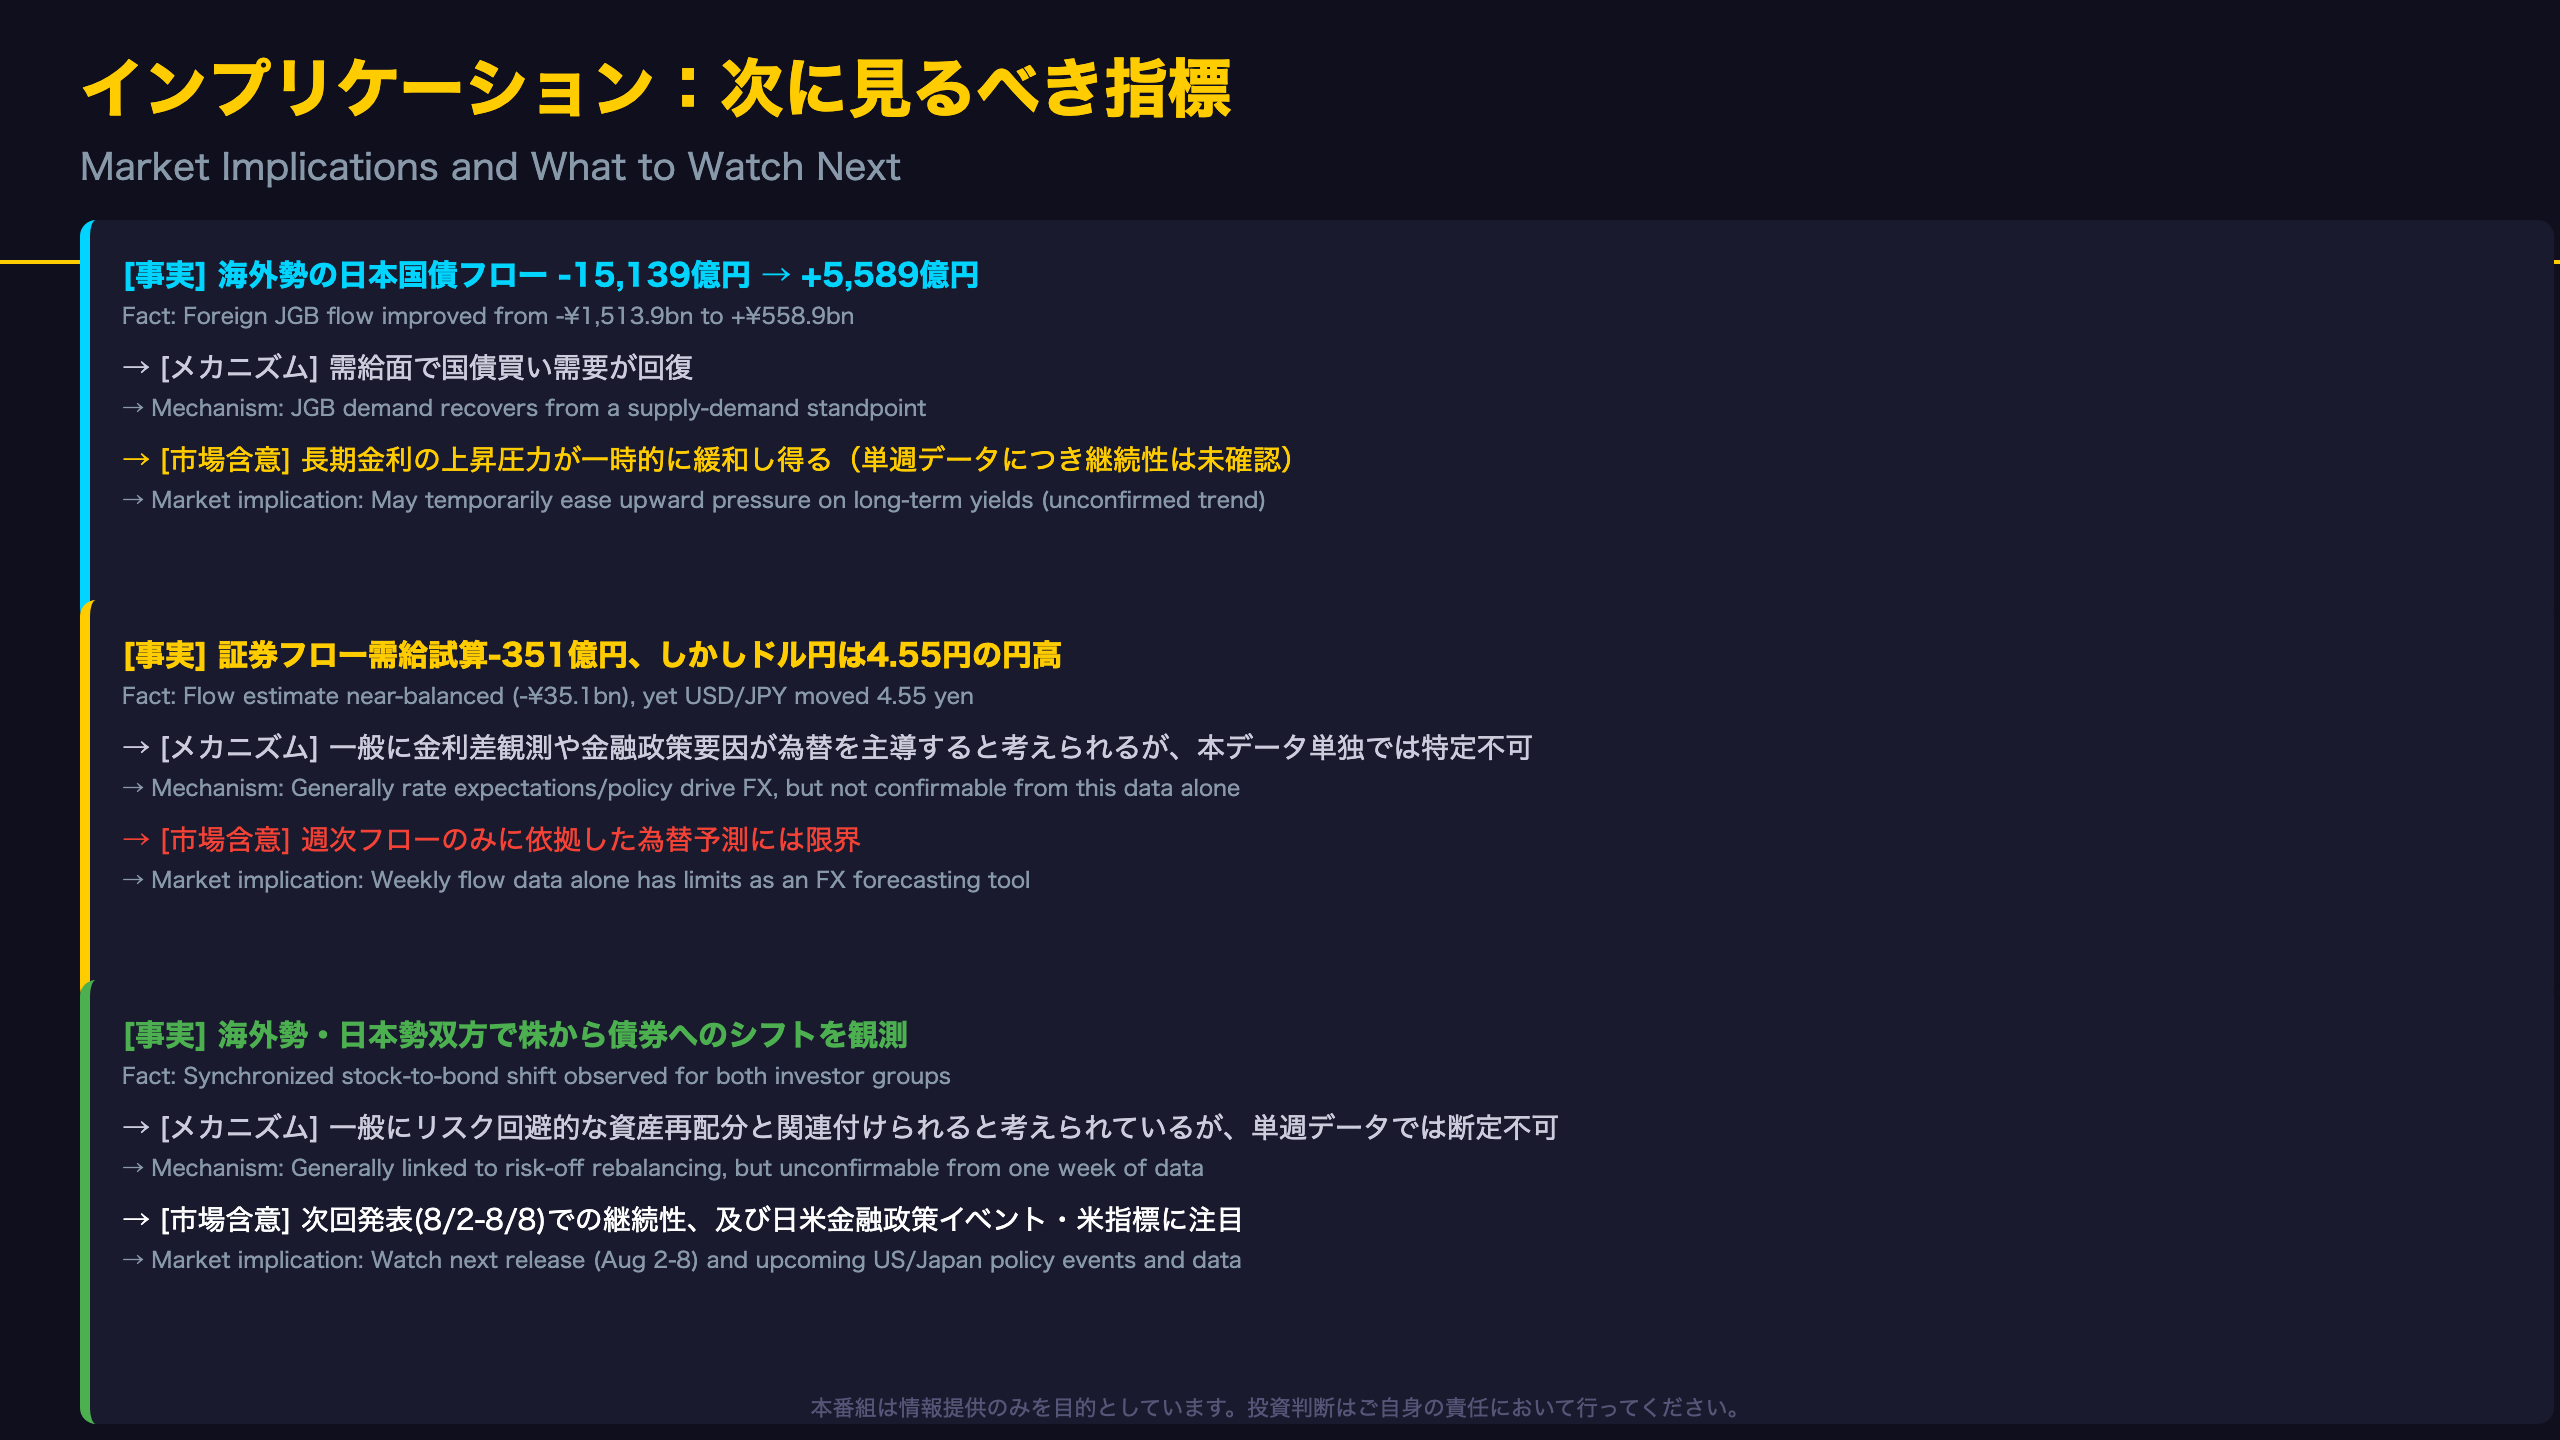
What to Watch Next
Here is a summary of the market implications drawn from this week’s report.
1. Impact on domestic rates
Foreign JGB flows improved from -¥1,513.9bn to +¥558.9bn week-over-week. A recovery in foreign demand for JGBs could ease upward pressure on long-term yields from a supply-demand perspective. However, a single week is insufficient to confirm whether this is a temporary buy-back or the start of a sustained trend — next week’s data will be key.
2. FX implications (the most important takeaway)
The net securities flow estimate was roughly balanced (-¥35.1bn), yet USD/JPY moved from 163.71 to 159.16, a 4.55 yen swing. It is generally believed that USD/JPY is driven by a combination of factors — US-Japan rate differential expectations, BOJ policy stance, and US economic data — but this securities flow data alone cannot identify the specific driver of the yen’s strength. At minimum, this episode demonstrates the limits of using weekly capital flow data alone as an FX forecasting tool, a useful lesson for investors who might otherwise over-index on MOF’s weekly release relative to, say, Fed or BOJ policy signals.
3. Equity market implications
The synchronized “stock-to-bond” shift observed among both foreign and Japanese investors is generally associated with risk-off rebalancing, but a single week of data is not enough to confirm the start of a structural de-risking trend. The next release (covering Aug 2-8) will be the key test of whether this pattern persists.
Key data points to watch
- Next MOF weekly flow release (week of Aug 2-8)
- US and Japan monetary policy events and official commentary
- Major US economic indicators (payrolls, CPI, etc.)
Cross-referencing these will help determine whether the flow-FX disconnect observed this week is a temporary anomaly or an early signal of a broader structural shift.
Disclaimer: This article is for informational purposes only. All investment decisions are made solely at your own risk.