📺 Watch the Full Video Analysis
This article was automatically generated by the NFC Market Live AI analysis system. (Updated: 2026-07-30 14:12 JST)
📄 Primary Source
内閣府経済社会総合研究所
https://www.esri.cao.go.jp/jp/stat/shouhi/gaiyou.pdf, https://www.esri.cao.go.jp/jp/stat/shouhi/honbun.pdf
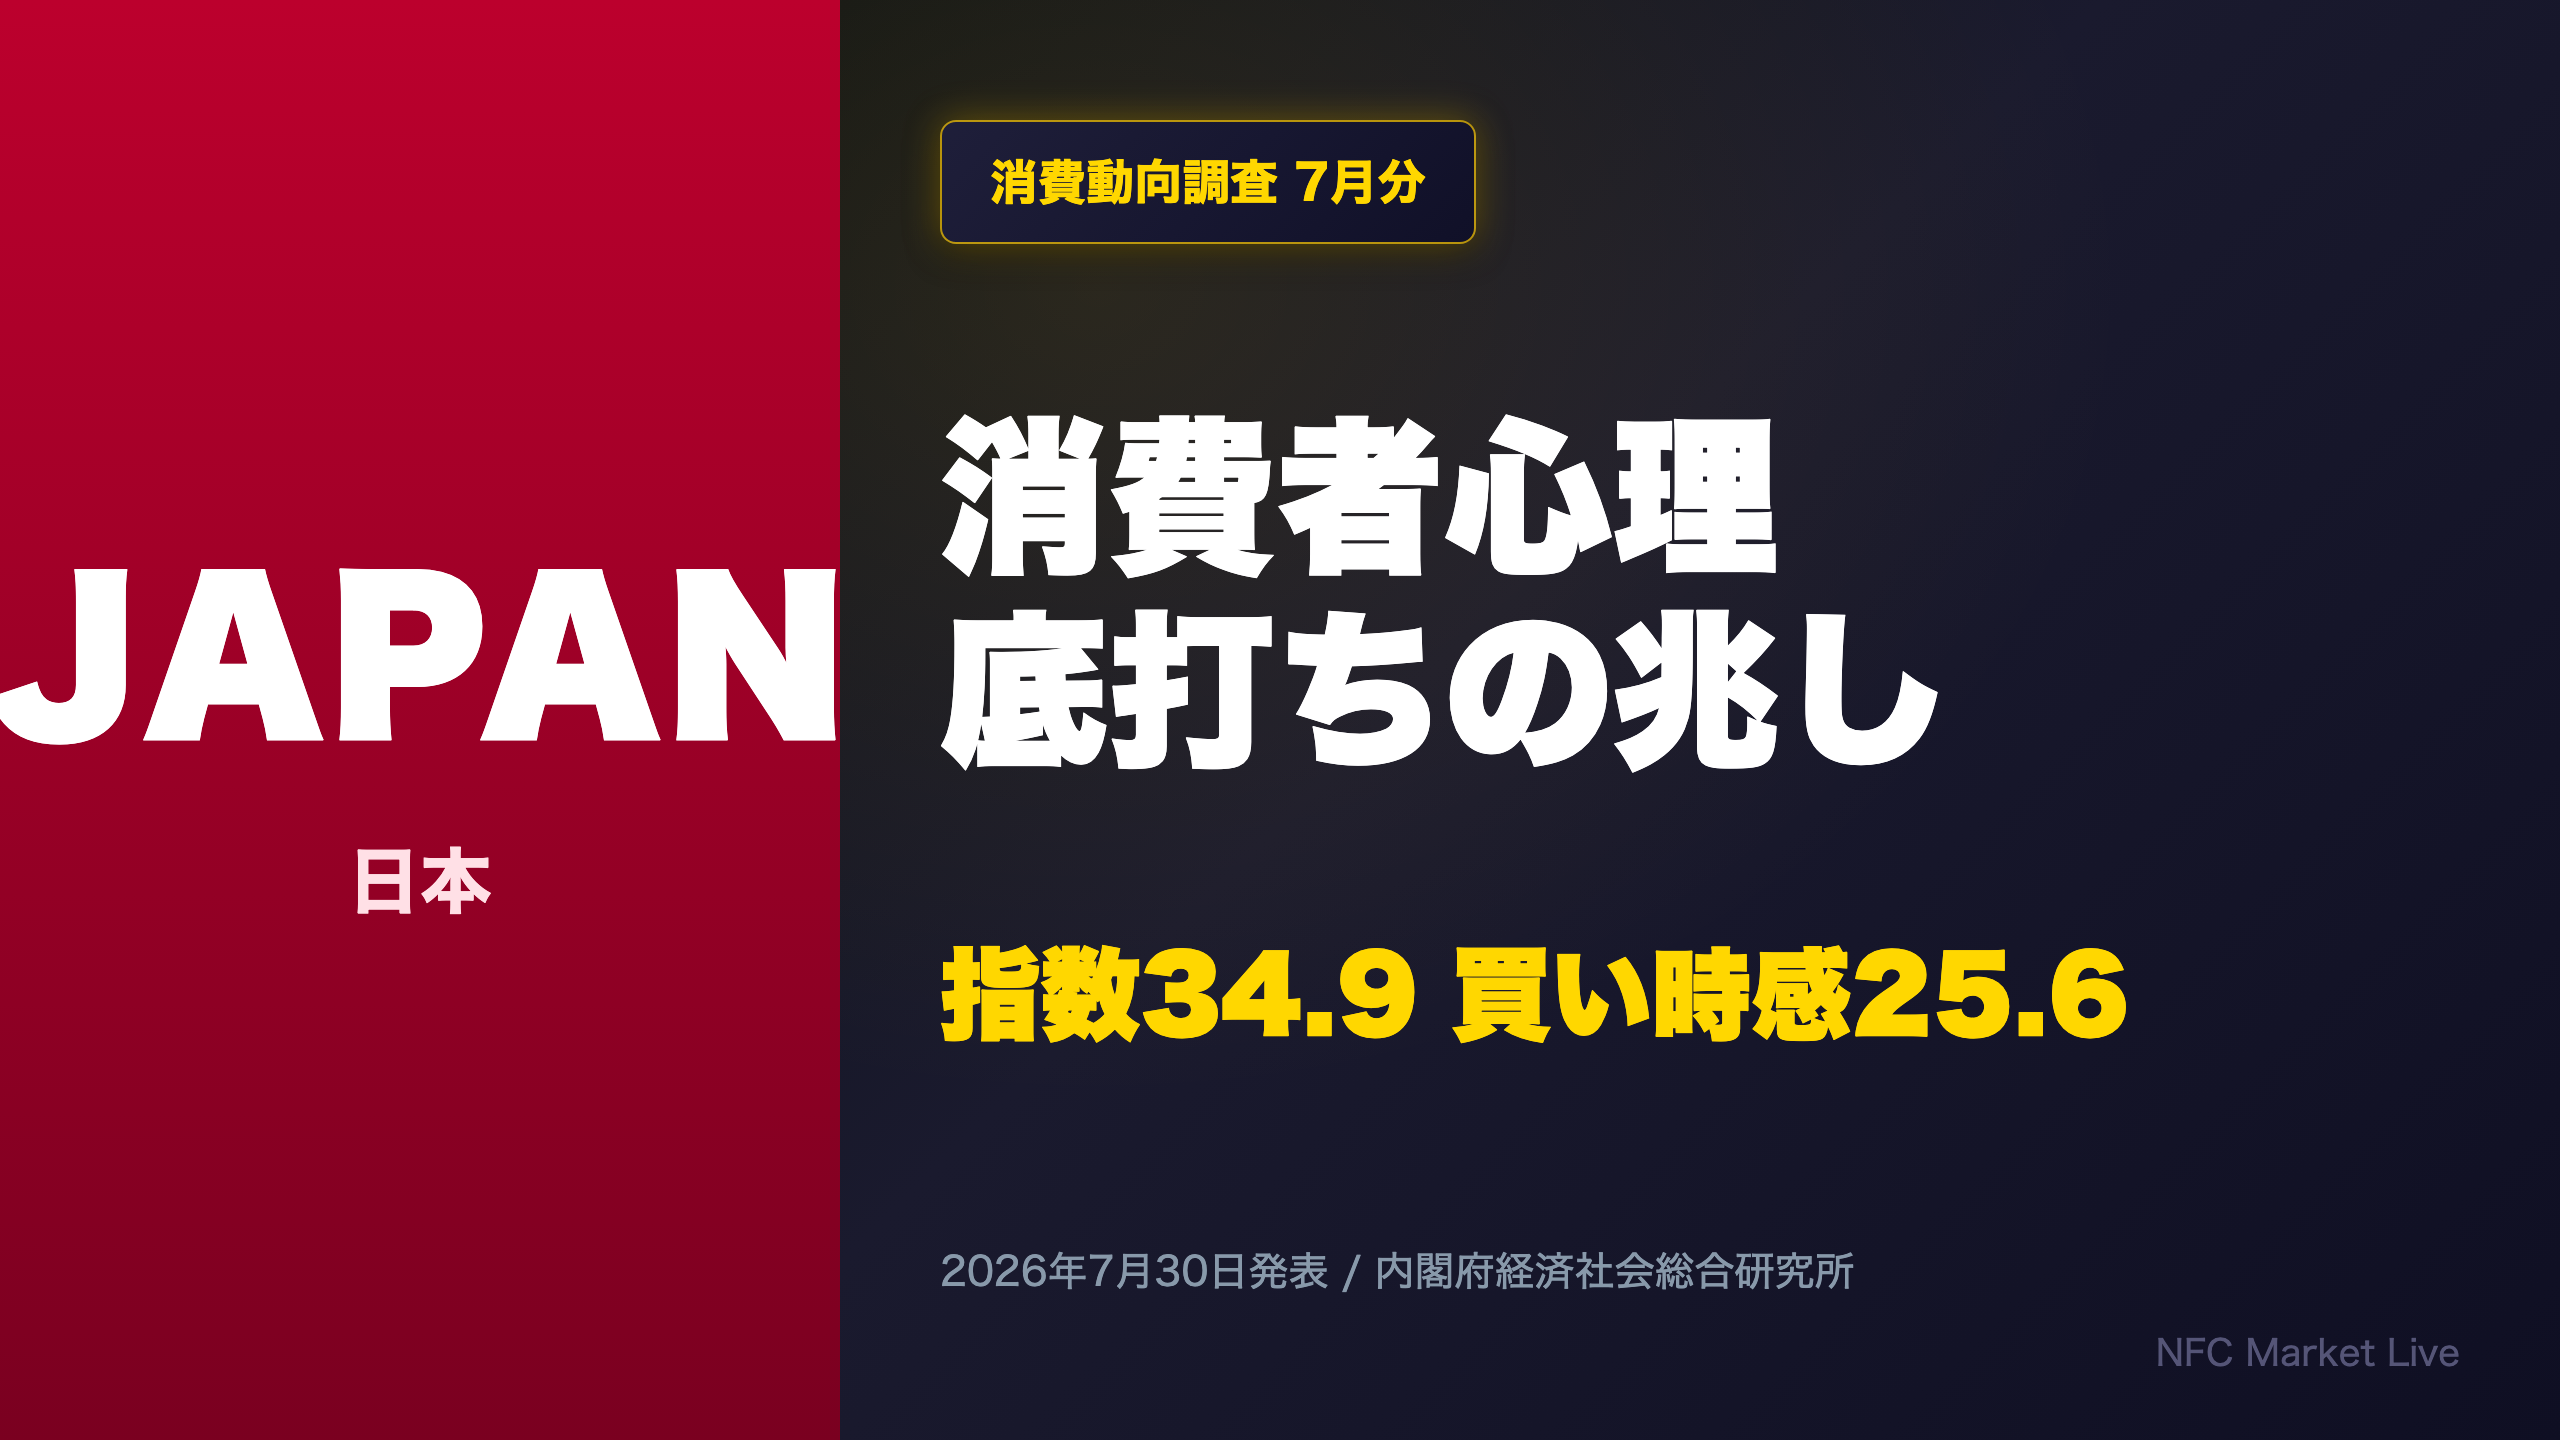
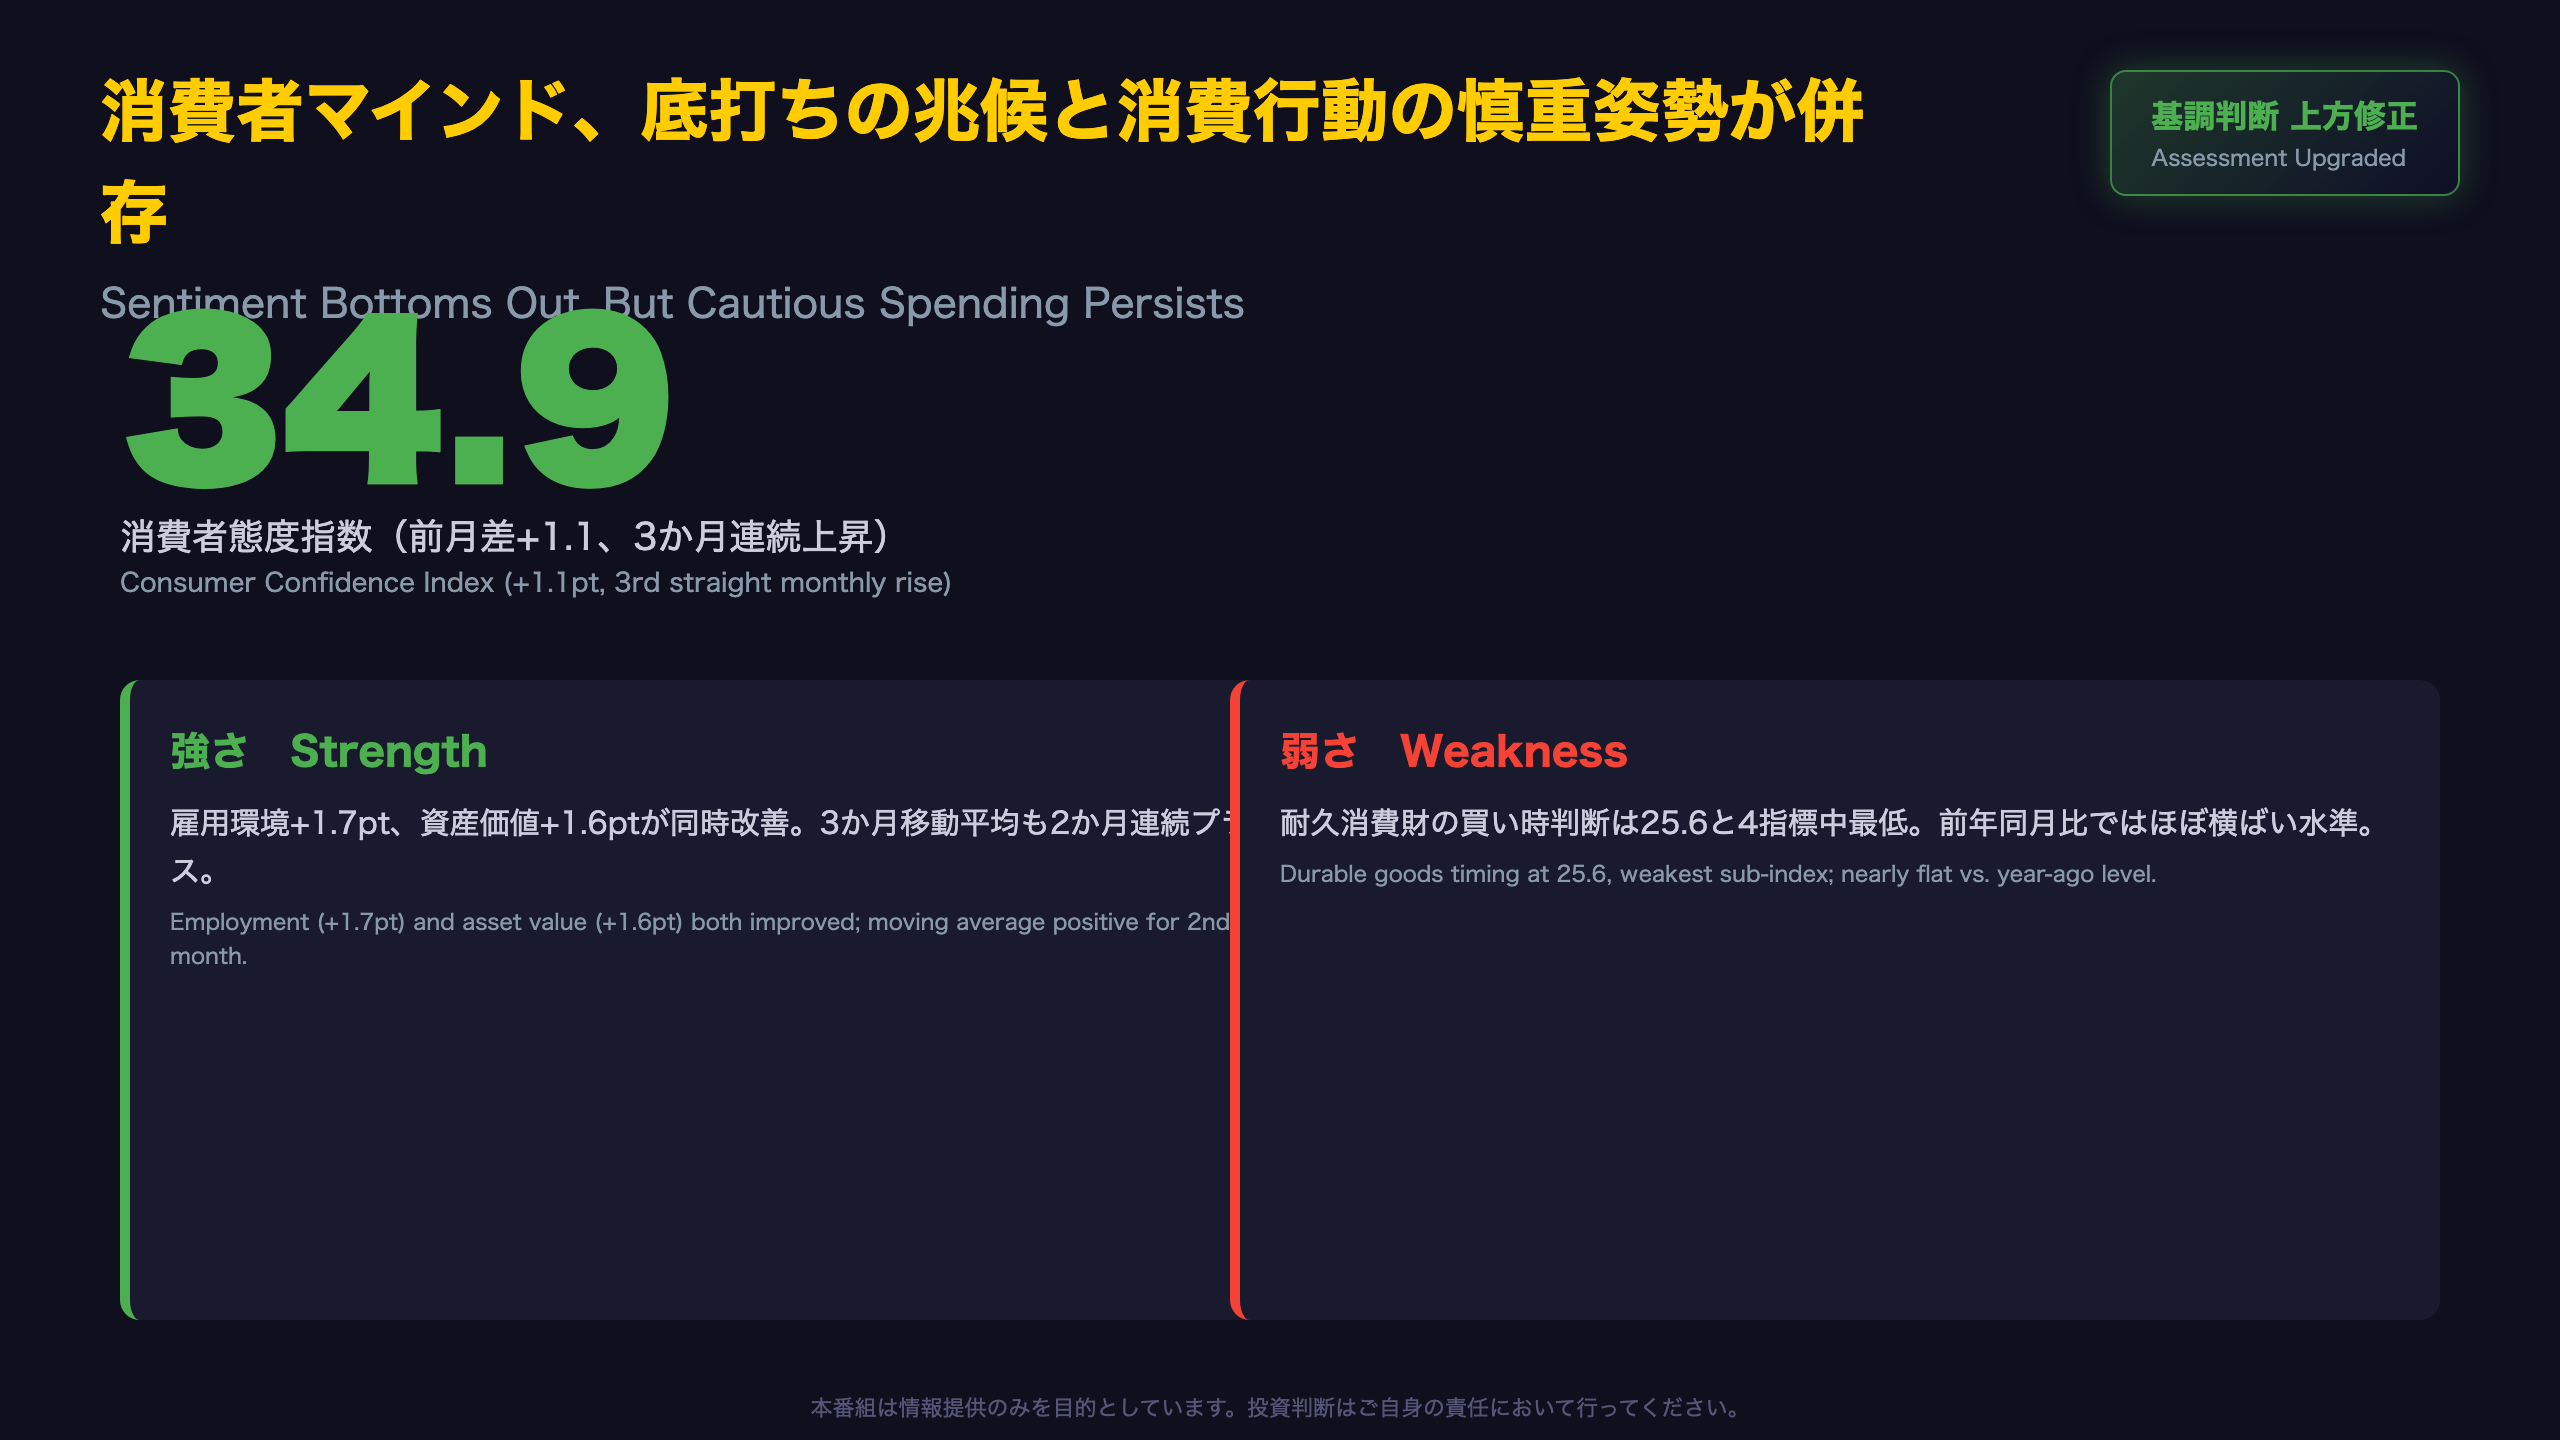
Japan’s Cabinet Office released the July 2026 Consumer Confidence Survey, showing the headline index at 34.9 (+1.1pt), the third straight monthly rise. The official assessment was upgraded from “weakening” to “showing signs of picking up.” 📊
Employment sentiment (+1.7pt) led the gain — but the underlying shift reflects fading pessimism, not rising optimism.
Durable goods purchase timing remains stuck at 25.6, the weakest of all four sub-indices. 📉
Expectations for 5%+ inflation eased from 54.0% to 52.1%, hinting that cooling extreme inflation fears may be supporting sentiment. 💡
We break down what this means for BOJ policy and Japan’s consumer stocks.
The Ultimate Summary
Japan’s Consumer Confidence: A Cautious Rebound, Not a Recovery
Japan’s Cabinet Office (Naikakufu) released its July 2026 Consumer Confidence Survey (Shohi Doko Chosa), showing the headline index at 34.9, up 1.1 points month-on-month — the third consecutive monthly gain. Notably, the government upgraded its assessment from “weakening” to “showing signs of picking up,” the first upward revision of the year.
For readers unfamiliar with this survey: it is Japan’s rough equivalent of the University of Michigan Consumer Sentiment Index, but conducted monthly by a government statistical agency (ESRI, under the Cabinet Office) via a mail/online survey of over 4,200 households. It measures forward-looking sentiment on livelihood, income, employment, and durable goods purchase timing over a six-month horizon.
Context matters more than the headline
The July reading of 34.9 is nearly identical to July 2025’s 34.8 — meaning sentiment has essentially round-tripped over twelve months, rather than broken to new highs. The index also remains well below the 37-40 range seen in early 2024.
The three-month moving average rose 0.9 points, its second consecutive increase — a modest signal that this is not simply one month of statistical noise but a gradual bottoming pattern.
Market implications
For investors monitoring the Bank of Japan’s policy path, this data offers mixed signals. The BOJ has repeatedly cited a “virtuous cycle of wages and consumption” as a precondition for further rate hikes. A modest, uneven recovery in sentiment — driven by employment optimism but held back by durable-goods caution — does not yet provide unambiguous evidence of that cycle taking hold, arguing for continued gradualism, though this single report cannot determine the pace.
指数トレンドの深掘り
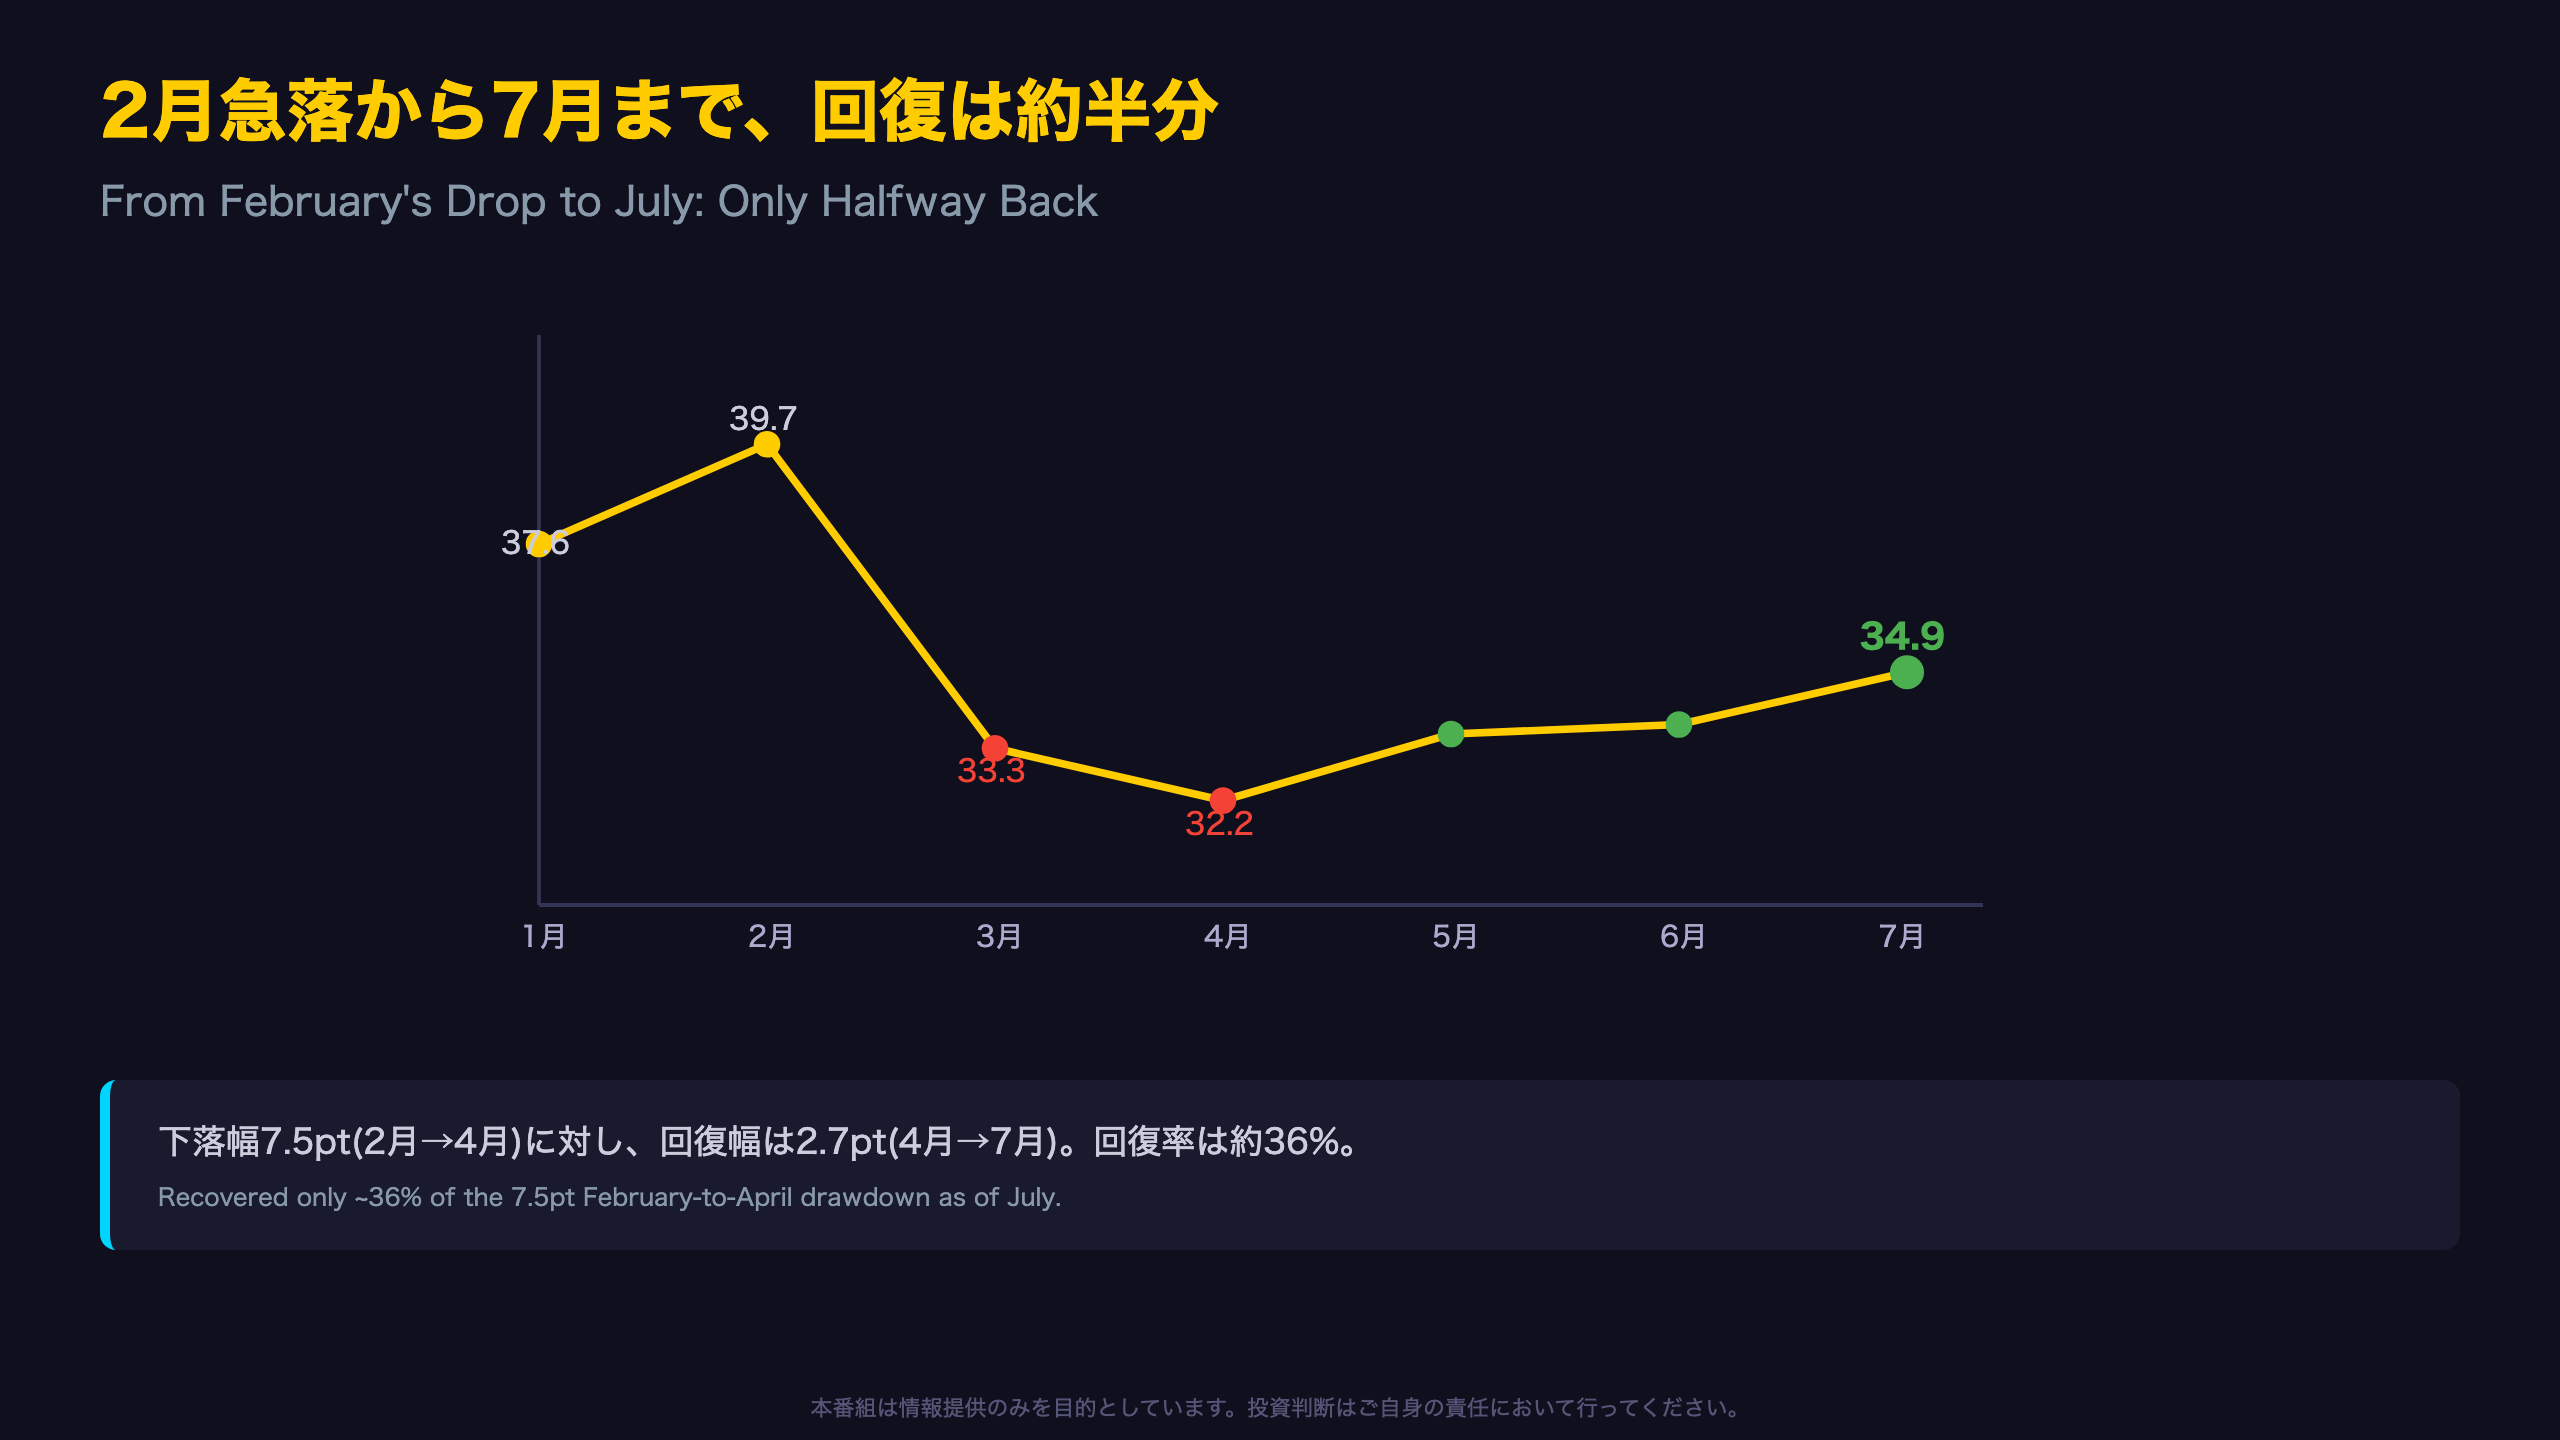
Reading the Recovery Curve: How Much Ground Has Been Recovered?
Japan’s Consumer Confidence Index tells a story of a sharp February-March decline followed by a slow, incomplete recovery. After peaking at 39.7 in February 2026, the index fell 6.4 points in March alone before bottoming near 32.2 in April.
Quantifying the “check mark”
From the February peak (39.7) to the April trough (32.2), the index lost 7.5 points. From April through July (34.9), it has recovered only 2.7 points — roughly 36% of the drawdown. For investors accustomed to V-shaped recoveries in survey data, Japan’s consumer sentiment recovery here looks more like a shallow partial rebound than a full round-trip.
Why the moving average matters
The Cabinet Office’s methodology emphasizes the three-month moving average because single-month readings in survey data are noisy. The report states the moving average rose 0.9 points, marking its second consecutive monthly increase — evidence this is not merely a statistical blip.
A note on measurement
Unlike the Conference Board’s US Consumer Confidence Index, which is often driven by labor-market headlines and equity swings, Japan’s index construction explicitly separates employment expectations from asset-value expectations, allowing analysts to isolate which driver is doing the work. As later analysis in this series shows, employment sentiment — not asset markets — is the primary engine of the July gain, a nuance easily missed if only headline numbers are compared.
構成指標の分解:雇用環境が牽引
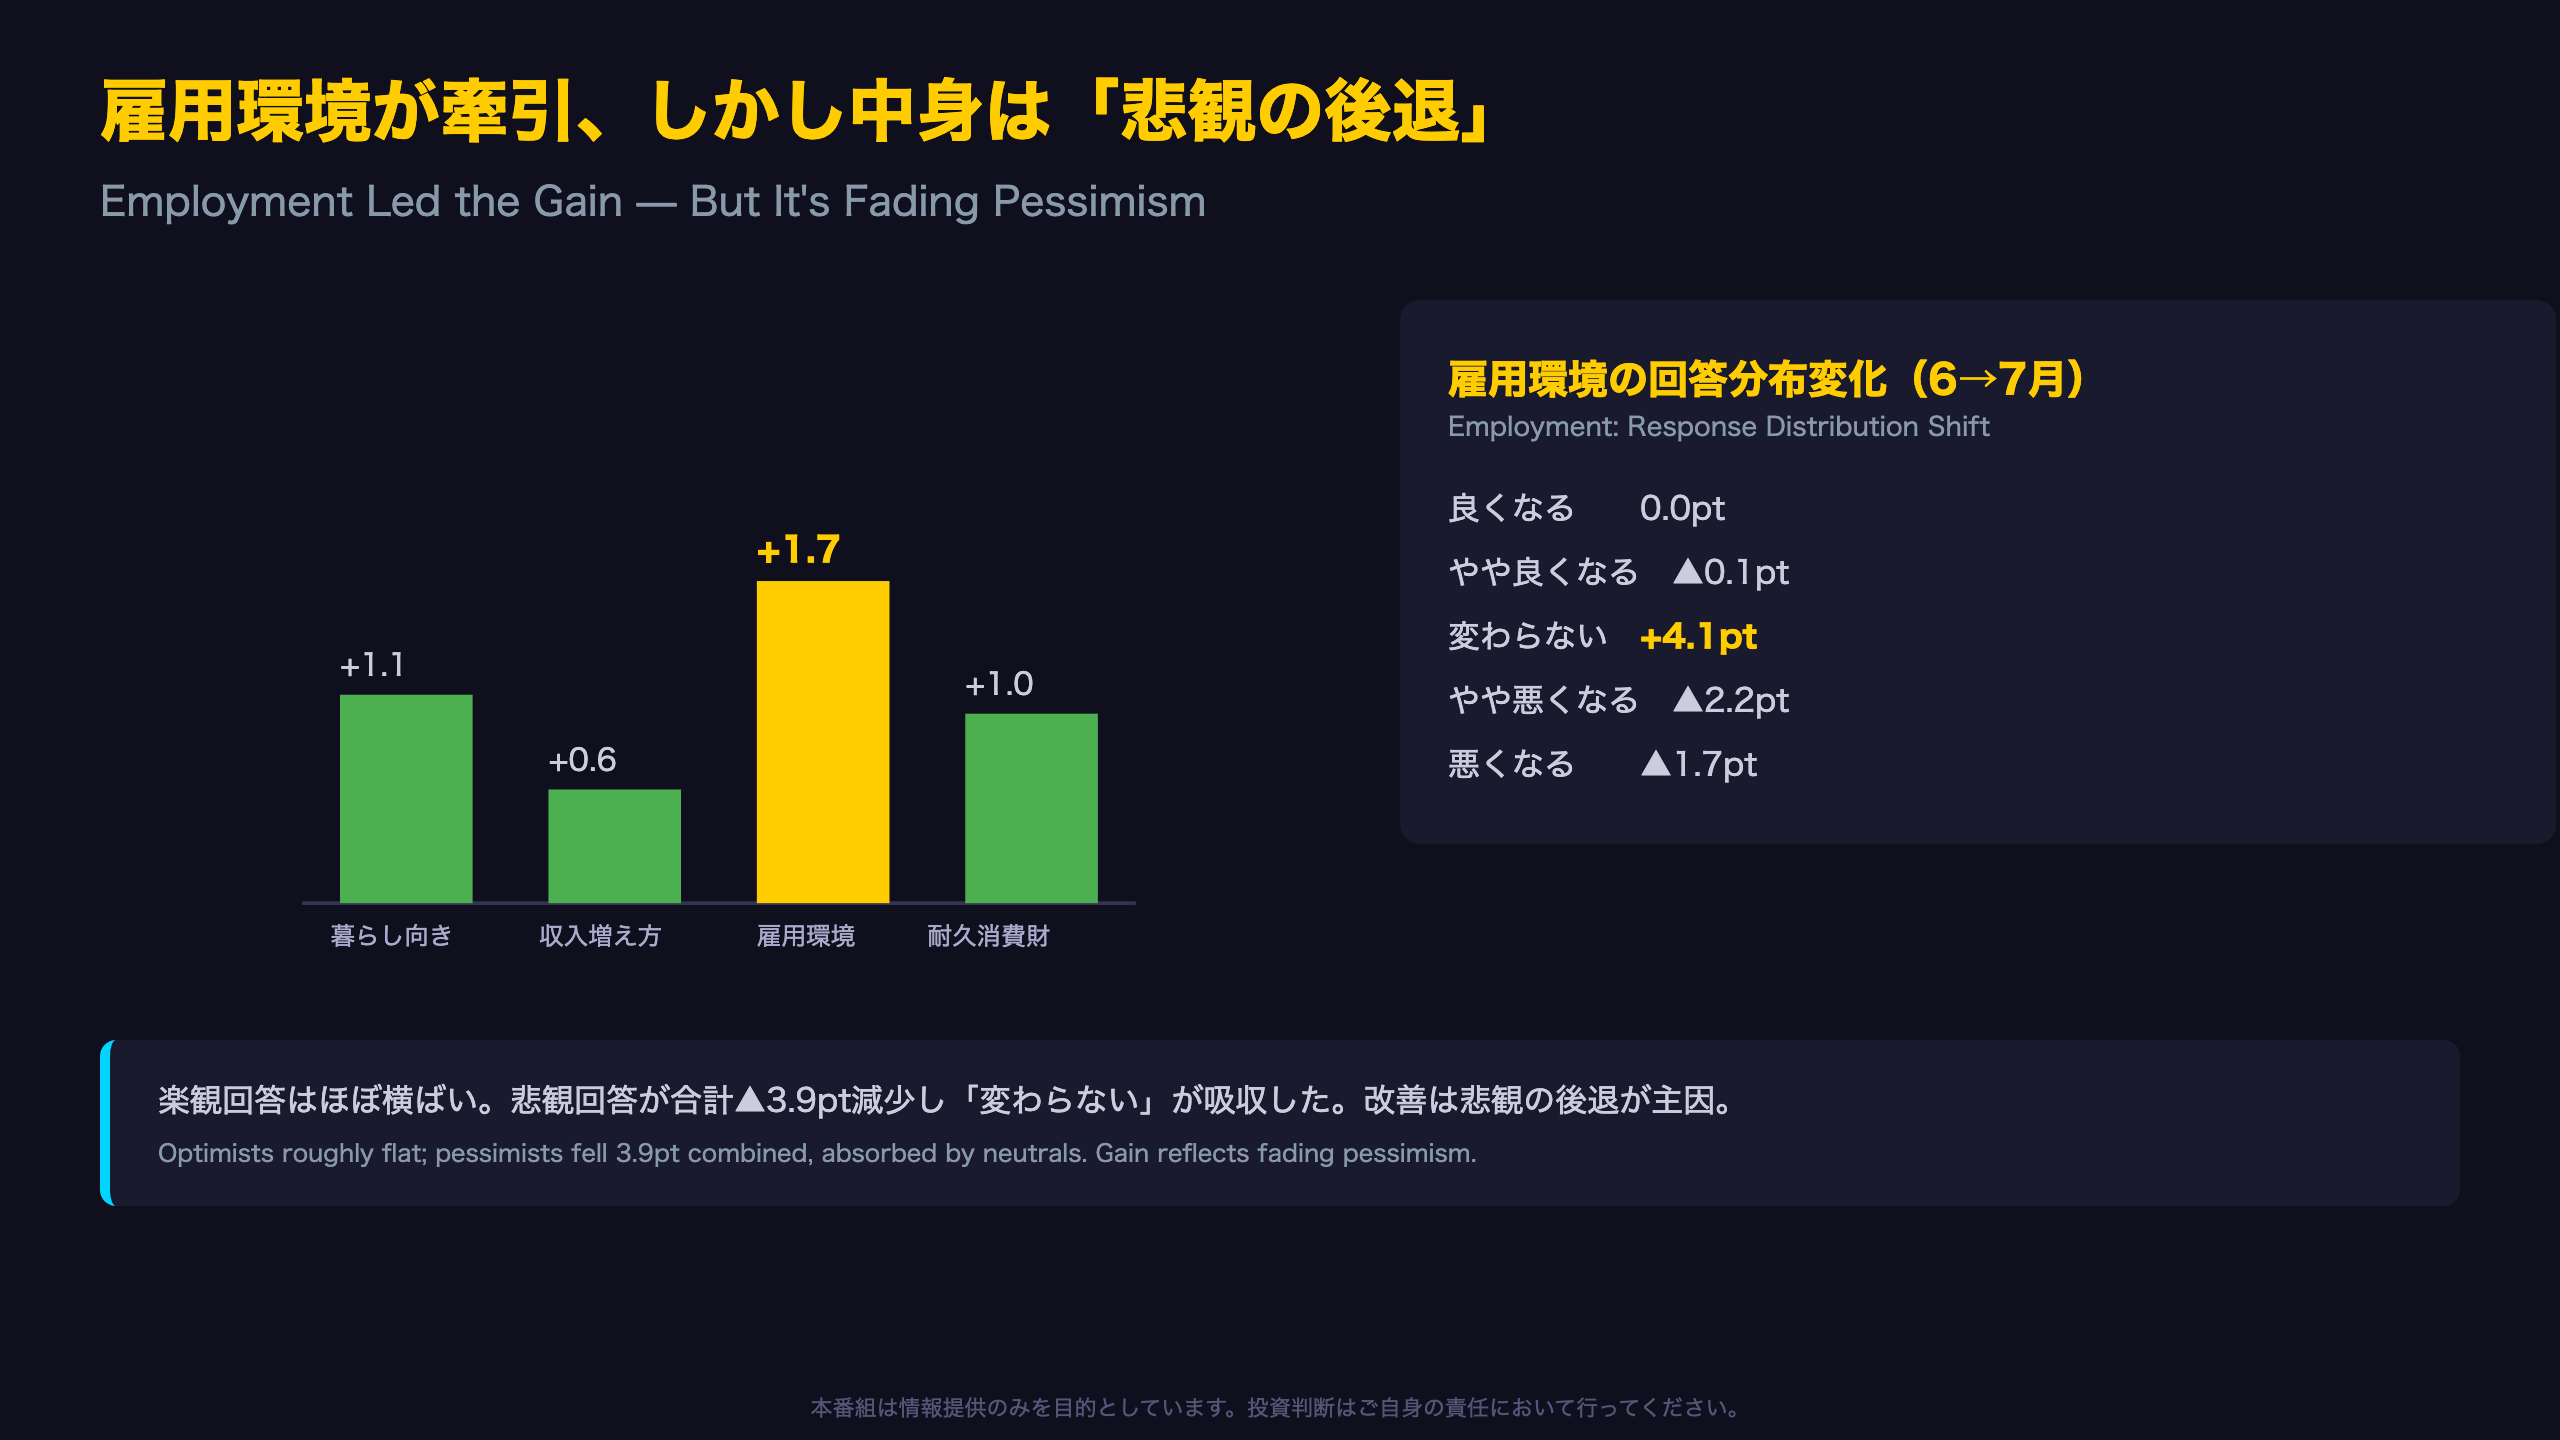
Optimism Rising, or Pessimism Retreating? A Distributional Analysis
The July index gain was driven primarily by employment sentiment (+1.7pt), but a closer look at the Cabinet Office’s response-distribution tables reveals a more nuanced picture than “consumers are becoming more optimistic.”
How the index is actually built
Japan’s index uses a five-point weighted scoring system uncommon among major consumer sentiment surveys: “will improve” equals 1.0, “no change” equals 0.5, “will worsen” equals 0. This differs from the University of Michigan survey’s methodology, and it means the index can rise purely from pessimists moving to neutral, without any net increase in optimists.
The employment data confirms this pattern
For employment, the share choosing “will improve” was flat and “will improve somewhat” actually fell slightly. The entire net gain came from a 4.1-point jump in “no change” responses, funded by a combined 3.9-point drop in the two pessimistic categories. The livelihood component showed the identical pattern.
Why this matters for investors
A rally built on fading pessimism tends to be less durable than one built on rising optimism — the former can stall once the pool of pessimists is exhausted. Whether “will improve” responses actually rise in the August survey will be the key test of whether this recovery has real momentum.
耐久消費財買い時判断の特異点
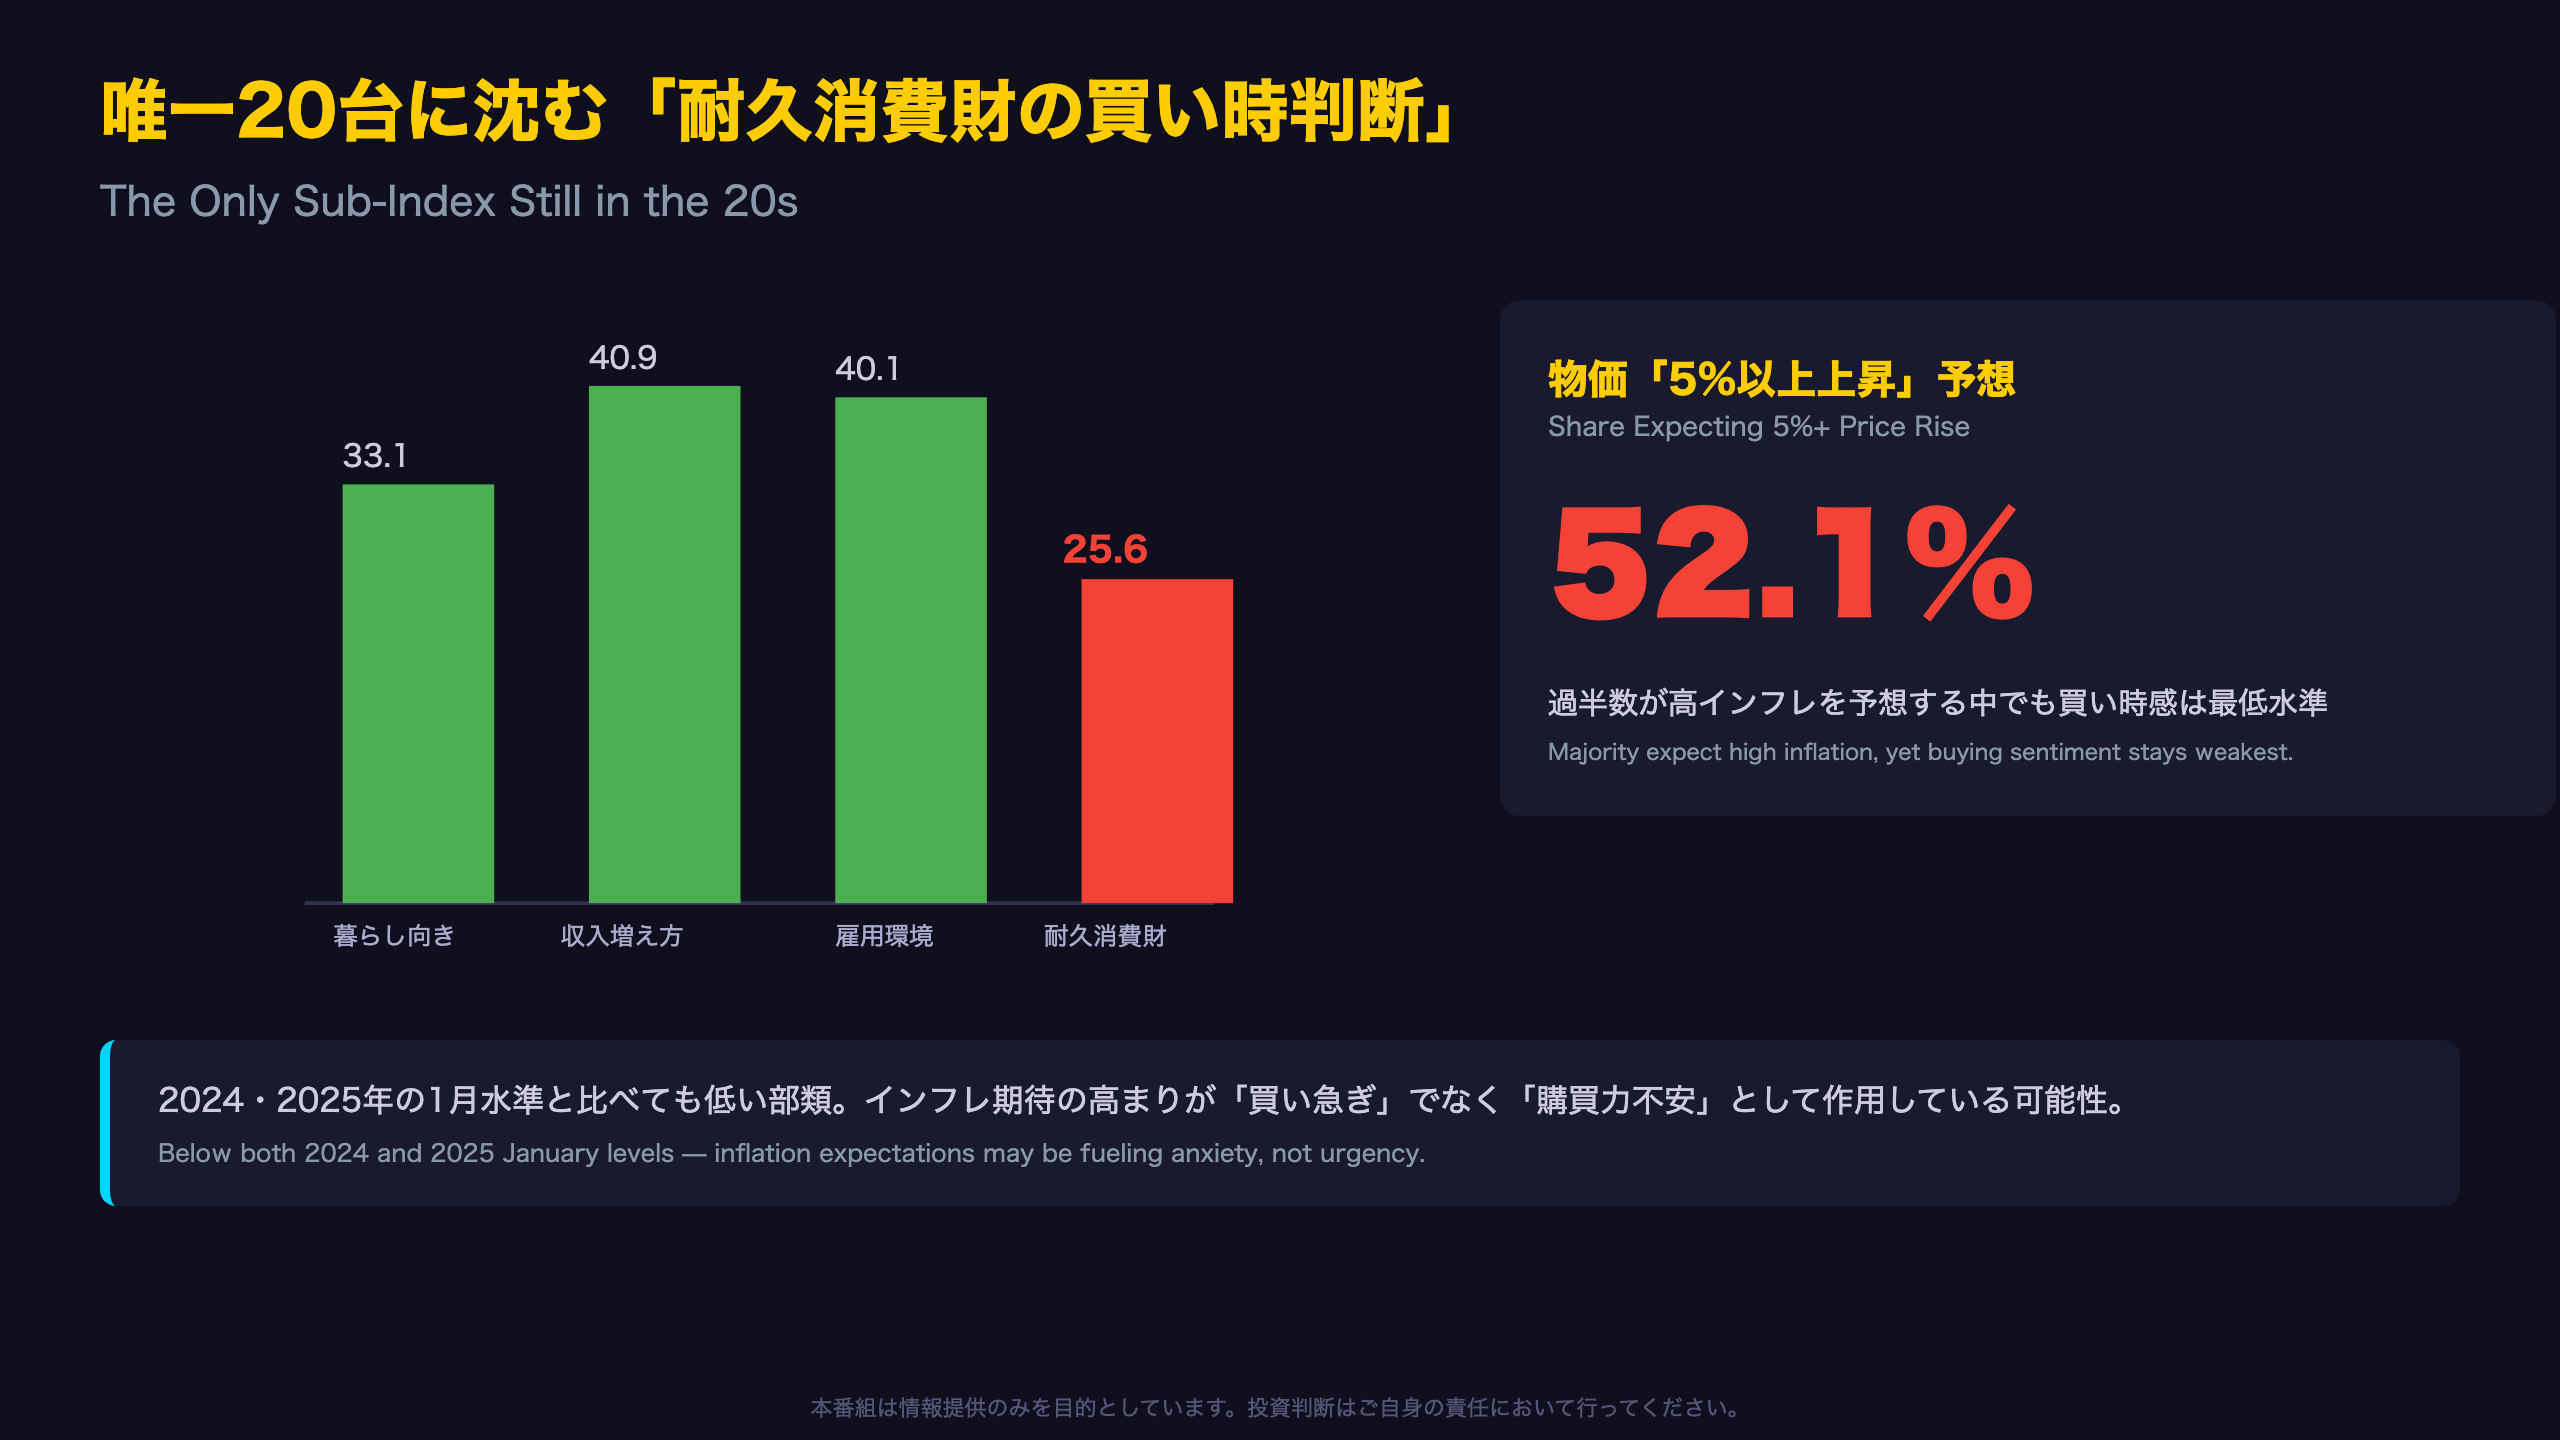
The Weakest Link: Why Durable Goods Timing Lags at 25.6
Among the four components of Japan’s Consumer Confidence Index, the durable goods purchase timing sub-index stands out as the persistent laggard at 25.6 — 7 to 15 points below the other three components.
Historical context for readers unfamiliar with the survey
This sub-index asks households whether now is a good time to buy durable goods (appliances, vehicles, furniture) looking six months ahead — conceptually similar to buying-conditions questions embedded in the University of Michigan survey, but tracked as a standalone, seasonally adjusted index in Japan.
Comparing January readings across years: 32.5 (2024), 27.2 (2025), 30.4 (2026 January) — the current 25.6 in July 2026 sits below all of these benchmarks, despite four consecutive months of modest recovery since the shock earlier this year.
A counterintuitive interplay with inflation expectations
Normally, rising inflation expectations should pull durable-goods timing sentiment up, as households rush to buy before prices climb further. Yet the Cabinet Office’s July release shows 52.1% of households expecting prices to rise 5% or more over the next year — a clear majority — even as durable-goods buying sentiment remains the weakest of all four sub-indices.
What this means for investors
This divergence suggests, though a single data point cannot confirm it definitively, that households may be more concerned about eroding real purchasing power than motivated to front-load big-ticket purchases. For investors in Japanese retail and consumer durables equities, elevated inflation expectations are not translating into buy-now behavior for large purchases.
物価見通し:インフレ期待の分布シフト
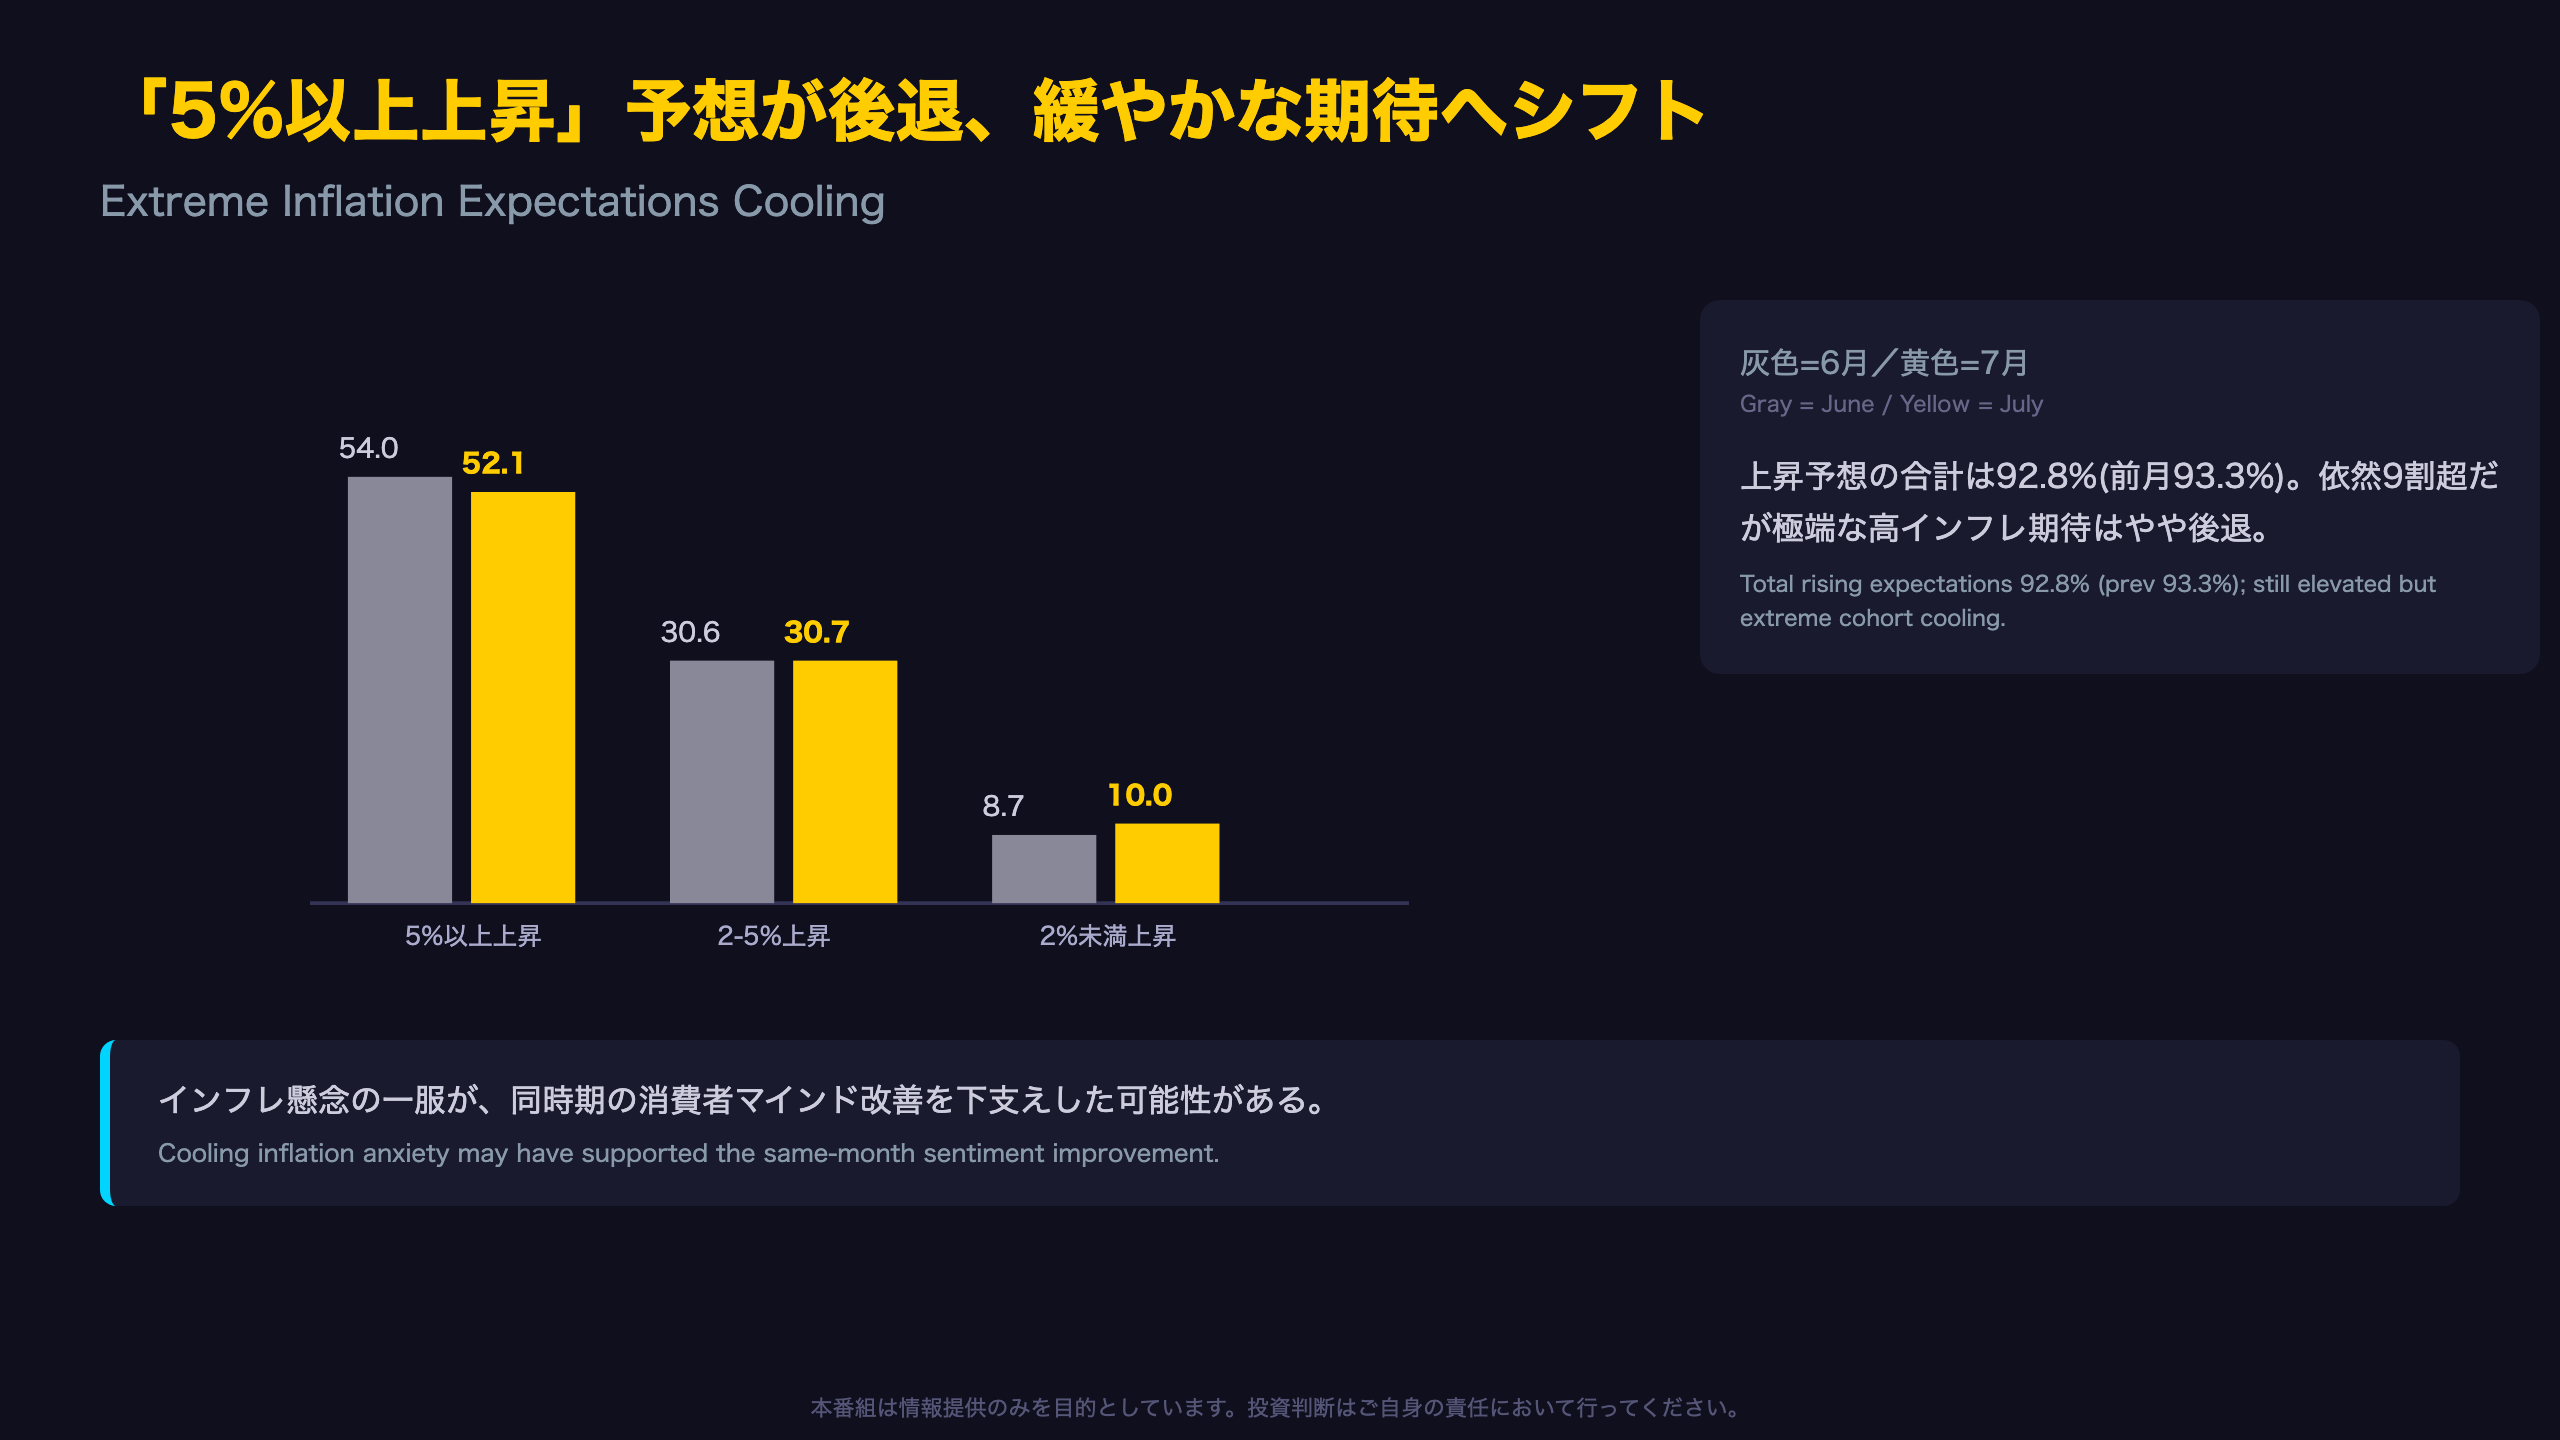
Inflation Expectations: A Subtle Distributional Shift, Not a Reversal
The July survey shows 52.1% of households still expect prices to rise 5% or more over the next year — still the single largest response category — but the month-on-month shift reveals a meaningful nuance for anyone tracking Japan’s inflation psychology.
The data in context
| Category | June | July | Change |
|---|---|---|---|
| Rise 5%+ | 54.0% | 52.1% | -1.9pt |
| Rise 2-5% | 30.6% | 30.7% | +0.1pt |
| Rise <2% | 8.7% | 10.0% | +1.3pt |
| Total rising | 93.3% | 92.8% | -0.5pt |
| No change | 2.5% | 2.9% | +0.4pt |
| Total falling | 2.2% | 2.5% | +0.3pt |
Why this matters relative to the BOJ’s 2% target
Unlike the US Fed’s 2% PCE target, the Bank of Japan has spent over a decade fighting deflationary psychology, meaning elevated inflation expectations have historically been viewed as progress, not a risk. Against that backdrop, 92.8% of households still expect some price increase, comfortably above pre-2022 norms. The move here is a modest cooling of the extreme 5%+ cohort into more moderate buckets, not a shift toward deflationary expectations.
The coincidence with improving sentiment
Notably, this modest cooling of extreme inflation expectations occurred in the same month overall confidence rose 1.1 points. This raises the possibility, though a single month cannot confirm causality, that easing anxiety over runaway prices contributed to the broader sentiment recovery — consistent with the earlier finding that durable-goods sentiment remains weak despite high inflation expectations, suggesting purchasing-power anxiety, not inflation itself, is the dominant psychological driver.
資産価値との連動と乖離
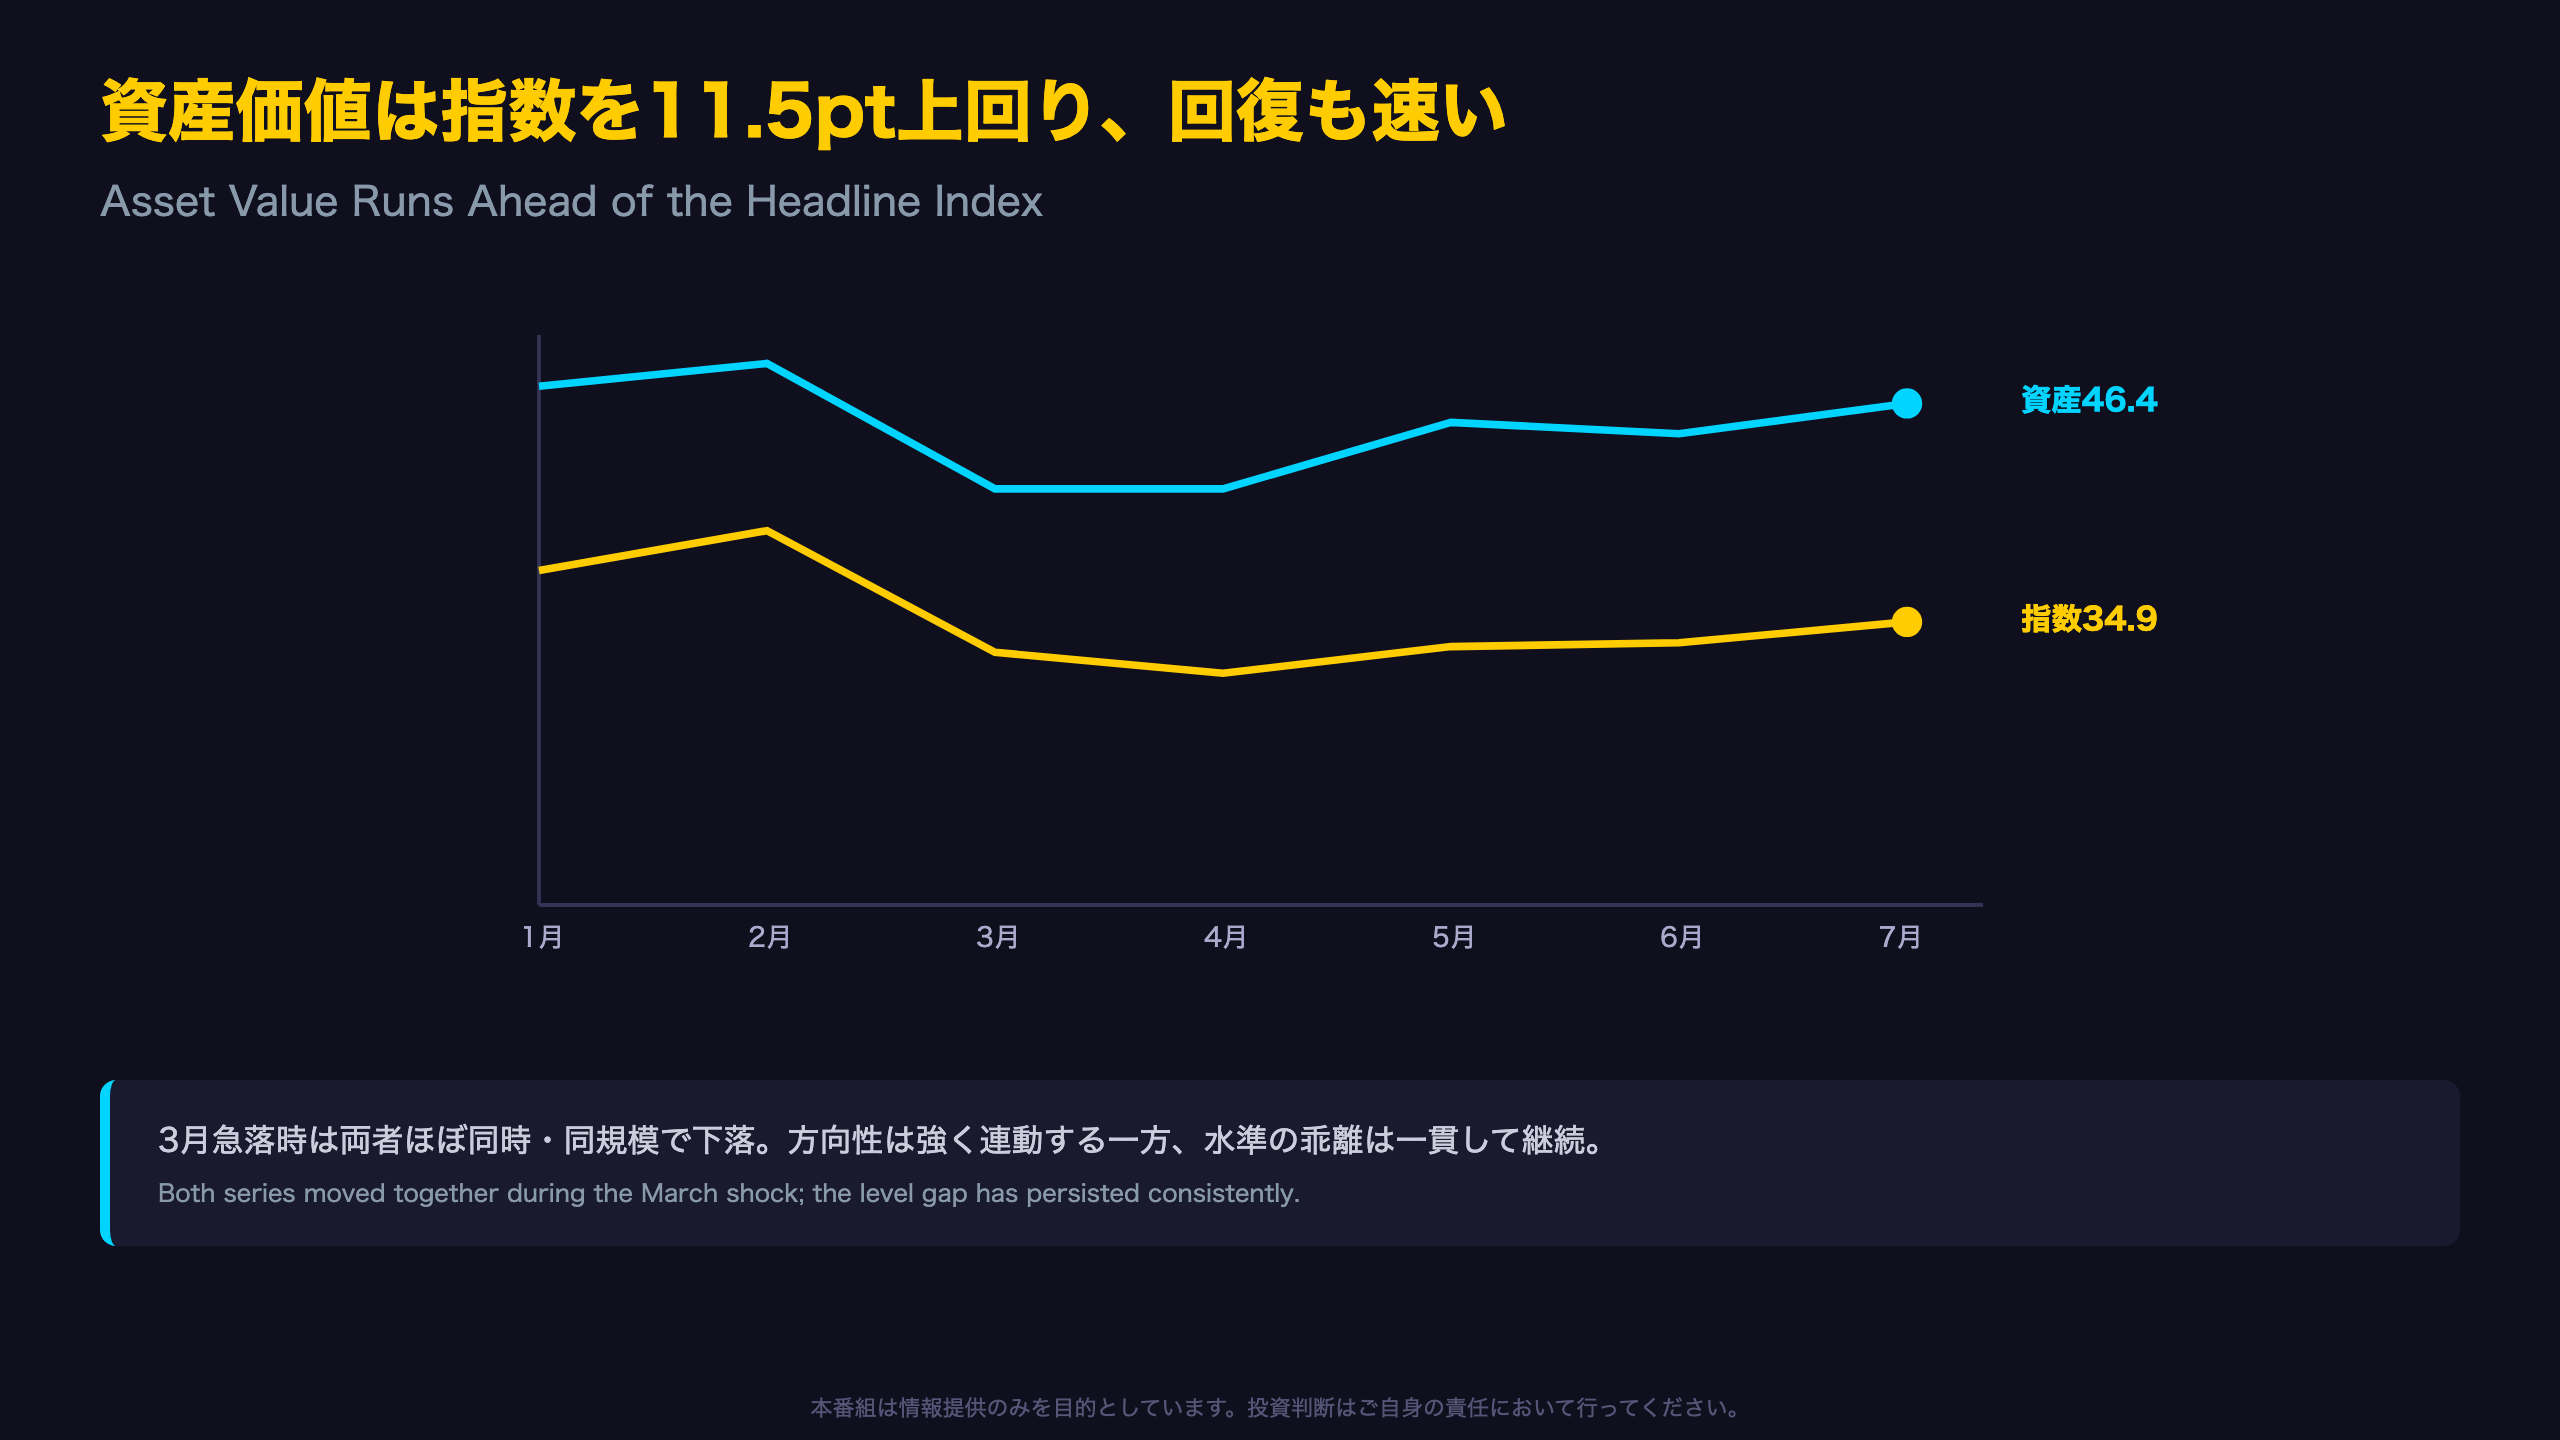
The Asset Value Gap: A Persistent Wealth Divide, or a Leading Indicator?
Beyond the four components that make up Japan’s headline Consumer Confidence Index, the survey tracks a separate asset value expectation covering financial assets and real estate. In July, this rose 1.6 points to 46.4, running 11.5 points above the headline index of 34.9.
Why this gap exists structurally
This is not a new phenomenon. Time-series data show asset-value expectations have consistently run 7-13 points above the composite index for at least the past two years. This is broadly analogous to gaps sometimes observed between equity-market sentiment gauges and broader consumer confidence readings elsewhere — households with financial assets tend to feel more optimistic about their net worth trajectory than the general population feels about jobs and take-home pay.
But direction matters: the two series move together
During March’s shock, the headline index fell 6.4 points while asset value fell 6.6 points, nearly identical. In July, both rose together, 1.1 points and 1.6 points respectively.
Recovery pace comparison
Using January as the pre-shock baseline, the headline index recovered a smaller share of its drawdown by July than asset value did over the same window, suggesting households with asset holdings, typically skewing toward higher-income and older demographics, are recovering forward-looking confidence faster than the broader population.
Wealth divide or leading indicator?
Whether this represents a widening wealth-sentiment divide, or whether asset-value optimism is a leading indicator that will eventually pull broader sentiment higher, cannot be determined from this single report. Watching whether durable-goods sentiment begins to catch up with asset-value optimism will help clarify which interpretation holds.
政策・市場へのインプリケーション
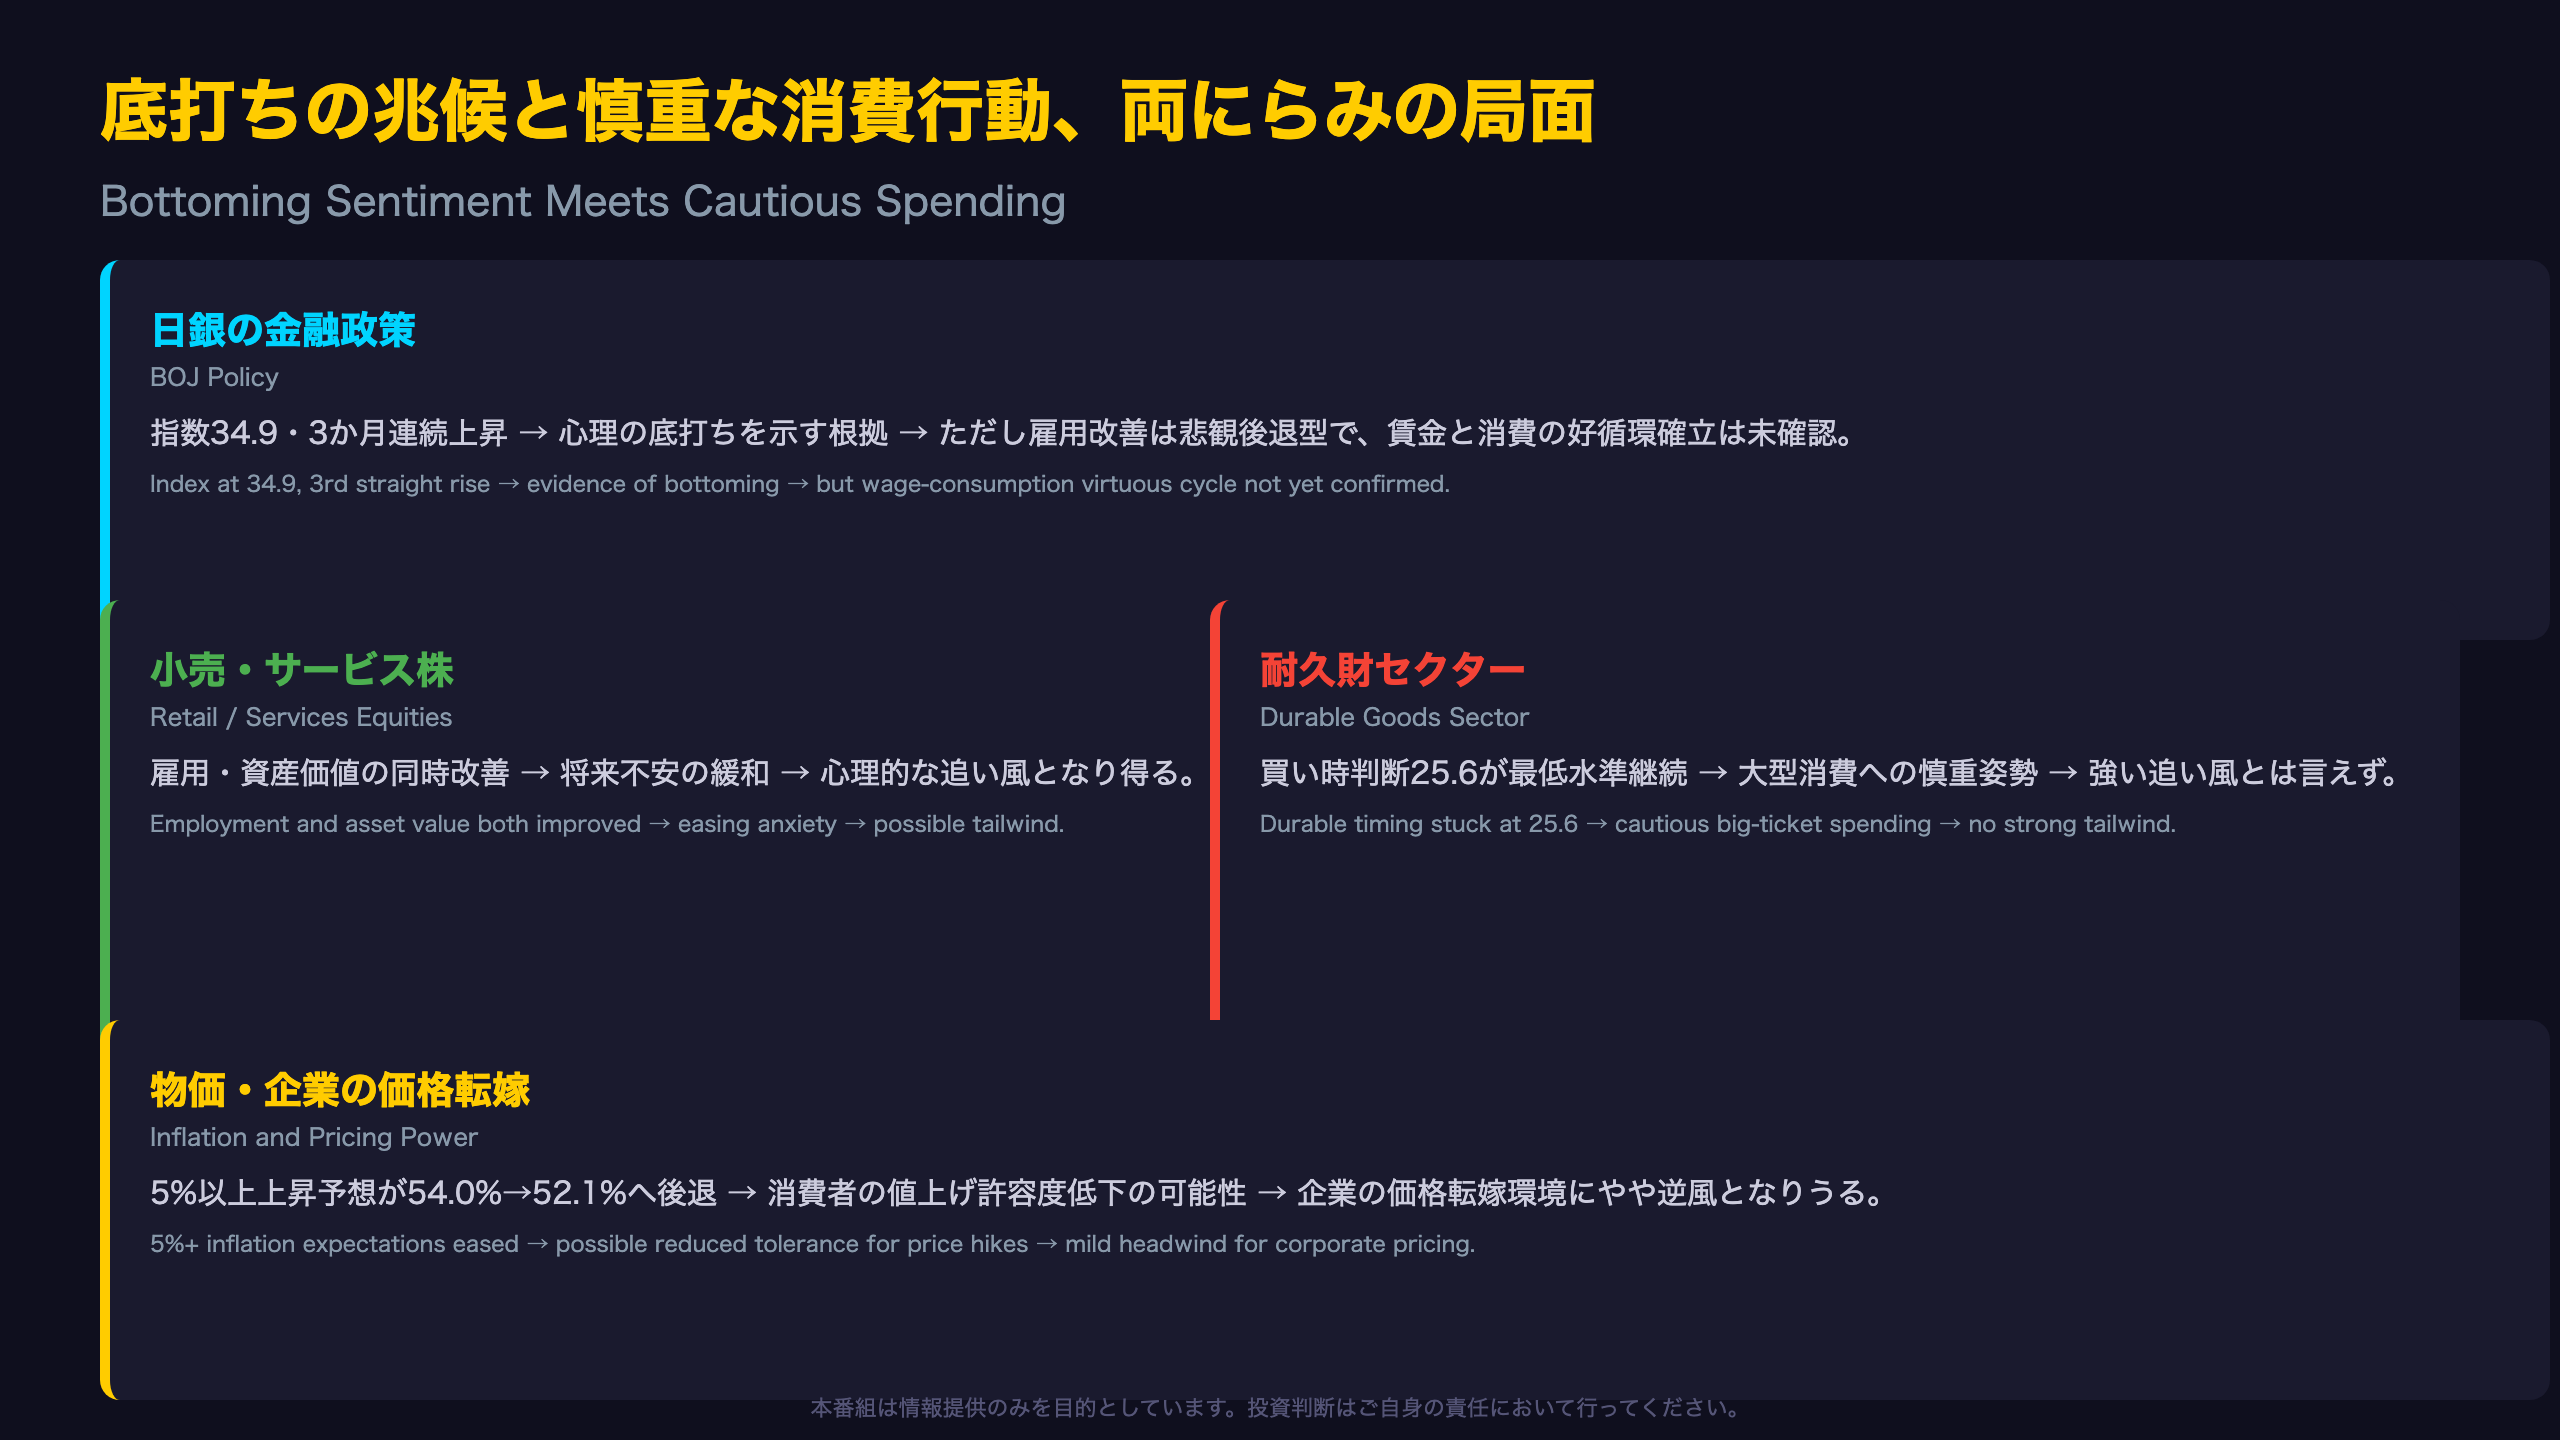
Policy and Market Implications: Following the Evidence Chain
Implications for Bank of Japan policy
Evidence chain: The Consumer Confidence Index rose for a third straight month to 34.9, prompting the Cabinet Office to upgrade its assessment, which constitutes statistical evidence of a sentiment bottoming process. It is generally believed that improving consumer sentiment supports household spending, but this single report cannot confirm that the BOJ’s precondition for further rate hikes, a durable virtuous cycle of wages and consumption, has been established.
This caveat matters because the employment sub-index gain reflects fading pessimism rather than rising optimism, and durable-goods purchase sentiment remains the weakest of all four components at 25.6, hardly the profile of a robust consumption recovery.
Implications for consumer-sector equities
Evidence chain: Employment sentiment and asset-value sentiment improved simultaneously, suggesting households’ anxiety about the future has eased, which could provide a psychological tailwind for retail and services-sector stocks.
However, durable-goods purchase timing sentiment remains the lowest of the four components, meaning big-ticket spending appetite likely remains subdued, so this sentiment data alone does not support a strong tailwind thesis for durable-goods-exposed sectors such as auto retailers or appliance makers.
Implications for inflation and real income dynamics
Evidence chain: The share of households expecting 5%+ inflation fell from 54.0% to 52.1%, indicating a cooling of the most extreme inflation expectations. It is generally believed that cooling inflation expectations can reduce corporate pricing power, but this single data point cannot confirm any direct impact on firms’ price pass-through behavior.
The bottom line for international investors
This report captures a textbook transitional dataset: genuine signs of sentiment bottoming coexisting with persistent softness in durable goods and nuanced inflation expectation shifts. The key variables to watch in the August release are whether the moving-average momentum continues to build, and whether durable-goods sentiment begins to catch up with the stronger asset-value reading.
Disclaimer: This article is for informational purposes only. All investment decisions are made solely at your own risk.